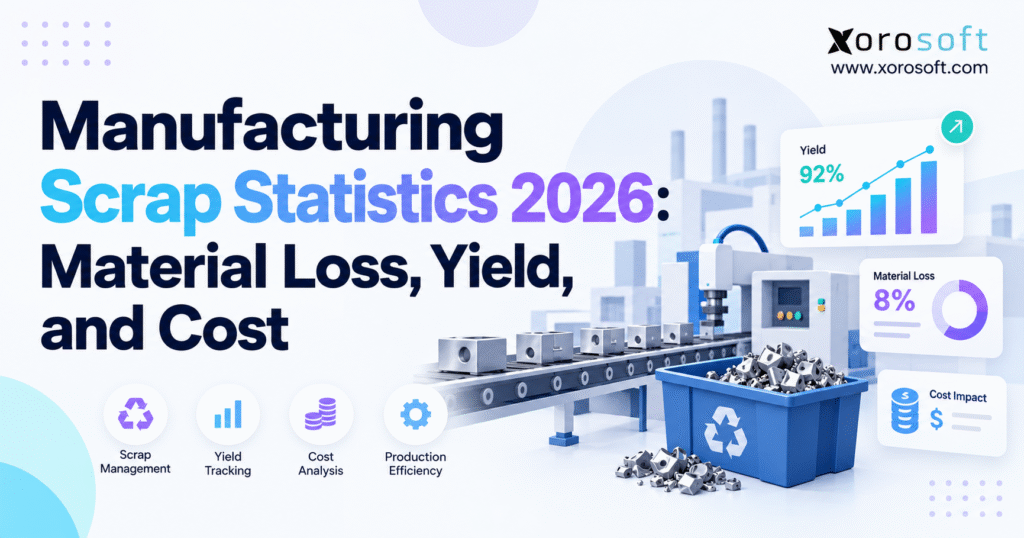
This article explores manufacturing scrap statistics 2026 to provide insight into future industry trends.
1. Why Manufacturing Scrap and Material Loss Damage Profitability
1.1 Manufacturing Scrap Affects More Than Discarded Material
Manufacturing scrap is material or product output that cannot serve its originally intended purpose because of cutting, processing, damage, or failed inspection. For example, a metal shop may produce offcuts, an apparel manufacturer may discard an incorrectly cut fabric panel, and a furniture plant may reject an assembly that fails dimensional inspection. Manufacturers can sell some scrap or send it for recycling. However, other material has no economically practical recovery route.
By the time inspectors reject a component, the business may have paid for materials, labor, machine time, energy, handling, and inspection. Moreover, replacing it can consume reserved capacity, delay another order, and trigger expedited purchasing. Consequently, a scrap percentage without cost context can substantially understate the problem. Managers need to identify when the loss happened, which resources production already consumed, and what value the business can still recover.
1.2 Higher Production Volume Magnifies Small Scrap-Rate Changes
At low volumes, supervisors can sometimes explain losses by walking the floor. However, that approach becomes less reliable as a manufacturer adds product variants, shifts, suppliers, contract factories, and warehouses.
For example, a company processing 20,000 units monthly at a 3% scrap rate rejects 600 units. At 200,000 processed units, the same rate means 6,000 rejects. Therefore, even when the percentage remains unchanged, the absolute amount of material and production capacity lost can increase substantially.
2. Manufacturing Scrap Statistics 2026: What Verified Research Shows
2.1 Defect-Rate Research Is Not a Universal Manufacturing Scrap Benchmark
The National Institute of Standards and Technology’s 2026 manufacturing economy report cites IndustryWeek’s 2024 best-plants research and reports a 2.6% defect rate among a selected group of high-performing facilities. However, this figure does not represent a national manufacturing scrap rate for 2026.
A manufacturer may rework or repair a defective unit, accept it under an approved concession, or discard it permanently. Therefore, only permanent rejection necessarily increases unit scrap.
The same NIST publication repeats an estimated $32.0 billion to $58.6 billion in costs related to defects in U.S. discrete manufacturing. These figures originated in the 2020 Manufacturing Cost Guide. Consequently, they represent historical modeled estimates rather than expenditure observed in 2026.
Furthermore, the report highlights limited national evidence about manufacturing waste and defect losses. Its primary value lies in explaining the scale of the issue and the gaps in consistent measurement, rather than providing a universal benchmark for every factory.
2.2 Quality-Cost Studies Expose Gaps in Financial Visibility
The 2026 ASQE Insights on Excellence research reports that 89% of respondents perceived at least a moderate financial effect from poor quality during its 2025 survey period. Additionally, 37% described the effect as high.
Separate 2025 ASQE cost-of-quality findings indicated that only 31% of respondents felt they fully understood the financial effect of quality costs. However, these findings concern management perceptions and financial visibility rather than directly measured manufacturing scrap rates.
The distinction matters because production and finance often examine different records. For example, a plant may track rejected units on its production board while finance identifies the resulting costs through labor variances, inventory write-offs, and expedited purchases.
When teams cannot connect these records, managers may recognize the problem without knowing which cause deserves investment. Therefore, the ASQ cost-of-quality framework provides a useful basis for separating prevention, appraisal, internal failures, and external failures.
2.3 Recycling and Environmental Waste Numbers Require Careful Interpretation
The EPA’s manufacturing waste analysis reported 1,660 manufacturing facilities initiating more than 3,400 pollution-prevention activities in 2023.
However, these figures cover activities involving chemicals included in the Toxics Release Inventory. They do not represent every form of industrial scrap. Therefore, readers should not use them to calculate average rejection rates for metal, apparel, plastics, or food production.
Similarly, recovery data can mislead managers who treat recycling as a direct measure of production efficiency. For example, a manufacturer that sells more metal offcuts might recover more cash while simultaneously wasting more purchased material.
As a result, a responsible manufacturing scrap statistics 2026 article must distinguish prevented scrap, recoverable materials, process emissions, and defective finished goods. It should also preserve every source’s original reporting year, measurement basis, and limitations.
2.4 Compare Statistics Only When Definitions and Periods Match
| Research measure | Reported finding | Correct interpretation |
|---|---|---|
| Defect rate among selected high-performing plants | 2.6% | IndustryWeek 2024 sample referenced by NIST in 2026 |
| Estimated U.S. discrete-manufacturing defect costs | $32.0B–$58.6B | Historical 2020 model reproduced in the 2026 NIST report |
| Respondents reporting at least moderate financial impact from poor quality | 89% | ASQE 2025 survey responses published in 2026 |
| Respondents fully understanding quality costs’ financial effect | 31% | ASQE 2025 survey finding |
| Manufacturing facilities initiating pollution-prevention activities | 1,660 | EPA 2023 chemical-reporting population |
Overall, manufacturers should use published findings for context and rely on comparable internal records when setting improvement targets. In addition, every target should reflect the same product family, process, inspection standard, denominator, and reporting period as its baseline.
3. Scrap Rate, Defect Rate, and Production Yield Are Different KPIs
3.1 Scrap Rate Measures Permanent Rejection; Defects Include Recoverable Units
Scrap rate usually describes permanently rejected units divided by units processed within a defined operation. Meanwhile, defect rate counts units that fail a requirement, even when teams can correct them later. Rework rate captures units requiring additional processing to meet specifications.
Although these measures overlap, they answer different questions. Therefore, manufacturers should avoid treating them as interchangeable indicators.
For example, suppose a line processes 1,000 components. Inspectors scrap thirty, operators successfully rework forty, and 930 pass immediately. The unit scrap rate is 3%, while first-pass yield is 93%.
The plant ultimately receives 970 acceptable units. However, forty of them consumed additional labor and machine capacity. Reporting only final acceptable output would conceal that effort, while reporting all seventy initially nonconforming units as scrap would exaggerate permanent material loss.
3.2 Material Yield Captures Physical Conversion Efficiency
Material yield compares usable output with input in consistent units, such as kilograms, pounds, meters, or liters.
For example, manufacturers operating cutting, refining, drying, or food-processing lines may gain more insight from material yield than from finished-unit defect rates.
However, teams must account for normal physical transformations. Moisture removed during drying, metal machined away as intended, and reusable trimmings do not carry identical economic or quality implications.
| KPI | What it measures | Key limitation |
|---|---|---|
| Scrap rate | Permanently rejected units / processed units | Excludes successfully reworked items |
| Defective-unit rate | Units failing requirements / units evaluated | Some failed units remain recoverable |
| Rework rate | Units requiring correction / processed units | Adds labor and capacity costs |
| Material yield | Usable output mass / input mass | Requires clear treatment of process losses |
| First-pass yield | Units passing immediately / units entering process | Falls even when teams recover rejected units |
Consequently, a reliable performance dashboard should report several complementary indicators rather than relying on a single plant-wide percentage.
3.3 Establish the Measurement Boundary Before Comparing Plants
Different departments can produce different numbers from the same production run. For instance, one department records rejected finished units, another tracks defects at each operation, and finance records the financial write-off after final disposition.
An item that fails two inspections can generate two defect observations but only one defective unit. Therefore, the problem is not necessarily the count itself but the lack of a consistent measurement definition.
Before comparing facilities, document the process boundaries, reporting period, denominator, unit of measure, and conditions for permanent scrap classification. This approach improves accuracy and makes future comparisons more meaningful.
4. Manufacturing Scrap Rate and Material Yield: Calculation Examples
4.1 Formula for Calculating the Manufacturing Scrap Rate
Scrap rate (%) = (Scrapped units ÷ Total units processed) × 100.
For example, a production line processes 12,500 components during a month and permanently scraps 375. Its scrap rate is 3%.
However, teams must apply the same counting rules in the following month, especially when they track partially completed units or multiple rejection events.
If production shifts toward difficult custom products, managers should identify the product-mix change before attributing a higher scrap rate to poor execution.
Therefore, a reliable benchmark begins with comparable SKUs, tooling, material grades, and specifications. Management can then investigate differences by supplier lot, machine, shift, and scrap reason.
4.2 Material Yield Formula for Raw Material Loss
Material yield (%) = (Usable output mass ÷ Input material mass) × 100.
Assume a batch consumes 1,000 kilograms of input and produces 920 kilograms of usable output. In this case, material yield is 92%.
The remaining 80 kilograms might include 30 kilograms of reusable trim, 20 kilograms of recoverable scrap, and 30 kilograms of unrecoverable process loss.
Therefore, production teams should identify each category rather than treating all 80 kilograms as defective finished output.
In addition, manufacturers should distinguish approved process loss from abnormal failure. Although material yield helps explain purchasing requirements, not every kilogram absent from the finished product represents preventable waste.
4.3 First-Pass Yield and Rolled Throughput Yield
First-pass yield (%) = (Units accepted without correction ÷ Units entering the operation) × 100.
For example, a line accepting 950 of 1,000 units immediately achieves 95% FPY.
In a simplified two-stage production route with first-pass yields of 95% and 97%, rolled throughput yield equals 0.95 × 0.97 = 92.15%.
Consequently, small quality losses at individual stages can create larger end-to-end effects. By tracking FPY alongside scrap and rework, manufacturers can identify both permanent material losses and the additional effort required to recover defective units.
5. Manufacturing Material Loss Statistics by Industry and Process
5.1 Metal Fabrication Scrap: Planned Offcuts Versus Preventable Rejects
Metal fabrication generates kerf, chips, offcuts, and components that fail dimensional tolerances. Some removal is unavoidable because the manufacturing process must transform larger material into the required geometry.
However, other losses result from poor cutting layouts, tool wear, incorrect setup, handling damage, or inconsistent purchased stock.
The NIST report references an older USGS estimate indicating that approximately 15% of steel mill products became scrap during manufacturing in research cited from 2001.
Nevertheless, manufacturers should not treat that historical figure as a 2026 machining benchmark. Instead, individual plants should measure actual material utilization by product geometry and separate quality failures from planned removal.
5.2 Plastics Scrap: Startup Loss, Molding Defects, and Regrind
Injection molding and extrusion operations can generate short shots, flash, purging loss, contaminated material, runners, and rejected molded parts.
Furthermore, plant-wide averages may conceal recurring issues involving one mold, resin grade, machine setting, or changeover.
Therefore, manufacturers should classify losses by these factors while distinguishing normal startup waste from unusual scrap after the process stabilizes.
Regrind may recover some material value. However, permitted usage depends on product quality requirements and traceability needs. Since recovery also requires handling and testing, companies should track physical scrap separately from financial recovery.
5.3 Food Manufacturing Yield: Trim, Spoilage, and Batch Rejection
Food and beverage manufacturers face trim loss, spoilage, evaporation, overfill, processing residues, and rejected batches.
For example, a food processor may measure usable kilograms of finished output per kilogram of ingredient input rather than relying only on rejected package counts.
However, managers should separate normal dehydration and necessary trimming from preventable spoilage or avoidable quality failures.
In addition, lot-level records help teams investigate contaminated ingredient deliveries or storage problems that affect several production batches.
Consequently, production managers should connect batch yield with ingredient lots and expenses related to testing, cleaning, disposal, and replacement production.
5.4 Apparel and Furniture Manufacturing: Cutting Efficiency and Material Utilization
Fabric width, marker planning, pattern shapes, shade consistency, and cutting quality influence apparel yield. Similarly, panel dimensions, wood defects, upholstery layouts, and assembly damage affect furniture manufacturing.
An inefficient cutting plan may waste significant purchased material before inspectors examine finished products.
Therefore, manufacturers should record planned cutting utilization alongside actual consumption.
Moreover, they should separate reusable remnants from damaged stock and rejected finished goods.
The manufacturing scrap statistics 2026 most useful to these industries often involve internal yield trends by style, layout, production order, or material batch rather than generic industry averages.
6. Manufacturing Scrap Costs: Materials, Labor, and Recovery Value
6.1 Calculate the Full Cost of Manufacturing Waste Without Double-Counting
The cost of a rejected product depends on how far it progresses through production. For example, a component discarded before assembly may represent mainly raw material expenses.
By contrast, the same component rejected after machining, assembly, and inspection may carry material, labor, and applied overhead.
Additional expenses can include special handling, disposal, inspection, or replacement production. However, finance should add these amounts only when the existing production cost does not already include them.
For reliable manufacturing scrap statistics 2026, finance and production must agree on a consistent valuation method.
Manufacturers should also avoid using retail selling prices as direct scrap costs because lost revenue and manufacturing expenses represent different financial measures.
Likewise, adding labor and overhead a second time to the full inventory cost of a rejected assembly exaggerates the loss. Instead, finance should create a clear cost bridge that reconciles with the general ledger.
6.2 Net Scrap Cost Formula and Example
Net scrap cost = Scrap-attributable production cost + Additional handling/disposal expenses − Net recovery value.
For example, imagine a rejected part carrying $14 in materials and $9 in conversion costs. Its accumulated production cost equals $23.
The recycler pays $4 after freight and processing, while exceptional handling adds another $1.
Therefore, the modeled net loss equals $23 + $1 − $4 = $20.
| Cost element | Illustrative amount per rejected component |
|---|---|
| Direct material already consumed | $14 |
| Conversion cost already assigned | $9 |
| Additional handling | $1 |
| Net recovery proceeds | −$4 |
| Net manufacturing scrap cost | $20 |
However, recovery value can fluctuate with commodity markets. A rising salvage price might reduce net financial losses even when physical scrap increases.
Consequently, manufacturers should track gross scrap quantity, cost before recovery, and recovery proceeds separately.
6.3 Understand How Scrap Affects Product Margin and Cash Needs
A product selling for $80 with a planned manufacturing cost of $55 appears to generate $25 of gross profit per accepted unit.
However, when rejected output forces additional material consumption and production time, actual unit costs increase.
Meanwhile, purchasing teams may notice the cash pressure before finance completes monthly cost allocation. Replacement production can also disrupt promised delivery dates.
Therefore, manufacturing scrap statistics 2026 should connect physical waste with purchasing requirements, gross margin, inventory valuation, and working capital.
Ultimately, managers need to understand not just how many products the factory rejects but how much avoidable cost acceptable output must absorb.
7. Manufacturing Scrap Statistics 2026: Savings From Lower Scrap Rates
7.1 Calculate the Benefit of a One-Percentage-Point Reduction
Moving from a 4% scrap rate to 3% represents a one-percentage-point reduction and a 25% relative decrease in rejected units when throughput remains unchanged.
For example, at 100,000 processed units, the plant avoids 1,000 rejects.
Using the $20 net cost from the previous example, the modeled annual saving equals $20,000.
However, this is an illustrative calculation rather than a measured industry result.
| Scrap rate | Scrapped units per 100,000 processed | Net loss at $20 per scrapped unit |
|---|---|---|
| 5% | 5,000 | $100,000 |
| 4% | 4,000 | $80,000 |
| 3% | 3,000 | $60,000 |
| 2% | 2,000 | $40,000 |
| 1% | 1,000 | $20,000 |
7.2 Distinguish Avoided Spending From Potential Capacity Gains
Preventing scrap may reduce material purchases and unnecessary repeat work. In addition, it may release machine capacity.
However, that capacity creates a financial benefit only when the business reduces operating expenses or uses it for additional profitable output.
Therefore, counting both the full rejected-item cost and the same recovered capacity as separate savings can exaggerate the return.
Furthermore, managers should compare similar product mixes, inspection standards, production volumes, and salvage assumptions.
A trustworthy manufacturing scrap statistics 2026 scorecard should explain these assumptions and verify projected savings against actual purchasing and accounting records.
8. Manufacturing Scrap and Yield Variances in BOM and Inventory Planning
8.1 Use Planned Yield Allowances Without Hiding Inefficient Production
A bill of materials describes expected component requirements. However, unavoidable process loss may require planners to include an approved yield allowance.
For example, if each acceptable product requires 2.0 kilograms of usable material and the process achieves a stable 95% yield, theoretical input equals approximately 2.0 ÷ 0.95 = 2.105 kilograms before separate safety allowances.
Nevertheless, automatically increasing standard requirements whenever a production line performs poorly can make avoidable waste permanent.
Therefore, manufacturers should maintain engineering-approved standards separately from actual work-order consumption.
Otherwise, purchasing plans and future cost estimates absorb higher scrap while the underlying production problem continues.
8.2 Reconcile Raw Materials, Work in Process, and Usable Finished Goods
A reliable work-order balance covers material issues, returns, remaining work in process, approved finished output, scrap, and recovery.
Moreover, physical quantities must reconcile with financial values.
For example, duplicated material issues, incorrect units of measure, or delayed stock returns can create apparent scrap even when production operates correctly.
For growing businesses, Xorosoft manufacturing ERP connects manufacturing-related workflows with inventory, purchasing, and accounting.
As a result, the platform is relevant to cross-functional reconciliation. However, manufacturers should test precise scrap reason codes, costing procedures, and shop-floor capture methods during evaluation instead of assuming every capability exists.
8.3 Explain Normal Versus Abnormal Scrap in Manufacturing Accounting
Normal process loss and abnormal waste may require different treatment under applicable accounting standards and company costing policies.
For example, actual material consumption and conversion costs can produce variances under standard costing.
Therefore, finance should document when losses belong in acceptable product costs, when they require separate recognition, and how the company records scrap recovery.
Additionally, teams should investigate unusual consumption rather than relying on balancing journal entries.
The operations team should trace each significant variance to a work order and physical event. Meanwhile, finance should confirm how the valuation flows into the appropriate accounts.
CTA #1 — Free ERP Readiness Assessment: If your team struggles to explain production variances across manufacturing, inventory, and accounting records, review whether your current systems provide the traceability needed for reliable cost control.
9. How to Reduce Manufacturing Scrap and Rework Costs
9.1 Identify the Process Causes Behind Material Waste
Excessive scrap may originate with supplier defects, incorrect machine settings, worn tools, unclear instructions, inefficient cutting layouts, or handling damage.
However, broad categories such as “production error” rarely provide enough information for corrective action.
For example, when defects repeatedly appear in one supplier lot, purchasing and quality teams need evidence that identifies the material problem rather than blaming the production operator.
Therefore, manufacturers should prioritize recurring net costs, not merely the frequency of reject codes.
A small number of expensive assemblies can cost more than thousands of low-value trimmings. As a result, effective analysis should consider scrap quantity, production stage, material value, recoverability, and recurrence.
9.2 Improve Setup, Maintenance, and First-Piece Inspections
First-piece inspections can identify incorrect dimensions or molding parameters before they affect an entire run.
Similarly, preventive maintenance helps control tooling wear and equipment drift.
Where appropriate, statistical process control can highlight variation before product characteristics exceed acceptable limits.
However, these methods depend on clear standards, proper sampling, and consistent corrective action.
In addition, employees need confidence to report problems accurately. A supervisor who penalizes every recorded reject may encourage incomplete data.
Therefore, managers should review first-pass yield and rework alongside scrap rates.
Better manufacturing scrap statistics 2026 depend on reliable reporting practices as much as on software or inspection equipment.
9.3 Feed Findings Back to Purchasing and Engineering
Incoming material quality, product design, and production capability influence one another.
For instance, purchasing needs evidence about recurring supplier defects, while engineering needs to understand how tight tolerances, material dimensions, or cutting geometry contribute to waste.
Therefore, teams should share specific measurements and batch references rather than requesting general quality improvements.
| Recurring cause | Practical intervention | Metric to watch |
|---|---|---|
| Setup variation | First-piece approval | Startup scrap per changeover |
| Supplier material inconsistency | Incoming checks and supplier feedback | Rejections by supplier lot |
| Tooling wear | Preventive maintenance | Scrap by tool and work center |
| Poor cutting layout | Pattern or nesting optimization | Usable output per sheet or roll |
10. Manufacturing Scrap Tracking by Work Order, Lot, and Location
10.1 Record Scrap as Soon as Operators Discover It
A useful scrap transaction identifies the work order, material code, operation, quantity, unit of measure, reason, timestamp, and disposition.
Additionally, quality-critical operations may require lot or serial identification.
However, teams should not classify material on quality hold as permanent scrap until an authorized reviewer determines its disposition.
For example, inspectors might reject 18 kilograms of fabric because an operator used an incorrect cutting marker.
The transaction should identify the material lot, production operation, rejection reason, supervisor approval, and recovery decision.
Consequently, finance can assign costs accurately while production teams investigate the cause instead of burying the loss in a monthly adjustment.
10.2 Align Warehouse Movements With Manufacturing Scrap Records
If rejected material remains available in the warehouse system, staff may allocate stock that cannot safely or economically fulfill an order.
Therefore, disposal, quarantine, recovery, and return-to-stock transactions should agree with production and accounting records.
This becomes especially important when manufacturers operate several warehouses or use outsourced production facilities.
A warehouse management system can support location-level inventory movements.
In a Xorosoft environment, connected warehouse and manufacturing information is relevant to explaining stock discrepancies.
However, accurate results still depend on proper transaction recording and configured workflows.
10.3 Use a Cost-Weighted Dashboard Rather Than a Single Plant Average
An executive scorecard should include scrap rate, material yield, first-pass yield, rework, and net scrap cost.
Meanwhile, production supervisors need detailed results by SKU, line, shift, machine, supplier lot, and reason code.
Finance also needs clear costing assumptions and reconciliation information.
Therefore, every department should use consistent definitions.
A strong manufacturing scrap statistics 2026 dashboard distinguishes genuine operational improvement from changes in product mix, production volume, or accounting assumptions.
11. Scrap Tracking Software: Spreadsheets Versus Integrated ERP
11.1 Match Scrap Tracking Tools to Manufacturing Complexity
Spreadsheets can work for small, stable production processes with limited SKUs and disciplined inventory controls.
However, as manufacturers add products, facilities, and complex workflows, manual reconciliation becomes more difficult.
Standalone inventory software may improve stock visibility, although manufacturing and accounting integration varies by product.
By contrast, a connected ERP can bring work orders, inventory, purchasing, and accounting into a shared operational environment.
Nevertheless, ERP implementation typically requires more planning, investment, and process discipline.
| Evaluation factor | Spreadsheets | Standalone inventory software | Connected ERP |
|---|---|---|---|
| Initial implementation | Usually straightforward | Varies | Typically more structured |
| Work-order references | Often manual | Product-dependent | Can align with manufacturing |
| Multi-location stock | Manual reconciliation | Often supported | Can connect broader operations |
| Production costing | Separate model | Integration-dependent | Can connect production and accounting |
| Suitable operation | Simple, controlled workflows | Inventory-focused growth | Cross-functional complexity |
11.2 Test Real Scrap Scenarios During an ERP Evaluation
Instead of asking whether software includes scrap tracking, manufacturers should demonstrate actual production scenarios.
For example, material enters a work order, inspectors reject a component, operators rework another item, and the warehouse receives recoverable scrap.
Next, the team should verify how each transaction affects inventory, work-order cost, approvals, and financial reporting.
Xorosoft’s connected cloud ERP provides an integrated context for inventory, purchasing, manufacturing, and accounting.
However, manufacturers should confirm that the proposed configuration supports their required scrap dispositions, traceability depth, costing methods, and reporting processes.
CTA #2 — Watch Demo: Explore how connected manufacturing, inventory, purchasing, and accounting workflows can reduce manual reconciliation and help teams investigate material variances.
12. Why Production Scrap Affects Wholesale and Ecommerce Availability
12.1 Forecast Acceptable Output, Not Just Planned Production Starts
Manufacturers supplying wholesale customers and ecommerce orders need reliable estimates of acceptable finished output.
However, planning 5,000 production starts does not guarantee 5,000 saleable units.
Therefore, planning should consider approved yield assumptions while continuing to measure preventable scrap separately.
For example, an order requiring 9,500 acceptable units with an expected 95% final yield calls for approximately 10,000 production starts under a simplified unit model.
Planners should then compare actual output with that assumption.
Otherwise, persistent yield shortfalls can increase purchasing requirements, disrupt delivery commitments, and reduce available-to-promise inventory.
12.2 Keep Quality Status Separate From Sellable Stock
A production line can finish an item while quality teams keep it on hold for further inspection.
Therefore, physical completion should not automatically make every unit available across sales channels.
Manufacturers selling through Shopify and wholesale accounts need clear inventory status rules so rejected or quarantined products do not enter fulfillment allocation.
The Xorosoft ERP listing in the Shopify App Store is relevant to ecommerce order and inventory integration.
However, channel integration should not imply automatic machine-level defect detection.
Instead, its operational value comes from helping businesses maintain accurate inventory information across connected selling and fulfillment workflows.
For multi-channel manufacturers, manufacturing scrap statistics 2026 become more valuable when usable production output supports reliable order promises rather than appearing only in quality reports after delivery dates have passed.
13. Manufacturing Scrap Statistics 2026: A 30-Day Improvement Plan
13.1 Week One: Establish Loss Definitions and the Baseline
First, select two high-value SKUs or production lines.
Next, define permanent scrap, rework, planned process loss, and recoverable byproducts.
Assign one owner for physical quantities and another for financial valuation.
Then, review historical records, identify gaps, and establish a consistent reporting period.
As a result, the team can compare future results against a trustworthy baseline rather than relying on incomplete estimates.
13.2 Weeks Two and Three: Capture Scrap and Correct Recurring Causes
During the next two weeks, record losses when operators discover them, including work order, material, quantity, reason, and disposition.
Meanwhile, reconcile daily inventory movements and identify the largest recurring net costs.
Next, pilot a targeted corrective action, such as improved setup verification, supplier quality checks, or revised cutting layouts.
However, keep inspection standards consistent so any reported improvement reflects genuine production efficiency rather than weaker quality controls.
13.3 Week Four: Validate Financial Benefits and Assign Ongoing Ownership
Finally, compare similar production periods and confirm that changes in product mix, reporting quality, or costing assumptions did not create misleading results.
Then, calculate avoided material and conversion costs after accounting for recovery proceeds and intervention expenses.
Publish a short review identifying the finding, corrective action, responsible owner, and next checkpoint.
Where teams maintain fragmented production, inventory, and accounting records, they may also consider Xorosoft as part of a broader connected-operations assessment.
Ultimately, the objective is reliable measurement and repeatable improvement.
14. Use Manufacturing Scrap Benchmarks to Protect Margins
14.1 Turn 2026 Manufacturing Scrap Statistics Into a Practical Decision
Published research provides useful context. However, a manufacturer’s own trustworthy baseline remains its most actionable benchmark.
Therefore, teams should measure permanently rejected units and physical material loss separately, assign defensible costs, and prioritize recurring problems with the greatest preventable financial impact.
In addition, they should connect the findings to BOM planning, purchasing, warehouse movements, and accounting reconciliation.
Ultimately, manufacturing scrap statistics 2026 should help leaders decide where to improve processes, when to challenge material standards, and whether disconnected systems conceal the real financial impact of waste.
Small improvements become meaningful when teams measure consistently and verify the resulting savings.
14.2 Evaluate Connected Systems When Manual Reconciliation Becomes a Risk
Manufacturers with complex work orders, multiple warehouses, and recurring inventory adjustments may benefit from connecting manufacturing, purchasing, inventory, and finance.
For example, teams struggling with manual variance reconciliation may evaluate Xorosoft as part of a broader operational improvement initiative.
However, they should require demonstrations of their specific scrap capture, inventory, costing, and reporting workflows before selecting a system.
CTA #3 — Book a Personalized Demo: If your team cannot reliably trace material from production issue through rejected output and financial reporting, contact Xorosoft to discuss your process requirements and assess how connected operations could improve visibility and cost control.
Frequently Asked Questions
What is the average manufacturing scrap rate in 2026?
No universal 2026 scrap-rate average applies across manufacturing. Use benchmarks specific to your materials, production processes, and measurement methods.
How do you calculate manufacturing scrap rate?
Divide scrapped units by total units processed, then multiply by 100. For example, 300 scrapped units from 10,000 processed equal 3%.
What is the difference between scrap rate and first-pass yield?
Scrap rate measures permanently rejected units. First-pass yield measures units accepted without rework; repaired units may lower first-pass yield without increasing scrap.
How does manufacturing scrap affect profitability?
Scrap consumes materials and production capacity. Additional rework, disposal, and replacement costs can raise unit costs and reduce gross margins.
How does scrap affect BOM planning and inventory?
Expected losses affect BOM material requirements. Unexpected scrap increases consumption and creates inventory variances that purchasing and finance must reconcile.
How can manufacturers reduce scrap and rework?
Track loss by work order and cause. Improve setup checks, equipment maintenance, supplier quality, and cutting plans; measure results against a consistent baseline.
How can ERP software improve manufacturing scrap tracking?
ERP can connect work orders, inventory movements, purchasing, and accounting. When teams accurately record scrap, they can investigate consumption variances and costs more efficiently.
Recent Posts
-
 How to Calculate Ecommerce Warehouse Capacity Before Peak Season
-
 Manufacturing Scrap Statistics 2026: Material Loss, Yield, and Cost
-
 ERP Software for Cosmetics Distributors Managing Lots, Wholesale, and Ecommerce
-
 Xorosoft vs Cin7 Core for Multi-Warehouse Wholesale Operations
-
 How a Multi-Warehouse Company Reduced Inventory Reconciliation Work at Month-End