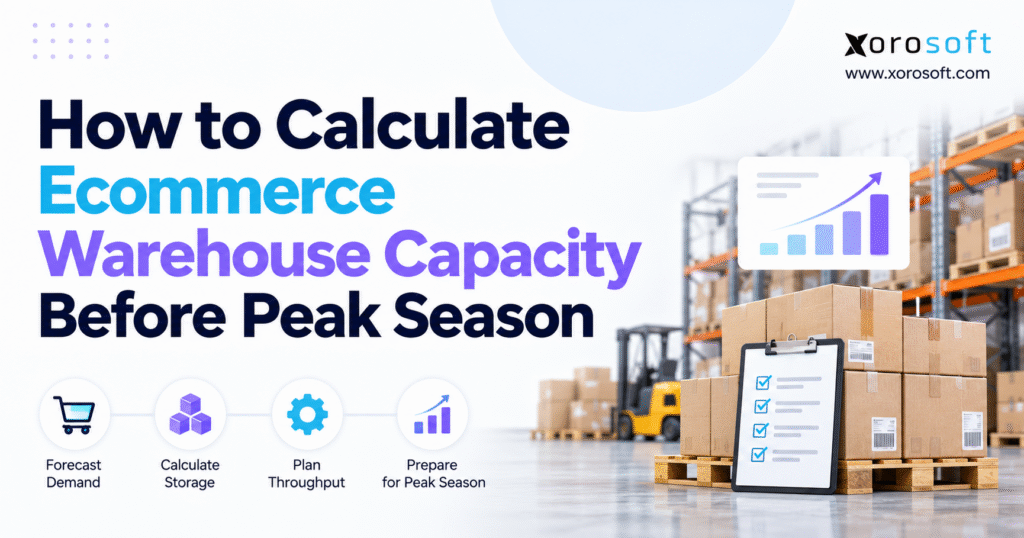
When planning for efficient storage, understanding the basics of warehouse capacity calculation is essential.
1. Why Peak Season Makes Warehouse Capacity Planning Harder
1.1. How Holiday Orders Push Storage and Shipping Limits
The busiest shipping day and the day with the most stock are often different. An apparel brand may receive its winter collection three weeks before Black Friday, filling reserve racks long before order volume peaks. Once sales events begin, that brand might free up storage positions while running out of packing-station capacity. A warehouse capacity calculation that looks only at December 1 inventory or average daily orders misses both pressures.
Adobe’s September 2026 holiday forecast projected $275.1 billion in US online spending during November and December 2026, up 6.7% year over year. However, that figure is a national forecast, not a recommended sales-growth assumption for an individual merchant. Instead, teams should model their own sales calendar, sales history, and inbound plan.
1.2. Why Empty Space Does Not Mean Enough Warehouse Capacity
For example, a warehouse might hold 1,200 pallets and expect only 1,050 at peak. At first, that seems comfortable. However, some empty locations may be too small for bulky goods or too far from pickers for same-day dispatch.
Good planning therefore identifies the first constraint likely to fail. Sometimes it is full racks; sometimes it is putaway (moving goods to storage), restocking pick bins, packing benches, staff, or carrier pickup. Capacity planning should lead to a clear set of actions rather than a misleading yes-or-no answer about available square footage.
2. What a Warehouse Capacity Calculation Must Measure
2.1. Measure Floor Space, Storage Slots, and Daily Workload
Physical capacity shows the floor space and storage height inside a building. Location capacity counts the safe pallet, shelf, or bin spots that fit the products being stored. Daily work capacity shows what the site can handle in a set time, such as pallets put away per shift or orders dispatched before the afternoon cutoff.
However, do not treat these numbers as the same thing. A cubic-foot measurement does not establish the number of pallets that fit on racks. Likewise, a building with spare racking may still have no available picking slots for a fast-selling item.
| Capacity measure | Typical unit | Question answered |
|---|---|---|
| Net storage footprint | Square feet | How much space is set aside for storage? |
| Nominal storage cube | Cubic feet | What volume does the storage envelope provide? |
| Compatible storage locations | Pallet positions or bins | Where can forecast inventory actually fit? |
| Location occupancy | Percentage | How much of usable location capacity is committed? |
| Receiving and outbound throughput | Pallets, lines, or orders per shift | Can work be completed before deadlines? |
2.2. Set the Time Frame for Your Warehouse Capacity Plan
Record whether the plan covers a full day, a shift, or the hours before a carrier collection. For example, a picker can process enough lines in a 12-hour day while orders still miss a 4 p.m. handoff. Therefore, warehouse capacity planning should work backward from the dispatch promise, accounting for receiving deadlines, restocking, picking, packing, labeling, and loading.
A business might end a day with 950 occupied locations but temporarily need 1,080 during the morning because an inbound trailer arrives before outbound pallets leave. Instead, plan for the highest occupancy during the day, not just the average or closing stock. That is the foundation of a useful warehouse capacity calculation for peak season.
3. Get the Data for an Accurate Warehouse Capacity Calculation
3.1. Check Warehouse Layouts and Storage Locations
Start with the latest site drawing, then walk the building. Measure total floor space, storage zones, usable storage height, aisles, receiving docks, packing, shipping, returns, and quarantine areas. Confirm which locations are blocked, damaged, being repaired, or reserved for specific product types. However, do not assume an old layout reflects the warehouse after stock moves or equipment changes.
Make sure a list of warehouse locations matches what the team sees on the floor. Group locations by rack, shelving, floor stack, and any temperature or hazard limits.
3.2. Gather SKU, Purchase, and Order Data for Capacity Planning
Match SKU dimensions, weight, case packs, pallet limits, sales pace, current stock, and dated purchase orders. Also, count stock held for wholesale customers even if it has not been physically shipped. Returns awaiting inspection should count against space while remaining excluded from sellable stock until approved.
Order history should include lines per order and how each channel sells. In addition, use actual labor hours, exception rates, and carrier schedules to understand productive capacity. Where systems disagree, match stock counts and entry times before trusting the model; otherwise a neat formula can still give a wrong result.
4. How to Calculate Warehouse Space and Storage Volume
4.1. Find Usable Warehouse Space From Floor Plans
The basic floor-space formula is straightforward:
Net storage footprint = Gross floor area − Space assigned to other work areas.
For example, suppose a distribution site occupies 20,000 square feet. A measured 12,000 square feet is allocated to travel aisles, receiving, staging, packing, shipping, offices, and other functions that are not part of storage zones. The remaining 8,000 square feet is its net storage footprint. However, exclude each area only once; otherwise the capacity number becomes too low.
This is a planning choice, not permission to convert aisles or emergency access into storage. Above all, safety controls take priority over the arithmetic. OSHA’s materials-handling standard, 29 CFR 1910.176 requires clear passageways and secure storage where applicable in the United States. Relevant building, fire, equipment, and applicable Canadian safety rules must also be checked before changing the layout.
4.2. Calculate Warehouse Cubic Storage Capacity
For the cubic part of a warehouse capacity calculation, use:
Nominal storage-zone cube = Net storage footprint × Usable storage height.
For example, at 8,000 square feet and 18 feet of usable storage height, the result is 144,000 cubic feet. Still, that number describes a storage envelope, not 144,000 cubic feet of merchandise that can be physically packed into the building. Racks, clearances, carton gaps, and product shape reduce real usable capacity.
For shelving, pallet racks, bulk floor stacks, and refrigerated zones, calculate the available envelope separately. For instance, a high ceiling might have little practical value for heavy furniture that cannot be safely stacked, while several levels of suitable racking can support small, stable cases.
5. Warehouse Storage Capacity: Count Pallet Spots and Bins
5.1. Count Pallet Spots and Bins for Warehouse Capacity
A simplified rack calculation is:
Rack positions = Usable bays × Approved storage levels × Positions per level.
For example, 200 rack bays with three approved levels and two pallet positions per level provide 1,200 nominal positions. However, the site audit must remove blocked, damaged, or unsuitable locations from the usable count. Meanwhile, floor stacking and small-parts shelving need their own calculations; they cannot automatically be converted into interchangeable pallet positions.
Also, pallet dimensions and product stability matter as much as rack count. If a SKU has an approved 60 units per pallet and the peak stock projection is 780 units, it requires 13 pallet-equivalent loads. Another SKU with 61 units and a limit of 30 per pallet needs three loads, not 2.03 usable positions. Therefore, round up at the right SKU and load level, accounting for mixed pallets only where storage and handling practices genuinely permit them.
5.2. Use Warehouse Occupancy to Set Space Buffers
For a pallet-rack zone:
Pallet-location occupancy = Occupied usable pallet positions ÷ Total usable pallet positions × 100.
With 1,050 occupied loads and 1,200 usable positions, occupancy is 87.5%. Even so, the warehouse still has 150 open pallet spots. Yet a warehouse manager may choose an 85% occupancy target to preserve space for variable receipts and restocking. At that chosen target, required positions equal ceiling(1,050 ÷ 0.85) = 1,236, producing a 36-position shortfall relative to the chosen operating target.
Importantly, the 85% figure is a scenario assumption, not an industry-wide safety threshold. Appropriate headroom depends on location fit, velocity, aisle access, and demand changes. A warehouse capacity calculation should report both the hard physical limit and the management target, with a clear explanation of the consequences of crossing each.
6. Use Stock Forecasts to Plan Warehouse Capacity
6.1. Forecast Peak Stock by SKU and Warehouse
Seasonal sales volume does not equal the highest inventory held at once. For example, a retailer might sell 50,000 units across November and December but never hold more than 18,000 units at once, depending on restocking. Conversely, a bulk delivery can briefly push actual occupancy above the month-end level used in a finance report.
Use this daily balance:
Closing physical stock = Opening physical stock + Receipts + Physical returns − Shipments − Disposals ± Net transfers and adjustments.
Next, run the forecast for each SKU and warehouse, and convert daily stock into the correct storage units. Also, keep returns awaiting inspection in the physical inventory count, but distinguish them from inventory available to promise to customers.
6.2. Add Supplier Dates, Sales Events, and Reserved Stock
First, base receipts on expected delivery dates, not merely purchase-order issue dates. Next, include supplier lead-time changes, shipment splits, wholesale release dates, sales events, expected cancellations, and dock booking limits. For a business shipping between the US and Canada, customs checks and cross-border transfer timing can create extra overlap between incoming and outgoing inventory, although the size of that effect depends on actual routes and products.
A shared purchasing and inventory view can also reduce the work of matching records by hand when the same stock supports multiple sales channels. For example, XoroONE cloud ERP brings purchasing, inventory, sales orders, and warehouse workflows into a connected operating system. Even so, physical pallet sizes, receiving schedules, and approved rack limits still need to be checked by the warehouse team rather than assumed from an ERP stock total.
For this reason, a useful warehouse capacity calculation projects an end-of-day stock peak and then tests intraday overlaps. If a site is expected to hold 1,050 pallets at close, but 80 pallets arrive before an equivalent outbound movement, temporary demand may reach 1,130 positions.
7. Warehouse Capacity Planning for Shopify and Wholesale
7.1. Plan Warehouse Capacity for Shopify, Amazon, and Wholesale
Ecommerce brands often share inventory across Shopify, Amazon, wholesale EDI orders, and retail locations. However, a network-wide stock number can conceal where inventory is physically available. If an ecommerce sale drives orders to one warehouse while a wholesale shipment is reserved at the same site, both commitments affect available pick faces, staffing, and outbound dock space.
For example, Shopify documents that fulfillment locations are selected using available inventory and configured order-routing rules. As a result, a warehouse capacity calculation must account for the location actually expected to process each order, not just the total quantity in the business. Review Shopify’s location fulfillment guidance when preparing site-level routing assumptions.
7.2. Check Stock Sync and Order Routing Before Peak Season
First, test stock sync and routing with multi-line orders, transfers, wholesale holds, and returns. Then check when stock is deducted, when an order is assigned to a warehouse, and whether an alternate location can realistically meet the shipping promise. However, system connectivity does not remove transport time between locations.
Xorosoft provides ecommerce, EDI, and warehouse integrations that may help keep order and inventory records aligned. Shopify merchants can also review the Xorosoft ERP app listing to see which links and features it lists. Any capacity-planning benefit depends on correct setup, reliable inventory records, and the actual fulfillment workflow used by the business.
8. Warehouse Capacity Calculation Example for Ecommerce
8.1. Run a Pallet Storage Capacity Calculation
Consider a fictional ecommerce company operating a 20,000-square-foot warehouse. Its storage-zone footprint is 8,000 square feet, its usable storage height is 18 feet, and its audited racking offers 1,200 usable pallet positions. The purchasing and sales teams forecast 1,050 pallet-equivalent loads at the highest end-of-day inventory level before the sale. These are example values, not industry averages or a real customer case.
Using those inputs, the warehouse capacity calculation gives a nominal cube of 144,000 cubic feet, end-of-day rack occupancy of 87.5%, and 150 physically vacant pallet positions. If management has selected 85% as its operating target, the business would need 1,236 positions to maintain that headroom at 1,050 loads. It is 36 positions short of its chosen target, even though it has not reached the rack’s hard physical limit.
8.2. Check Extra Receipts and Peak-Day Shipping
Next, suppose an extra 80 pallet loads arrive before equivalent shipments are completed. Then temporary stock could climb to 1,130 positions, or about 94.2% of the site’s usable rack count. As a result, that scenario should trigger a receiving-window or overflow review, not an assumption that 94.2% is inherently unsafe. Still, physical fit and approved access must be evaluated separately.
Now assume the sale creates 1,000 orders per day. Picking supports 1,200, packing supports 950, and carrier handoff can handle 1,100. Therefore, the steady outbound limit is 950 orders per day, leaving a potential 50-order backlog each day. Across five identical days, the unaddressed backlog becomes 250 orders.
| Planning result | Calculation | What it means |
|---|---|---|
| Normal peak occupancy | 1,050 ÷ 1,200 = 87.5% | 150 positions physically vacant |
| Positions at 85% target | Ceiling(1,050 ÷ 0.85) = 1,236 | 36-position operating-target gap |
| Intraday overlap | 1,130 ÷ 1,200 = 94.2% | Receiving timing could create congestion |
| Daily outbound limit | Min(1,200, 950, 1,100) = 950 | Packing constrains completed orders |
| Five-day order gap | (1,000 − 950) × 5 = 250 | A recovery plan is required |
The right response, then, involves two separate decisions: reduce temporary storage congestion and add steady packing output or adjust dispatch commitments. One more row of racks would not solve the 250-order exposure.
Free ERP Readiness Assessment: If your calculations repeatedly depend on manual corrections between purchasing, stock, and warehouse reports, review the underlying processes before selecting a new system.
9. How to Calculate Warehouse Throughput for Peak Orders
9.1. Calculate Daily Picking and Packing Capacity
Picking speed is often measured in lines per hour, while managers forecast customer orders per day. To compare them, convert the two carefully:
Picking capacity in orders/day = Pickers × Productive hours per picker × Lines picked per hour ÷ Average lines per order.
For eight pickers working seven productive hours at 45 lines per hour, the site can pick 2,520 lines. At 2.1 lines per order, that is about 1,200 orders. However, this assumes measured, steady work rate and an order mix consistent with the forecast. Unless rates already include them, allow for breaks, restocking, returns, and errors.
Next, calculate packing on its own. Five packers working 7.6 productive hours each at 25 completed orders per hour can pack 950 orders. If a special sale changes the order mix toward fragile items, gift packaging, or larger cartons, retest the expected rate rather than reusing normal-week output.
9.2. Find the Warehouse Throughput Bottleneck
Compare picking, packing, manifesting, and shipping in orders completed before the promised handoff. If the warehouse has several carrier collection windows, calculate each one. For instance, a parcel that is ready at 7 p.m. cannot satisfy a 5 p.m. carrier cutoff simply because it was processed within the same calendar day.
Use steady outbound capacity = minimum of comparable process capacities, provided the processes share the same schedule and workload assumptions. In addition, a robust warehouse capacity calculation estimates queue growth between stages. When 1,200 orders are picked but only 950 are packed, completed picks accumulate in staging and consume physical space that was not part of the pallet-capacity number. Measure end-to-end shipped orders alongside each team’s work rate to avoid shifting the bottleneck downstream.
10. Include Returns and Receiving in Warehouse Space Planning
10.1. Reserve Space for Arrivals and Putaway
A warehouse might unload a truck quickly but require several hours to inspect, receive, label, and put away its contents. During that period, inventory occupies receiving or staging locations and may not be available for sale. Next, measure putaway completion in pallets per productive hour and compare it with the inbound schedule. If receipts exceed the rate of movement into approved storage, the dock becomes the real capacity constraint.
In some cases, cross-docking can help products move straight to outbound orders, but only where the SKU, orders, timing, and handling controls make it feasible. However, it is not a substitute for verifying stock accuracy. The same warehouse capacity calculation must include temporary staging and restocking space because these zones may be essential to maintain high daily throughput.
10.2. Count Returns and Damaged Items in Storage Demand
Returns often need inspection before they can be restocked. Also, damaged goods and rejected deliveries occupy space without adding sellable stock. Forecast these zones using likely quantities and average processing times. A large apparel returns wave after a sale weekend can compete with newly arriving stock for receiving labor and floor area.
Keep the distinction between physical stock and available-to-promise stock visible to warehouse, customer service, and finance teams. For example, an item may occupy a pallet position while remaining unavailable to customers. A capacity forecast that counts only sellable units can understate the amount of material in the site and create unnecessary congestion.
10.3. Work Out How Many Staging Pallet Spots You Need
A useful estimate is average staging loads = average loads entering staging per hour × average staging dwell hours. If a dock receives 30 pallet loads per hour and they remain in staging for an average of three hours, roughly 90 pallet-equivalent staging positions are occupied under those assumptions. This average estimate can miss arrival peaks; check the busiest rolling delivery window and available forklifts and other tools. As a result, keep staging capacity separate from long-term pallet racks so the same physical location is not counted twice.
11. Stress-Test Your Warehouse Capacity Plan Before Peak Season
11.1. Build Base, High-Sales, and Delay Scenarios
A peak-season warehouse capacity calculation should show a base case, a high-sales case, and a delay case. Then vary demand, supplier arrival dates, putaway speed, packing speed, and carrier availability. Compare the resulting highest storage load and daily order backlog. Use the company’s own experience to select operating headroom; there is no single safe percentage that captures every layout and product profile.
For example, a delayed supplier delivery might lower early occupancy but compress several receipts into one day. Similarly, an unexpectedly successful sale could reduce stock quickly while increasing packing demand. Consequently, the storage and throughput scenarios can move in opposite directions, which is precisely why they need separate measurements.
11.2. Set Alerts for Warehouse Space and Shipping Gaps
First, set clear action thresholds: the number of suitable locations remaining, the longest acceptable dock wait, open orders at the carrier cutoff, and acceptable backlog by age. Next, assign owners for dock delays, overflow, extra shifts, and shipping promises.
Above all, report the capacity gap as units plus a date and consequence. “We need 40 approved pallet positions before the November delivery” is actionable. “Warehouse utilization is high” is not. Finally, review the assumptions when suppliers change delivery dates or ecommerce teams add a campaign, rather than waiting for a weekly management meeting.
12. Warehouse Capacity Needs for Different Products and Channels
12.1. Apparel and Beauty: Plan Bins and Pick Spots
Apparel brands deal with size-color variants, small pick bins, mixed cartons, and returns. For example, a warehouse may have plenty of bulk pallet space but too few easy-to-reach spots for the fastest-moving sizes. Likewise, beauty and personal-care brands may need extra segregation based on handling or shelf-life needs. Therefore, measure reserve storage, forward-pick space, and returns processing separately instead of assuming that a general pallet count answers all three needs.
12.2. Furniture, Sports, and Food: Plan Storage by Size
Furniture often occupies irregular floor footprints and requires longer handling routes. Meanwhile, sporting goods vary from compact accessories to bulky equipment. Food distributors may need defined temperature zones, batch controls, rotation practices, and quarantine space. Each product category changes how location fit and daily movement should be calculated.
These rules also apply to wholesale and manufacturing sites that share ecommerce storage. Industry-specific workflows are outlined in Xorosoft’s industries overview, although the site measurements must always come from the individual site.
12.3. Cross-Border Stock: Plan by Warehouse Site
For ecommerce brands selling across the United States and Canada, inventory in transit should be shown in the capacity plan without being treated as immediately usable in the destination warehouse. In particular, customs timing, transfer bookings, different carrier networks, and local customer promises can influence when stock becomes available. For example, a shipment between sites may temporarily increase transport inventory while reducing sellable availability at both ends. Therefore, review each warehouse on its own, then add a network-wide view showing transfer lead times and the conditions under which one location can realistically support another. The useful question is not how much the network owns, but which stock can reach a customer on the promised date.
13. How to Increase Warehouse Capacity Without More Space
13.1. Get More Warehouse Space With Better Slotting
Before negotiating for more space, verify whether slow movers occupy prime picking locations, blocked positions can be returned to service, or suitable product can be safely consolidated. Good slotting changes should reduce travel and restocking work, not merely increase theoretical density. Review rack limits, aisle needs, and equipment rules before changing the layout.
The purchasing team may also be able to stagger supplier deliveries or reduce unnecessary early arrivals. As a result, that can lower the peak amount of stock on hand without risking stockouts. However, measure the trade-off against freight costs, supplier reliability, and stockout risk. A timed receiving plan sometimes creates more usable headroom than an expensive permanent expansion.
13.2. Compare Overflow Space and Extra Packing Shifts
A third-party logistics provider or temporary overflow site can absorb short-lived storage peaks, often for slower-moving goods. But handling fees, transfer lead times, inventory visibility, and added freight can offset the benefit. Therefore, model the complete cost and the risk that required inventory cannot return to the main warehouse quickly enough.
If packing is the constraint, extra racks are irrelevant. Instead, test workstation layouts, restocking schedules, staggered shifts, and carrier pickups. XoroWMS warehouse management supports receiving, putaway, picking, packing, shipping, and inventory tracking, which can help maintain more reliable operating data. However, software is not a substitute for properly staffed stations, approved storage structures, or a realistic service promise.
14. Warehouse Capacity Software: Spreadsheet, WMS, or ERP?
14.1. Choose a Warehouse Capacity Planning Tool
A spreadsheet can be sufficient for a stable, single-site warehouse with a manageable number of SKUs and regular location counts. However, it may become fragile as multiple teams edit order forecasts, purchase-order receipts, stock reservations, and fulfillment capacity in different files. Therefore, the goal of an upgrade should be reliable day-to-day decisions, not the elimination of every spreadsheet.
By comparison, a WMS provides a more structured record of storage locations and warehouse movements. For larger teams, integrated ERP becomes more relevant when purchasing, ecommerce orders, inventory, warehouse activity, and accounting need matching business records. XoroERP combines these business processes, while site-level capacity checks still depend on warehouse records, SKU characteristics, and checked workflows. In practice, Xorosoft should be evaluated against actual order-to-cash and procure-to-receive scenarios rather than general claims about efficiency.
14.2. Avoid Switching ERP During Peak Season
A warehouse capacity calculation may expose disconnected systems, but a major software rollout is rarely the safest immediate response to an upcoming sale. Instead, a short-term staffing, overflow, or scheduling plan may be a better choice while the business reviews longer-term changes. First, check data migration, system links, training, cutover timing, and recovery plans.
| Planning approach | Where it works well | Limitation to manage |
|---|---|---|
| Spreadsheet | Stable inventory and simple warehouse layouts | Manual record matching and stale location data |
| Standalone WMS | Detailed location control and warehouse execution | Purchasing and financial data may remain disconnected |
| Integrated ERP and WMS | Shared inventory, purchasing, orders, and finance | Configuration, data quality, and change management matter |
If the gap is solely one temporary carrier pickup, a system replacement is unlikely to be the most economical fix. If every department uses different inventory and receipt figures, a connected platform may address a more persistent problem. Therefore, judge the options against measured capacity outcomes rather than broad feature checklists.
Watch Demo: Ask for a walkthrough using representative receipts, ecommerce orders, inventory transfers, wholesale allocations, and financial postings. An effective demonstration should show what happens when a supplier shipment is late or one warehouse cannot fulfill its assigned orders.
15. A 90-Day Warehouse Capacity Planning Checklist
15.1. Check Warehouse Capacity 90, 60, 30, and 7 Days Out
At roughly 90 days before the expected peak, audit locations, physical dimensions, SKU data, and the holiday sales forecast. By 60 days, confirm supplier delivery schedules, storage fit, overflow options, and staffing plans. At 30 days, simulate high-demand orders and receiving overlaps using observed labor rates. During the final week, check open purchase orders, blocked locations, carrier pickup times, and any critical exceptions.
However, this sequence is a planning framework rather than a mandatory calendar. Seasonal manufacturers or importers may need much longer lead times, while businesses with short domestic restocking cycles can update assumptions more frequently. What matters is identifying decisions early enough that the business still has viable options.
15.2. Watch Warehouse Capacity and Shipping KPIs
Assign warehouse management ownership of location counts and daily throughput, purchasing ownership of receipt schedules, and ecommerce or sales ownership of channel demand. Meanwhile, finance should review the cost of overflow, added labor, and delayed orders, while customer service monitors promised dispatch dates.
Track occupied suitable positions, inbound dwell time, unprocessed receipts, restocking delays, pick lines per productive hour, packed orders by cutoff, on-time dispatch, and aging backlog. Then review them together. A rising inventory discrepancy rate can undermine every subsequent warehouse capacity calculation, even when the footprint and formula remain unchanged. Reporting should expose problems in time to make a decision, not merely describe them after the sale ends.
16. Use Warehouse Capacity Results to Plan Peak Season
A useful capacity review finishes with three answers: the highest stock the warehouse can accommodate in suitable approved locations, the most inventory it is likely to hold at one time, and the number of orders it can dispatch at a steady rate by each service deadline. Then document the gaps separately. In the worked example, 36 extra operating-target positions and 50 more completed orders per day require different solutions.
Next, assign each gap a measurable action, owner, decision deadline, and retest date. Before making changes, confirm storage safety, protect shipping cutoffs before accepting new sale plans, and revisit assumptions whenever suppliers or sales plans change. Together, these steps turn a warehouse capacity calculation into a working plan rather than another seasonal spreadsheet.
Book a Personalized Demo: If repeated mismatches between purchasing, inventory, ecommerce orders, and warehouse execution are making capacity planning unreliable, contact Xorosoft for a workflow-based discussion. Bring a real purchase order, warehouse inventory report, and representative customer order so the evaluation stays grounded in the way your business operates.
Frequently Asked Questions
How do you calculate ecommerce warehouse capacity?
Measure usable pallet and bin locations, forecast peak inventory, and compare expected orders with picking, packing, and shipping capacity.
What is the warehouse capacity calculation formula?
Divide occupied usable storage locations by total usable locations and multiply by 100 to calculate occupancy. Check cubic space and throughput separately.
How many pallet positions are needed for peak season?
Divide forecast units for each SKU by its safe units per pallet, round up, and include enough space for peak demand and operational buffers.
What is a good warehouse occupancy rate?
No single rate fits every warehouse. Choose an occupancy target based on SKU mix, replenishment needs, safe access, and seasonal demand changes.
How do you forecast peak-season warehouse space requirements?
Project daily inventory using opening stock, incoming shipments, outgoing orders, returns, and transfers. Plan around maximum simultaneous inventory rather than average stock.
How do you calculate daily warehouse fulfillment capacity?
Calculate sustainable picking, packing, and shipping output in orders per day. The lowest capacity determines your daily fulfillment limit.
Can a WMS improve warehouse capacity planning?
Yes. A WMS helps track storage locations, stock movements, and warehouse tasks. It supports better planning but cannot replace physical capacity checks.
Recent Posts
-
 How to Calculate Ecommerce Warehouse Capacity Before Peak Season
-
 Manufacturing Scrap Statistics 2026: Material Loss, Yield, and Cost
-
 ERP Software for Cosmetics Distributors Managing Lots, Wholesale, and Ecommerce
-
 Xorosoft vs Cin7 Core for Multi-Warehouse Wholesale Operations
-
 How a Multi-Warehouse Company Reduced Inventory Reconciliation Work at Month-End