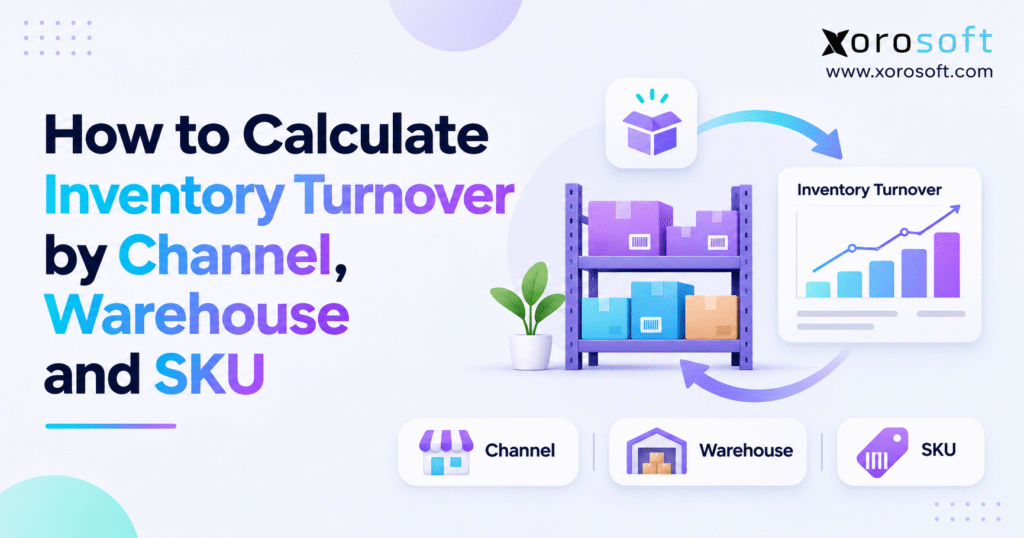
If you want to optimise your stock management, it’s important to understand inventory turnover by SKU.
1. Why One Inventory Turnover Number Hides Stock Problems
A brand can post four inventory turns a year and still lose sales every week. One warehouse may run out of top sellers while another holds the same goods for months. At the same time, a wholesale order may use stock that the Shopify team had planned for online buyers. The company-wide ratio looks sound, yet the day-to-day stock plan does not.
Stock ties up cash before it earns a return. Slow goods take space; low stock can cause lost sales. As a result, one average ratio does not work well for a multi-channel, multi-site firm.
The better approach is to calculate inventory turnover by SKU, then review the same cost and stock data by warehouse and sales channel. Each view answers a new question. SKU turnover shows which items move. Warehouse turnover shows where stock earns its keep. Channel data shows which routes to market drive demand, although shared stock needs special care.
Below, learn the math, a worked example, and the reporting checks needed to avoid false channel ratios.
2. Inventory Turnover by SKU: Formula and Meaning
Calculate inventory turnover using cost of goods sold
The basic formula is simple:
Inventory turnover = Net cost of goods sold (COGS) / Average inventory value
For a basic two-point average, use:
Average inventory = (Opening inventory value + Closing inventory value) / 2
For example, a business reports $600,000 in net COGS during the year. Its stock was worth $140,000 at the start and $160,000 at the end. Average stock value is $150,000, so its annual turnover is $600,000 / $150,000 = 4.0 times. In plain terms, the cost of goods sold during the year was four times the average stock value held.
However, four annual turns do not mean each unit sold four times. Some items sell weekly; others do not move. Therefore, treat the overall figure as a starting point.
Why sales revenue is not the right input
Both sides of the standard turnover formula use cost. Revenue includes selling margin, discounts, and price changes. As a result, revenue divided by inventory at cost would give a different and often much higher figure. It would not be the standard cost-based inventory turnover ratio.
For the same reason, use net COGS from the period that matches your stock average. If you review a quarter, call the result quarterly turns. You may show an annualized estimate as well, but label the estimate and explain the method. Do not compare an unadjusted quarter with a full year.
How inventory turnover by SKU differs from warehouse and channel turnover
A SKU-level ratio tracks one stocked item or variant. A warehouse ratio tracks stock held at a site against the cost of customer sales shipped from it. A channel ratio tries to link demand from Shopify, Amazon, retail, or wholesale to the stock that serves that demand.
These views overlap, but they are not the same. For instance, two channels can share one bin of goods. In that case, each channel has sales, yet neither has its own clear stock balance. A separate channel ratio needs a stated rule for splitting that shared value. Otherwise, show channel sales cost beside one shared-pool ratio.
3. Gather Clean SKU, Warehouse, and COGS Data First
Match cost records to real shipments
Start with a COGS ledger, then link each sale to its SKU, channel, ship date, and actual shipping site. Keep order or shipment IDs to spot duplicates and returns.
Next, collect cost-valued stock snapshots by SKU and site. Accurate inventory turnover by SKU depends on this stock history. A unit count alone is not enough. Two items can each have 100 units on hand while tying up very different amounts of cash. Also, check who owns stock held off-site.
| Field | What it helps you check |
|---|---|
| SKU or variant ID | The exact item that sold or remained in stock |
| Order and ship date | The right sale and report period |
| Sales channel | Where the buyer placed the order |
| Ship-from warehouse | Which site supplied the goods |
| Net COGS at cost | The sales-cost total used on top of the ratio |
| Stock value snapshots | The cost value used under the ratio |
| Returns and stock moves | Events that may change costs or site balances |
Use more than two stock snapshots when levels swing
Opening and closing balances give a quick average. Still, they can miss a large stock build in the middle of a month. A firm may buy heavily for a sale, sell through most goods, and end the period with little stock. In that case, a two-point average can make turnover look faster than it was.
For a better view, use daily values or a set of monthly values taken on the same basis. Then average those values over the chosen period. Be clear about the dates included. Also, use the same method when you compare sites, SKUs, or years so that a shift in the method does not look like a shift in sales.
Separate on-hand stock from stock ready to sell
On hand, available, committed, damaged, and in-transit stock answer different questions. For example, units held for an open order may still be owned by the firm, even though no other buyer can order them. Thus, the stock used for a finance-based ratio should follow the firm’s cost and owner rules, not a mix of screen labels.
Shopify made a key change on October 1, 2026: its inventory reports began using On hand rather than Available units. The older reports kept the prior basis. Therefore, a rise in the count around that date may be due to a report change, not more stock. Check the Shopify inventory report guide before you compare old and new values.
Apply one stock cost rule across the report
FIFO, weighted average cost, landed cost, returns, and write-downs can all change the value of stock. So, choose the right cost rule for the business and stay with it through the report. IAS 2 covers key stock cost rules for firms using IFRS; US firms should use the rules that apply to their own accounts. Above all, make the report tie back to the books.
4. How to Calculate Inventory Turnover by SKU
Start at the lowest useful SKU level
First, choose one stocked item. If a jacket comes in six sizes and three colors, each variant may need its own ratio. One size might sell out while another sits for months. By contrast, a broad product name can hide that gap. Use a stable SKU code rather than a label that staff may change.
Bundles need a clear rule too. If the bundle is a stocked item in its own right, track it as such. If it is put together from loose parts when an order comes in, link the sale to the parts that leave stock. Otherwise, you risk counting the kit and its parts as two sets of goods.
Work through an inventory turnover by SKU example
Say a jacket SKU had $90,000 of net COGS in the past year. The opening stock value was $25,000, while the closing value was $35,000. So, average stock value equals ($25,000 + $35,000) / 2 = $30,000. The SKU turnover ratio is $90,000 / $30,000 = 3.0 times a year.
Now assume that SKU sits in three warehouses. For company-wide inventory turnover by SKU, add its stock value across all three sites on each snapshot date. Then work out the average from those totals. In the same way, add the SKU’s net COGS from all customer sales in scope. Do not use just the stock held by the site that shipped the most orders.
Handle zero stock and slow stock with care
If average stock value is zero, the turnover ratio is not defined. Show N/A, then check missing costs, late receipts, or wrong site codes. Likewise, a negative stock balance calls for a data check. A very high ratio caused by missing stock is not proof of good buying.
A SKU with no sales and a real stock balance has zero turnover for that period. Yet that is not always bad. It may be a new launch, a spare part kept for key clients, or goods bought for a coming season. For that reason, compare turnover with stock age, demand, margin, and lead time before you cut a purchase order.
Use SKU inventory turnover to set clear actions
Split items into groups based on how they sell and why they are held. For example, a fast-selling item with stockouts may need a higher reorder point. A slow item may need a smaller buy. Meanwhile, a spare part may need a policy tied to service. The ratio starts the talk; the stock plan follows from the facts.
5. How to Calculate Inventory Turnover by Warehouse
Link each sale to the site that shipped it
Warehouse inventory turnover uses net COGS from customer sales shipped by the site / average stock value held at that site. A Shopify order may be placed online but leave from the West warehouse. For this report, West gets the sales cost. If one order ships from two sites, split the cost by the lines each site sent.
This rule gives a clearer view of each site’s use of stock. However, it does not tell you whether a site makes more profit. To make that call, you also need freight cost, labor, order mix, service level, and other costs that the turnover ratio does not include.
Keep in-transit and 3PL stock in the right place
A third-party logistics provider may store goods that your firm still owns. If so, those goods should be in the right stock scope, with a trusted cost value. Stock that is on the road between sites also needs one clear treatment. Otherwise, one report may count it twice while another may miss it. Set a rule, keep it stable, and tie the total back to the books.
Do not treat stock transfers as customer sales
Moving $20,000 of stock from East to West changes each site’s balance, but it does not create a sale. Therefore, the move should not add to customer-sale COGS. It should be recorded as a move of stock between sites. Shopify’s inventory transfer guide makes the same broad split between site moves and sales activity.
Compare warehouse ratios with the service they provide
Suppose East reports $200,000 in annual COGS and $80,000 in average stock value. Its turnover is 2.50x. West also reports $200,000 in COGS but holds just $40,000 of average stock. Its turnover is 5.00x.
At first glance, West looks better. Still, East may hold stock for a remote market where a missed order takes days to fix. In that case, lower turns can be part of a sound service plan. Compare fill rate, backorders, urgent stock moves, and delivery promises before you take stock away from East.
6. How to Calculate Inventory Turnover by Sales Channel
Use a direct ratio when each channel has its own stock
If a wholesale team has a stock pool that online buyers cannot use, the channel ratio is simple. Divide wholesale net COGS by the average cost value of that pool. The same rule works for a separate retail or marketplace pool.
For example, wholesale has $120,000 in annual COGS and $40,000 in average stock. Its turnover is 3.0x. A direct-to-consumer pool has $180,000 in COGS and $30,000 in stock, so its turnover is 6.0x. Because the stock pools do not overlap, these are direct channel figures.
Shared stock needs a stated split rule
Many firms use the same bins for Shopify, Amazon, and wholesale. Here, you can see sales by channel, but there is no separate pile of stock for each one. So, a channel-specific stock value has to be assigned through a rule if you want a modeled channel ratio.
One method is to split average stock value in each SKU-warehouse pool based on each channel’s share of that pool’s net COGS:
Channel share of average stock = SKU-warehouse average stock x (channel COGS / total COGS for that SKU-warehouse pool).
Next, add those values across all SKU-warehouse pools for a channel. Then divide the channel’s net COGS by its assigned average stock value. Each pool’s assigned amounts must add back to the pool’s true average value. If a pool has no sales, do not divide by zero; use a clear fallback rule or leave it unassigned.
Explain what a modeled channel ratio can prove
A COGS-share split is a useful report model, not a direct count of stock owned by a channel. In fact, within a single shared pool, that rule tends to give each channel the same turnover by design. Thus, any gap across channels may stem from the blend of SKUs and sites they use, not from a true gap in how well they manage stock.
If that rule does not fit your business, show channel net COGS, units sold, margin, and stockout rate next to the shared-pool turnover figure. This may be more honest than a ratio built from a weak split. For Shopify teams, the Xorosoft ERP app listing is one source of detail on connected order and stock flows, though a specific stock split model still needs review.
Use the right dates for orders, sales, and returns
An order placed today may hold stock but not yet create COGS. A canceled order may free that hold with no sale. Also, a returned unit may not go back into saleable stock until it passes a check. Therefore, use the actual cost and stock events from the books, not only the order status shown on a sales page.
7. Reconcile Inventory Turnover by SKU, Warehouse, and Channel
Build a simple shared-stock case
Assume one finished-goods SKU sells through Shopify and wholesale. Both channels use stock from East and West warehouses. The numbers below are fictional annual values in US dollars. Channel stock values are modeled, based on each channel’s share of COGS at each site.
| Warehouse | Sales channel | Net COGS | Modeled average stock |
|---|---|---|---|
| East | Shopify | $150,000 | $60,000 |
| East | Wholesale | $50,000 | $20,000 |
| West | Shopify | $30,000 | $6,000 |
| West | Wholesale | $170,000 | $34,000 |
| Total | All channels | $400,000 | $120,000 |
First, calculate company-wide inventory turnover by SKU: $400,000 / $120,000 = 3.33x. Next, find East turnover: $200,000 / $80,000 = 2.50x. West turnover is $200,000 / $40,000 = 5.00x. The company figure is not the simple average of the two site ratios. Instead, it uses the total COGS and total average stock value.
Check the modeled channel ratios
Shopify COGS is $180,000, and its assigned stock value is $66,000, so its modeled turnover is 2.73x. Wholesale COGS is $220,000, with $54,000 of assigned stock, or 4.07x. The stock split ties back to East’s $80,000 and West’s $40,000. Also, the two channel values add to the full $120,000.
Wholesale has the higher modeled ratio mainly because more of its sales come from West, the faster-turning site. Yet that alone does not prove wholesale earns more profit or needs less stock. Check margin, lead time, order size, and service goals as well.
Use a clear link between stock and finance data
A connected setup such as Xorosoft’s cloud ERP can bring stock, orders, and cost records into one work flow. However, a business must still choose its own fair rule for shared stock and check the sums. No dashboard can turn an assumed stock split into a direct physical fact.
CTA #1 — Free ERP Readiness Assessment: If it takes days to match SKU, site, and channel totals, review the source records and the rules behind each report. Start with a free ERP readiness discussion focused on your current stock and finance process.
8. Build an Inventory Turnover by SKU Report in Excel
Set up one row for each stock pool
A simple sheet can answer a lot of stock questions if the rows are set up well. Use one row for each SKU, warehouse, and report period. Then add columns for net COGS, opening value, closing value, average value, and turnover. Keep channel sales in a linked sales sheet if the stock pool is shared. Otherwise, you may copy the same stock value into several channel rows and count it more than once.
For a basic sheet, put net COGS in column D, opening value in E, and closing value in F. Then put =AVERAGE(E2:F2) in G2 and =IF(G2>0,D2/G2,NA()) in H2. If you use daily stock values, replace the two-point average with a formula that covers those snapshots.
Use pivot tables to compare inventory turnover by SKU
A pivot table can show SKU turnover by site, item group, or month. However, do not average the ratios in the pivot table to make a company total. Add net COGS from the right rows, add the matching average stock values, and divide the two sums. Also, do not add each month’s average stock value as if it were a new stock pool. Use the right average for the full period instead.
Build checks into the report
Next, flag rows with zero or negative stock values, missing costs, or a site code that does not match the warehouse list. Review returns, new SKUs, and large stock moves by hand. Once the report is stable, ask one person to own each data field and each rule. For example, XoroERP from Xorosoft brings core finance and stock work together, but the team still needs to check that source data is right.
9. Read Inventory Turnover With Stockouts, Margin, and Stock Age
Turn a ratio into days of stock
For annual data, days inventory outstanding (DIO) = 365 / annual turnover. At 4.0 annual turns, that works out to about 91.3 days. If the report covers a 90-day quarter, use 90 / quarterly turns instead. In this way, the time measure and the cost ratio stay on the same basis.
Still, DIO is not a promise that one SKU will last that many days. Demand can surge, lead times can slip, and some stock may already be held for firm orders. Use DIO to compare stock investment, then use a demand plan to set reorder points.
Compare turnover with the right side metrics
Fast inventory turnover by SKU may be good news, but only if buyers can still get what they want. For that reason, review turnover beside stockout rate, fill rate, gross margin, and stock age. Sell-through is useful too, though it measures a share of units sold rather than COGS against average stock value.
| Metric | Main question it answers |
|---|---|
| Inventory turnover | How fast does stock value move through sales? |
| Days inventory outstanding | How many days of average stock does the period imply? |
| Sell-through | What share of a defined unit pool sold? |
| Stockout rate | How often was stock not there when needed? |
| Stock age | How long have goods been held without a sale? |
| Gross margin | How much value remains after the cost of goods sold? |
For example, a SKU may turn ten times but face stockouts each week. Another may turn twice but earn strong margins and meet an agreed service need. Thus, the first item may need more stock, while the second may not need a cut. Xorosoft reporting tools can bring these kinds of stock and finance views into a shared work flow, subject to proper setup.
Do not confuse industry stock ratios with SKU turns
The US Census Bureau reported a September 2026 wholesale inventory-to-sales ratio of 1.21, down from 1.34 in September 2025. That is a broad stock-to-sales measure, not the same as COGS-based SKU turnover. So, use Census wholesale data for market context, not as a direct goal for one warehouse or item.
10. Avoid the Errors That Skew Inventory Turnover Reports
Do not mix units, dates, or stock owners
A report can look neat and still be wrong. For example, one team may use revenue while another uses COGS. If stock states or cost fields differ, the ratios cannot be compared. Fix the inputs first.
Likewise, check the dates. A sale may be placed in one month and shipped in the next. Returns can come back weeks later. Cost updates may post after the ship date. Set one report policy for those events, and use it in every site and channel view.
Keep stock transfers out of the sales total
Moving units between sites should change site balances, but it should not count as a new customer sale. Also, do not add the same shared stock value to both Shopify and wholesale as if each owned it. Otherwise, your channel report will be hard to tie back to company stock. A simple control is to show both the channel splits and the stock pool total side by side.
Do not reward a high ratio without checking service
A high ratio may come from stockouts, while a low ratio may reflect a planned seasonal build. Therefore, check lead time, age, margin, and lost sales before changing buying rules. The goal is better stock use, not the highest ratio at any cost.
11. Inventory Turnover by SKU in Six Stock-Heavy Industries
Apparel and fashion: Spot slow sizes and colors
A style-level report may hide poor demand for one color or size. So, track inventory turnover by SKU at the variant level, then roll results up to styles. Compare stock age and return rate as well. A slow size may need a small buy or a transfer to a store where it sells, rather than a broad price cut on the whole style.
Furniture: Balance space, cash, and delivery time
Furniture takes floor space and can be costly to move. As a result, a slow site may carry a large cash load even with few units. Review turnover by SKU and site, but keep local delivery needs in view. Some fast-selling goods may be worth placing closer to buyers, while rare items may fit a central site.
Sporting goods: Compare the right season
Demand for team gear, outdoor goods, and winter stock can change sharply through the year. Therefore, use like-for-like seasons when you judge turnover. Also, review goods left after the peak. The right choice may be a small early buy next year, not a rule that cuts all seasonal stock now.
Food and drink: Watch age and expiry
In food and drink, a good ratio does not remove the risk of waste. Track lots, expiry dates, holds, and spoilage with stock turns. Also, keep physical first-expiring-first-out picking separate from FIFO cost rules in the books. A SKU that sells fast may still cause loss if old lots stay at the back of the rack.
Wholesale: Separate bulk demand from stock holds
Wholesale teams may set aside goods for large orders that will not ship until later. Meanwhile, an online channel may try to sell the same units. A good report uses shipped sales costs, tracks stock holds, and shows where customer orders are filled. The industries served by Xorosoft include stock-heavy wholesale and consumer goods firms, where these issues are common. For site-level movement, XoroWMS supports the broader warehouse work flow.
Manufacturing: Treat parts and finished goods separately
Raw parts, work in process, and finished goods have different jobs. So, use a clear stock scope for each metric. A finished-goods turnover ratio uses sales COGS and average finished-goods stock. A raw-parts use rate may use the cost of parts sent to jobs instead, but call it a parts use rate, not customer-sale turnover. Keep bills of materials and work orders tied to the same item codes.
12. Know When Inventory Turnover Reporting Needs More Than a Sheet
Keep a spreadsheet when the process is still simple
A controlled sheet may work well for one warehouse, a small SKU list, and a short set of sales channels. In that case, the team can check each input and keep the formula easy to audit. Even so, assign an owner for item costs, stock counts, and returns. Without clear rules, even a small firm’s sheet can be hard to trust.
Move to linked reporting as the work grows
Once stock spans several sites, 3PLs, marketplaces, and wholesale orders, manual joins may take days. Staff may spend more time finding mismatched rows than using the report. Also, month-end close may slow when stock cost values do not match the books. These are signs that the data flow, not just the dashboard, needs work.
| Approach | When it can fit | Main risk to manage |
|---|---|---|
| Spreadsheet | Few SKUs and sites, stable data | Manual joins and copy errors |
| BI report over linked systems | Clean source records but many views | Weak rules can spread bad data |
| ERP with warehouse tools | Many stock and finance flows | Setup, data clean-up, and staff training |
Judge software by real tasks, not only feature lists
Ask vendors to trace one SKU from purchase to sale, return, and month-end cost. Then review how it appears by warehouse and channel. Also, test partial shipments and shared pools. A chart is only useful if the values tie back.
For teams comparing ERP paths, the Xorosoft vs NetSuite page is one vendor view, so weigh it with your own tests and cost checks. Focus on the time saved in trusted reporting, the effort of setup, and the controls staff will need each month.
CTA #2 — Watch Demo: Ask for a demo that follows one real SKU through buying, receiving, picking, shipping, returns, and cost reports. Then compare that flow with your current sheet so you can see which tasks might become easier.
13. Use Inventory Turnover to Shape a Better Buying Plan
Find the few items that need a choice now
Start the inventory turnover by SKU review with items that hold the most value, have old stock, or face frequent stockouts. Then sort them by group and site. Ask whether demand, buy size, lead time, placement, or data caused the issue.
Next, test one action at a time. You might move stock between sites, reduce the next buy, raise a reorder point, or review a supplier’s lead time. Set a date to check the result. Also, track service and margin, since a faster ratio that hurts sales is not a real gain.
Make the report part of a regular review
A monthly review is often a good place to start. Sales, buying, warehouse, and finance staff should use the same item codes and cost rules. If one team sees a different total, stop and find the cause before making a large stock move. In turn, a simple trusted report beats a fancy chart.
14. Turn Inventory Turnover Into a Clear Stock Plan
One company-wide ratio is too broad for a team that sells many SKUs across several sites and channels. Start with clean cost and stock data. Then calculate inventory turnover by SKU, check site-level turnover, and add a channel view only when each channel has its own stock or you can defend a shared-stock split. Above all, make every figure tie back to the same company total.
After that, put the results next to stock age, margin, lead time, and service. High turns are useful only when orders can still be filled. Low turns call for a close look, not an instant cut. For firms that have grown past manual reports, Xorosoft can be assessed as one way to link stock, buying, warehouse, and finance work.
CTA #3 — Book a Personalized Demo: If you need a clearer view of stock by SKU, site, and channel, contact Xorosoft to review your current flow and see which reports and controls matter most.
Frequently Asked Questions
How do you calculate inventory turnover by SKU?
Divide the SKU’s recognized net COGS by its average inventory value at cost for the same period. Combine warehouse balances only for company-wide SKU turnover.
What is the inventory turnover formula?
Inventory turnover = net COGS ÷ average inventory value. For a simple average, add beginning and ending inventory values, then divide by two.
How do you calculate inventory turnover by warehouse?
Divide customer-sale COGS fulfilled from that warehouse by its average cost-valued inventory. Keep internal transfers out of the COGS numerator.
How do you calculate inventory turnover by sales channel?
Use channel COGS divided by dedicated channel inventory. If channels share stock, disclose an allocation method or report channel demand alongside shared-pool turnover.
Do warehouse transfers count as inventory turnover?
No. Transfers move stock between locations without creating customer sales. Update warehouse inventory balances, but exclude transfer values from sales-related COGS.
What is a good inventory turnover ratio?
No universal target exists. Compare similar SKUs and reporting periods, then consider stockouts, margins, seasonality, and supplier lead times before changing replenishment.
When should a business use ERP for inventory turnover reporting?
Consider ERP when multiple channels, warehouses, or 3PLs make cost and inventory reconciliation unreliable. Connected records can support more consistent SKU-level reporting.
Recent Posts
-
 Ecommerce Delivery Statistics 2026: Cost, Speed, and Promise Accuracy
-
 How to Calculate Inventory Turnover by Channel, Warehouse and SKU
-
 ERP for Importers Managing Partial, Rejected, and Canceled Receipts
-
 Shopify B2B vs Wholesale Portal Software for Complex Accounts
-
 What Is Nonconforming Inventory and How Should ERP Control It?