This article will provide key insights into ecommerce delivery statistics 2026 to help you understand upcoming trends and industry forecasts.
1. Why Ecommerce Delivery Costs and Customer Trust Are Under Pressure
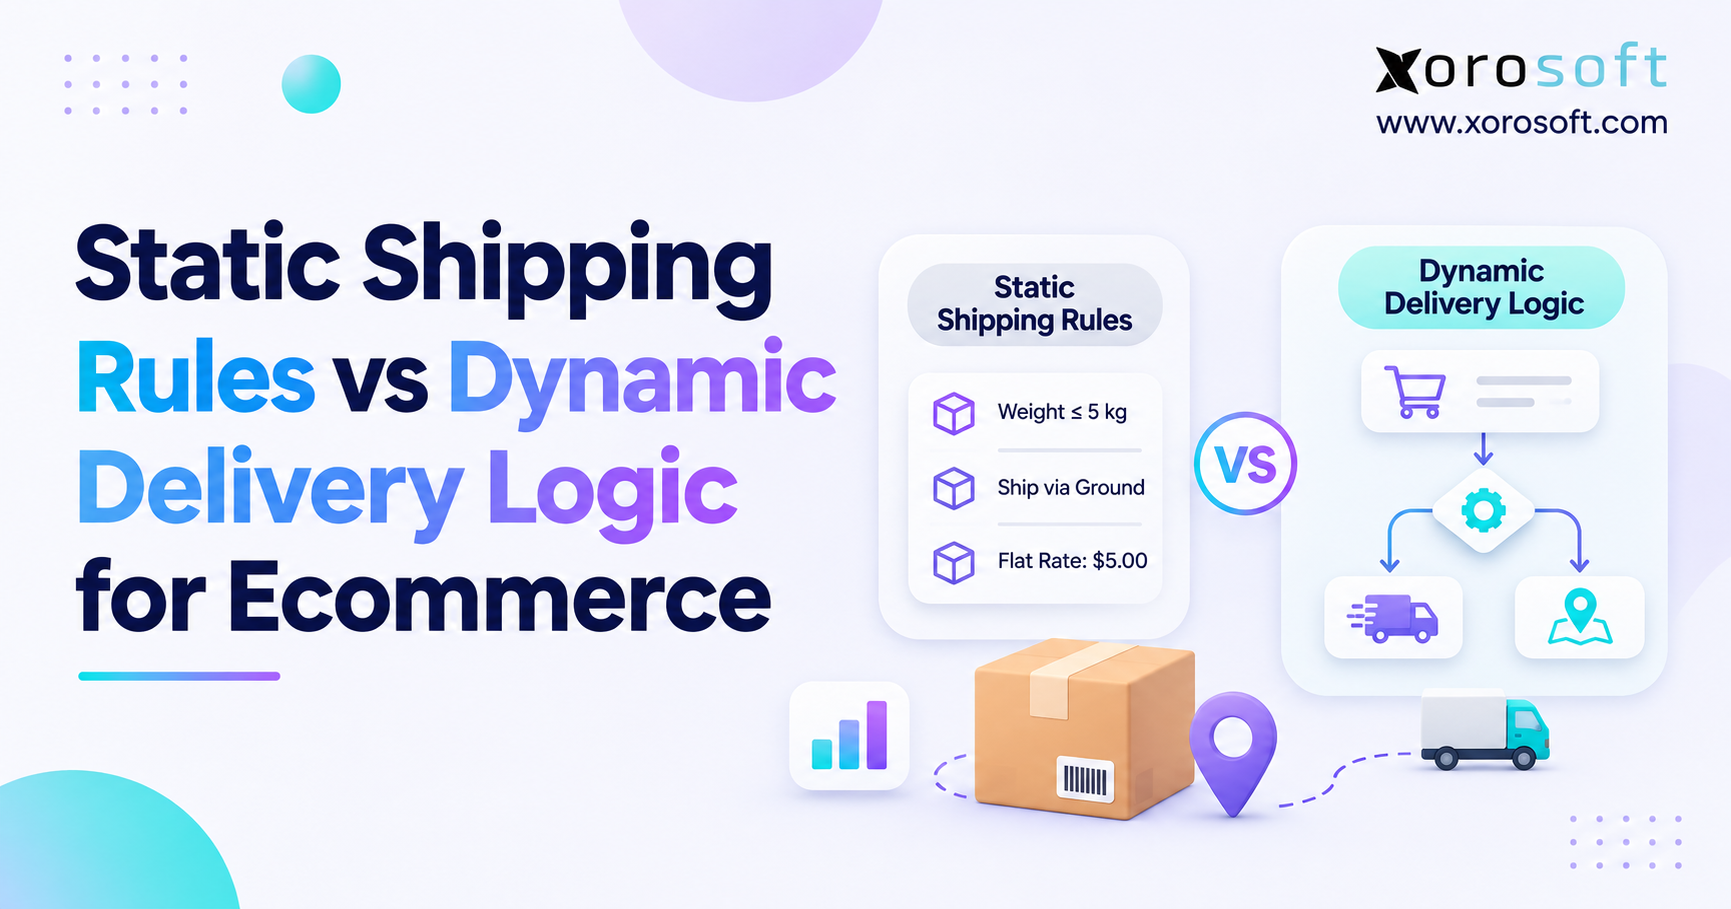
Ecommerce delivery statistics 2026 reveal a problem that cannot be solved by buying faster shipping alone. Customers want low delivery fees, short waiting times, and an arrival date they can trust. Retailers must meet those expectations while paying for warehouse labor, packaging, carrier services, reshipments, and increasingly complex inventory operations. In fact, a brand can increase sales with free delivery yet lose money on those orders.
The pressure is measurable. In its 2026 Home Delivery Survey, AlixPartners reported that 94% of surveyed US consumers said free shipping influenced their purchasing decisions. At the same time, 83% of surveyed retail executives said home-delivery costs had increased year over year. Furthermore, 64% considered home delivery less profitable than comparable in-store transactions.
Together, the findings reveal the gap between winning an order and making it worthwhile. As ecommerce operations grow, shipping policies become intertwined with product margin, inventory placement, customer promises, and service recovery.
1.1 Delivery Cost, Speed, and Promise Accuracy: Three Competing Demands
Delivery cost tells a business how much it spends to fulfill and transport an order. Meanwhile, delivery speed measures elapsed time from order to receipt. By contrast, promise accuracy checks arrival against the original checkout window. Each dimension matters, but none tells the whole story.
A cheaper carrier may introduce another transit day. Likewise, express delivery may protect an order but eliminate its margin. Even so, an order can arrive quickly but still be late against its promised date. The right objective is therefore not maximum speed. It is a commercially sustainable delivery offer that the operation can consistently keep.
1.2 How to Interpret Ecommerce Delivery Benchmarks Correctly
Discussion of delivery benchmarks often mixes consumer surveys, parcel-market measures, and retailer operating data. However, those sources answer different questions. A shopper who says they expect two-day delivery is expressing a preference, not reporting a shipment’s actual performance. Similarly, carrier revenue per parcel is not a merchant’s total fulfillment cost. A carrier ETA matching the actual date does not prove that the original checkout promise was met.
Reliable analysis keeps these definitions separate.
2. Ecommerce Delivery Statistics 2026: Key Cost, Speed, and Accuracy Benchmarks
A useful delivery benchmark begins with the population measured, the exact question asked, and the reporting period. For context, the figures provide a 2026 snapshot, not interchangeable percentages or universal targets.
| Delivery indicator | Reported finding | Important context |
|---|---|---|
| Free shipping influences buying decisions | 94% | AlixPartners, surveyed US consumers, 2026 |
| Retailers facing higher home-delivery costs | 83% | AlixPartners, surveyed retail executives, 2026 |
| Expected free-delivery time | 2.7 days | AlixPartners, average US consumer expectation |
| Cart abandonment linked to delivery offering | 67% | DHL, global shoppers reporting prior behavior, 2026 |
| One- or two-day delivery expected | 39% | Ryder, surveyed US online shoppers, 2026 |
| Exact-date carrier ETA match | 61.8% | WISMOlabs, median retailer with an ETA, June 2026 |
| Carrier ETA match within one day | 83.2% | WISMOlabs, same cohort, June 2026 |
| US parcels handled during 2025 | 23.1 billion | Pitney Bowes, reported in its 2026 index |
2.1 What 2026 Ecommerce Shipping Cost Statistics Reveal
The most immediate signal is that free shipping remains attractive even when delivery costs are getting harder to absorb. That does not make universal free shipping the correct answer. Instead, it makes clear charges, suitable thresholds, and product-level margin analysis more important.
For example, a retailer selling lightweight accessories can face a very different cost structure from one shipping furniture or bulky sporting equipment.
2.2 What Delivery Speed Benchmarks Reveal About Shoppers
The average expected delivery time is not a promise every merchant must advertise. In practice, urgency, stock availability, fees, and location change what buyers accept. Moreover, a two-day carrier service starts its transit clock after handoff; the customer counts from the moment they place the order.
2.3 What Delivery Accuracy Statistics Do—and Do Not—Measure
The ecommerce delivery statistics 2026 research on reliability is particularly easy to misread. An estimated arrival window, a carrier service commitment, and a retailer’s checkout promise are distinct benchmarks. Therefore, measure all three and investigate the gaps between them. Otherwise, carrier performance can appear healthy while customers continue to experience late orders.
3. Ecommerce Shipping Costs 2026: The True Expense per Order
There is no defensible single average shipping expense for every ecommerce business. Instead, costs reflect package size, zone, service, warehouse, returns, and negotiated rates. For that reason, ecommerce delivery statistics 2026 should inform—but never replace—a company’s actual shipping-cost data.
3.1 Ecommerce Fulfillment Costs Beyond Carrier Charges
Carrier transportation is often the most visible expense because it appears directly on shipping invoices. Yet the order may already have consumed labor and materials before the label was printed. Picking, packing, dunnage, cartons, system handling, and exception work can all affect the economics of delivery. Residential, fuel, oversized-package, and peak-season surcharges add further variability.
A practical cost model should allocate costs consistently and avoid double-counting expenses already recognized elsewhere. Separately, classify returns and reshipments to distinguish normal costs from failure-related spending.
3.2 How to Calculate Net Shipping Cost per Order
Use this formula for the period being measured:
Net delivery cost per order = (Attributable carrier, packaging, handling, and delivery expenses − customer shipping revenue) ÷ eligible orders shipped.
Suppose a hypothetical business ships 2,000 orders in one month. It pays $15,000 in carrier fees, $3,000 for packaging, $7,000 in attributable fulfillment labor, and $2,000 in surcharges. Meanwhile, customers pay $7,000 in shipping fees. Gross expenses total $27,000, or $13.50 per order. After subtracting shipping revenue, net delivery cost falls to $10 per order.
Importantly, neither figure is a 2026 industry average. It is an example of why a retailer’s carrier invoice and its economic cost are not the same measurement. The denominator should also distinguish completed orders from labels generated for orders that never left the warehouse.
3.3 Why Parcel Shipping Statistics Differ From Merchant Costs
The Pitney Bowes Parcel Shipping Index reports that the US market handled 23.1 billion parcels during 2025, an increase of 3.3%. This is 2025 performance reported in a 2026 publication, not parcel volume measured in 2026.
When reading parcel-market benchmarks, distinguish carrier economics from merchant costs. Consequently, analyze spending by zone, service, warehouse, package, and order value.
4. Free Shipping Statistics 2026: Cart Abandonment and Profitability
Free shipping changes the customer’s perception of price. However, it shifts transportation expenses to the retailer. Thus, the question is whether conversion or basket growth offsets that subsidy. Ecommerce delivery statistics 2026 offer context, but order-level margin decides profitability.
4.1 Shipping Fees, Cart Abandonment, and Conversion
Baymard’s cart abandonment research reports that, after excluding people who were simply browsing, 40% cited excessively high extra costs such as shipping, taxes, and fees, while 20% cited slow delivery. These are reasons reported by surveyed shoppers, not measured conversion uplifts that every merchant can expect after changing a shipping rule.
Consequently, a surprise fee can undo the value a shopper expected. Conversely, promising free express shipping without knowing the margin impact can create a different problem behind the scenes.
4.2 Free-Shipping Thresholds and Contribution Margin
Imagine an $80 order with $32 in gross profit before fulfillment. If payment fees, handling, and delivery consume $17, the remaining contribution is $15. However, a $100 basket helps only if added margin exceeds packing, carrier, promotion, and return costs.
This is where joined financial and operational records matter. Inventory-driven retailers can use connected order, stock, and accounting data to test whether specific delivery offers make commercial sense. Even then, calculations depend on accurate expenses and documented allocation rules.
4.3 Free Versus Fast Shipping: Offer Meaningful Choices
The ecommerce delivery statistics 2026 evidence supports testing more than one delivery proposition. Free economy shipping, a paid faster option, a minimum-spend threshold, and pickup or collection can appeal to different customers. Still, not every order needs an express upgrade. For some buyers, a reliable Friday delivery matters more than a possible Wednesday arrival with a higher fee.
Operators should compare contribution margin, conversion, repeat purchases, and failed-delivery costs for each offer.
CTA 1 — Free ERP Readiness Assessment: If shipping expenses, stock availability, and order profitability live in separate spreadsheets, assess the data gaps first. Map where the same order must be re-entered or reconciled before investing in a new fulfillment policy.
5. Ecommerce Delivery Speed Statistics 2026: How Long Will Shoppers Wait?
Speed expectations have tightened, but the practical requirement differs by product category and purchase context. For instance, grocery shoppers may expect immediate access. By contrast, furniture buyers may accept scheduled delivery days later. Retailers that ignore these differences risk overspending on shipping services customers would not have chosen.
5.1 Two-Day Delivery Expectations Are Not Universal
In its 2026 Ecommerce Consumer Study, Ryder reported that 39% of 1,160 surveyed US online shoppers expected delivery within one or two days. It also found that 71% had abandoned cart items because of unexpected shipping fees, while 73% had added merchandise to meet a free-shipping threshold.
Taken together, these findings show why price and speed are linked. A meaningful share of shoppers wants quick delivery, yet fees still influence decisions. Therefore, retailers should offer realistic choices backed by warehouse and carrier capacity.
5.2 Global Ecommerce Delivery Preferences in 2026
The DHL 2026 E-Commerce Trends Report surveyed 29,000 online shoppers and 5,800 ecommerce businesses across 29 countries. Sixty-seven percent of surveyed shoppers reported abandoning an online purchase because of the delivery offering. In a related purchase-completion question, 41% selected free shipping as an incentive and 20% selected fast delivery.
These are global responses, not US conversion tests. For instance, some want the lowest price; others pay for urgency or convenience.
5.3 Design Realistic Delivery Windows Around Customer Needs
Use ecommerce delivery statistics 2026 to frame three or four clearly differentiated offers: an affordable standard option, a faster paid option, and specialist services where product urgency or size justifies them. Next, explain cutoffs and destination restrictions in plain language. Then measure how each option performs for the actual orders that select it.
A premium delivery promise should account for payment capture, inventory allocation, warehouse capacity, weekends, and carrier collection. The service must be achievable from checkout to doorstep, not merely from the moment a parcel enters a carrier’s network.
6. Order Fulfillment Speed: Four Clocks Behind Delivery Times
Many fulfillment reports start the stopwatch when a shipping label is created. Customers start it when they pay. Ecommerce delivery statistics 2026 are most useful alongside real order-processing timestamps. Consequently, the gap can grow during promotions, stockouts, and peak-season congestion. The operational timeline should therefore include order validation, inventory allocation, warehouse work, and carrier transit.
6.1 Stock Availability and Accurate Delivery Commitments
A successful checkout is not proof that inventory can ship. Stock may exist physically but be reserved for another channel, undergoing inspection, or located in a warehouse with no suitable carrier collection. When systems fail to distinguish on-hand, allocated, available, and damaged quantities, the retailer risks promising something it cannot dispatch.
For businesses operating multiple sales channels, Xorosoft’s XoroONE brings inventory, orders, warehouse operations, and accounting into a connected ERP environment. That connection can improve visibility into fulfillment inputs. It does not, by itself, guarantee that a carrier will meet a transit estimate.
6.2 Picking, Packing, and On-Time Dispatch
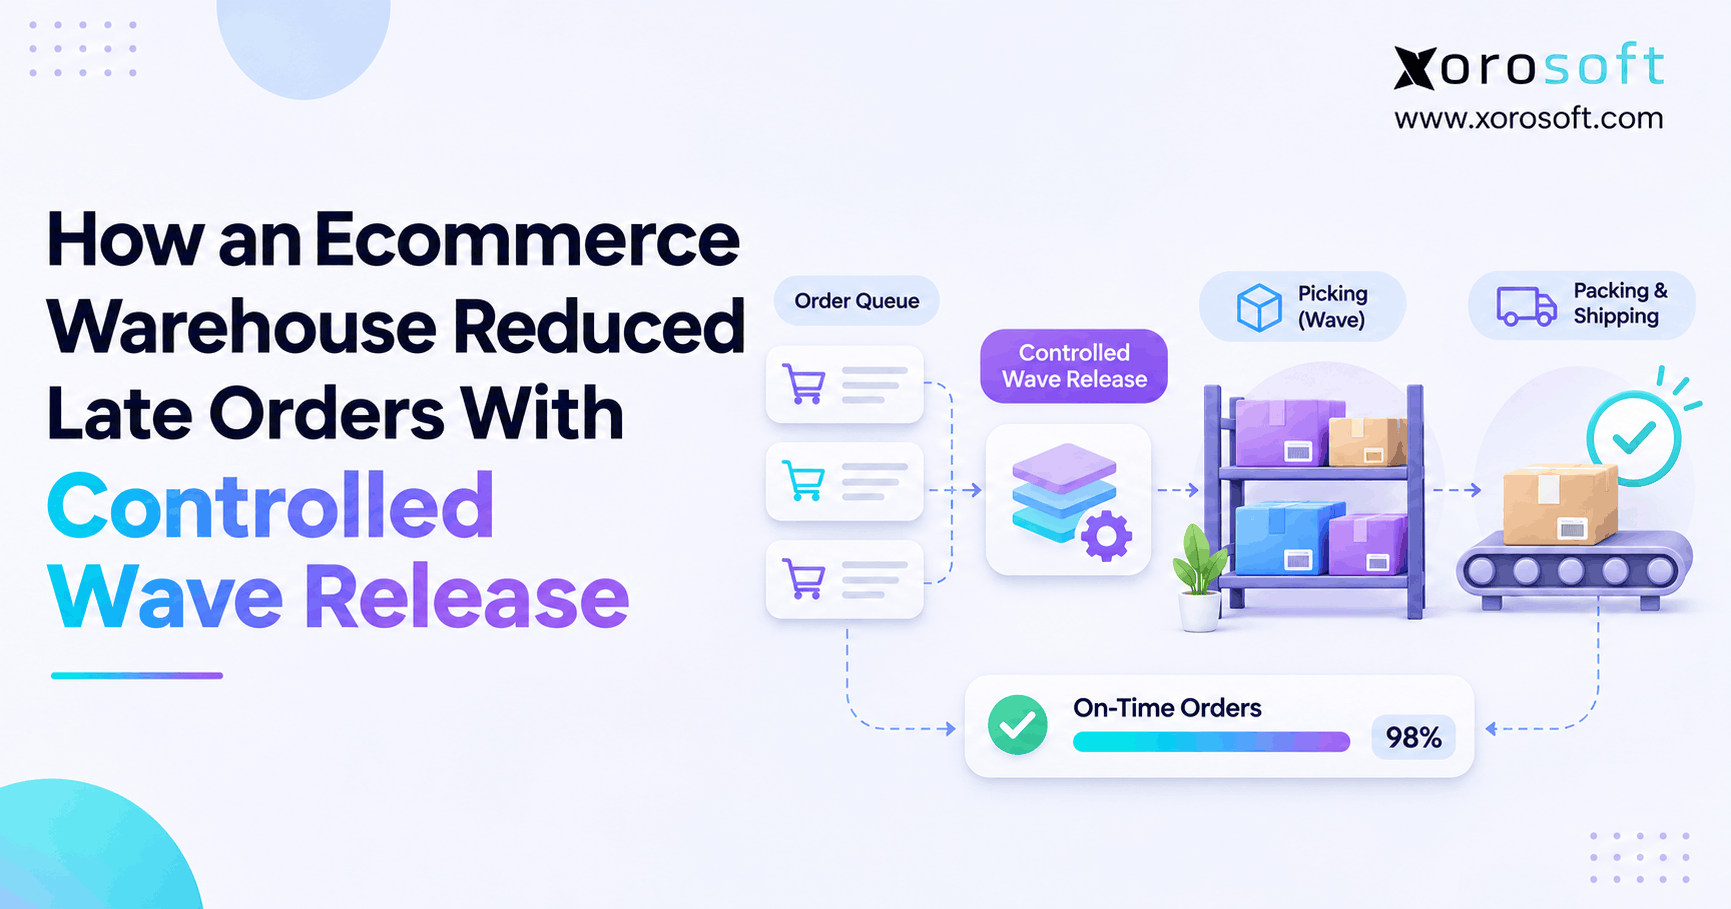
Once stock is allocated, the warehouse must locate the items, pick the right quantities, verify the order, select packaging, and prepare the shipment. For example, misplaced stock can turn a quick pick into hours of investigation. Similarly, an order ready at 4:05 p.m. may miss a 4:00 p.m. carrier pickup and wait overnight.
The easiest way to identify these delays is to record meaningful event timestamps: order released, pick started, pick completed, pack completed, handoff confirmed. Importantly, label generation does not prove carrier acceptance.
6.3 Carrier Transit Versus Total Delivery Lead Time
A two-business-day carrier service typically describes a transportation service window, subject to its terms and pickup schedule. However, it is not a universal two-day doorstep guarantee. For example, an order placed late Friday might not reach the carrier until Monday; two business days of transit can then produce a Wednesday arrival.
For this reason, ecommerce delivery statistics 2026 should be paired with internal processing-time distributions. Average handling time is useful, but the slower 10% of orders often explains why a brand repeatedly misses ambitious checkout promises.
7. Delivery Promise Accuracy Statistics: The Metric Behind Trust
Delivery promise accuracy answers a specific question: did the complete order arrive within the window originally communicated to the customer? It should not be confused with the accuracy of a carrier’s estimated arrival date or the carrier’s compliance with its own service terms. Each measure can be useful, but each has a different reference point.
7.1 Calculate Delivery Promise Accuracy Using the Original Date
The most defensible definition is:
Delivery promise accuracy (%) = Orders delivered within their original promised window ÷ eligible orders with a recorded original promise × 100.
If 920 of 1,000 eligible orders are delivered on time against the original checkout commitment, the rate is 92%. For clarity, that figure is hypothetical. Even so, an updated ETA should not erase the original checkout commitment from reporting.
Retailers also need a consistent rule for canceled orders, customer-requested schedule changes, pickup orders, and deliveries without a final scan. Otherwise, two warehouses might report different accuracy rates simply because their denominators differ.
7.2 Estimated Delivery Date Accuracy Versus Delivery Windows
The WISMOlabs June 2026 carrier ETA study analyzed roughly 2.6 million valid delivery records across 140 retailer entities. Among retailers with available carrier ETAs, the median exact-date matching rate was 61.8%. Meanwhile, the median rose to 83.2% with a one-day tolerance on either side.
That 21.4-percentage-point gap demonstrates the importance of measurement precision. Nevertheless, it does not prove 83.2% of orders met their checkout promises. The retailer cohort is not representative of every merchant, and the analysis is conditional on carrier ETA availability.
7.3 Measure Split-Shipment Accuracy by Order and Parcel
A shopper who buys three items expects an order, not three independent statistical records. If one item arrives Tuesday and two arrive Friday, the order-level result depends on what was promised for the complete basket. Meanwhile, parcel-level reporting isolates carrier failures. Order-level reporting captures the customer’s actual experience.
A disciplined ecommerce delivery statistics 2026 program retains both views. It also records the time and reason an original estimate changed, instead of presenting the latest forecast as if it were the initial commitment.
8. Why Ecommerce Delivery Promises Fail Before Carrier Handoff
Ecommerce delivery statistics 2026 can obscure delays that begin before carrier pickup. Oversold inventory, unprocessed receipts, incorrect allocations, staffing gaps, and packing exceptions all make a retailer’s promise harder to keep.
8.1 Inventory Discrepancies Increase Late-Delivery Risk
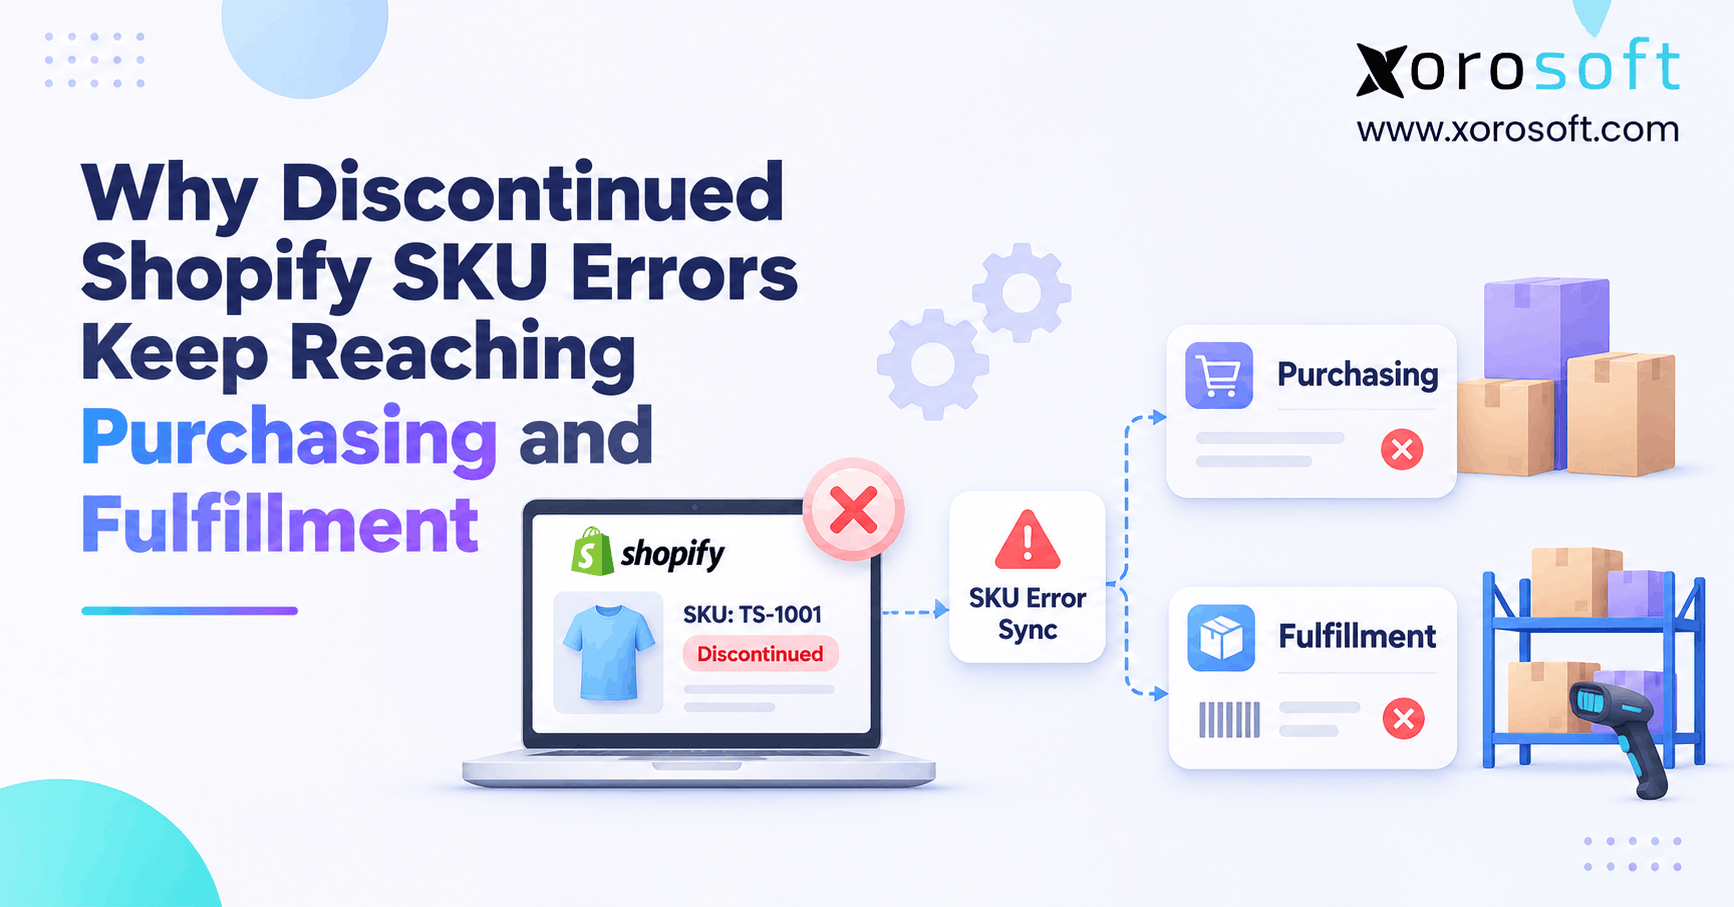
A product can show a positive stock balance and still be unavailable to pick. It may be damaged, held for quality review, reserved for another order, or physically missing. If ecommerce channels receive the wrong available quantity, checkout promises may be generated against stock that cannot ship.
Consequently, cycle counts, accurate receiving, and clear statuses help prevent such failures. When the same product is sold through stores, wholesale accounts, and ecommerce sites, allocations must also respect commitments made in each channel.
8.2 Warehouse Exceptions and Missed Delivery Promises
Barcode verification, put-away discipline, and visible work queues can prevent small warehouse issues from becoming late shipments. Xorosoft’s XoroWMS supports inventory tracking, multi-warehouse control, picking, packing, and barcode-related workflows. In turn, those controls support warehouse work; carrier transit remains separate.
Record why an order missed its planned dispatch: missing stock, late replenishment, wrong bin, packing capacity, damaged goods, address correction, or carrier cutoff. A generic ‘late order’ code is too vague for root-cause analysis.
8.3 Proactive Tracking Updates When Deliveries Run Late
A Locus delivery-experience survey reported that 93% of surveyed US shoppers said proactive updates helped offset the negative experience of late delivery. The underlying consumer survey was conducted in November 2025 and reported in 2026; it measures perceptions, not a reduction in actual delivery delays.
Notify customers when a delay becomes credible, explain what changed, and provide a supported revised estimate. However, do not call a parcel ‘on the way’ merely because a label exists.
CTA 2 — Watch Demo: For teams struggling with late picks, inconsistent inventory statuses, and manual fulfillment updates, request a workflow demonstration that follows an order from allocation through packing and carrier handoff. Evaluate the steps that can actually be controlled.
9. Ecommerce Delivery Statistics 2026: KPIs for Cost and Reliability
An operations scorecard must distinguish financial efficiency from service quality. For example, low carrier charges can hide split-shipment or labor costs. A high carrier on-time percentage can coexist with missed customer promises when orders leave the warehouse late.
9.1 Define Six Core Ecommerce Delivery Performance KPIs
| KPI | Calculation or measurement | What it diagnoses |
|---|---|---|
| Net delivery cost per order | Net attributable expenses / eligible shipped orders | Delivery economics |
| Order-to-ship cycle time | Confirmed carrier handoff minus order placement | Internal processing speed |
| On-time dispatch | Orders handed off by planned cutoff / eligible orders | Warehouse readiness |
| First-scan lag | First carrier scan minus confirmed handoff | Handoff visibility |
| Original promise accuracy | Orders meeting original commitment / eligible promised orders | Customer experience |
| Split shipment rate | Orders requiring multiple shipments / eligible shipped orders | Allocation and stock placement |
| Delivery exception rate | Orders with defined delivery exceptions / eligible orders | Failure frequency |
Therefore, each KPI needs an owner and written exclusion rules. For example, a canceled order should not silently vanish from all reporting without a documented rule. Similarly, shipping labels and carrier possession scans should remain separate events.
9.2 Compare Delivery Accuracy by Warehouse, Carrier, and Channel
A furniture freight order should not be benchmarked against a small apparel parcel using the same cost target. Segment reports by warehouse, channel, zone, service, product category, and order size. Compare medians and high-percentile delays alongside averages; a few severe exceptions can be commercially significant even when an overall average looks acceptable.
For Shopify merchants, wholesale distributors, and marketplace sellers, channel-level views help identify where promised dates are too aggressive or fulfillment rules are misaligned with inventory realities.
9.3 Connect Shipping Cost Benchmarks With Accounting Results
Suppose Warehouse A has a net delivery cost of $9.20 and a 94% promise accuracy rate. Warehouse B costs $10.10 per order but reaches 97% accuracy. These are illustrative figures, not industry benchmarks. Management should examine margins, service recovery costs, and customer impact before declaring either site the winner.
Xorosoft’s XoroERP combines accounting, inventory, ecommerce activity, and operational reporting. When appropriate carrier expenses and cost allocations are captured, those records provide a useful foundation for examining delivery economics alongside order activity. The underlying data and measurement rules still determine whether the reported KPI is trustworthy.
10. Multi-Warehouse Delivery Performance: When Closer Is Not Cheaper
A regional warehouse network can shorten transit distances, but it can also introduce transfers, split shipments, and uneven labor costs. Nevertheless, the closest fulfillment site is not always best. It is the site that can complete the order within the promised window at an acceptable total cost.
10.1 Choose Fulfillment Locations for Cost and Delivery Speed
Allocation decisions should consider available inventory, warehouse processing capacity, carrier pickup times, destination zone, and package characteristics. A nearby warehouse that is missing one required SKU may be slower than a slightly more distant site holding the complete order. Similarly, a warehouse that misses today’s carrier cutoff may not offer a meaningful speed advantage.
For businesses with growing fulfillment networks, Xorosoft integrations provide connections across commerce and operational tools. However, integrations still need a clear source of truth for inventory and fulfillment status.
10.2 Measure Split-Shipment Cost and Promise Accuracy
Imagine a customer buys a jacket and shoes. Shipping both from one warehouse costs $9 and meets the promised window. By contrast, separate shipments cost $6 and $7, require more packing, and risk different arrivals. The split decision costs $13 before incremental handling, even if one parcel reaches the buyer earlier.
That example shows why optimizing each parcel in isolation can worsen the total order result. Ecommerce delivery statistics 2026 are more actionable when order-level costs and customer completion dates remain visible alongside parcel-level carrier records.
11. Shipping Cost vs Delivery Speed: Profitable Service Design
The best shipping menu gives customers choices while protecting operational capacity. However, describing every service as merely ‘fast’ or ‘slow’ hides important differences. A meaningful offer combines price, estimated arrival, service coverage, and the retailer’s ability to dispatch on time.
11.1 Compare Ecommerce Shipping Options on Cost and Speed
| Service model | Customer proposition | Operating consideration |
|---|---|---|
| Economy | Lower price, wider arrival window | Best for nonurgent orders |
| Standard | Balanced cost and predictable timing | Requires dependable daily dispatch |
| Express | Faster delivery at a premium | Requires early processing and carrier eligibility |
| Local same-day | Urgent fulfillment in covered areas | Depends on local stock, cutoff, and delivery density |
An express order should not be routed through a warehouse that cannot pack it before collection. A ‘free’ economy option should not silently absorb so much margin that the order becomes unattractive. Ultimately, service design needs processing and cost data, not just advertised transit times.
11.2 Test Free-Shipping Thresholds Using Actual Margins
Compare shipping policies by contribution per order, order value, conversion, return incidence, and customer contacts. A higher free-shipping threshold may increase basket size yet also encourage low-margin add-on items. In another category, a small paid delivery charge may preserve margin without materially reducing demand.
Use ecommerce delivery statistics 2026 as context, then test decisions with customers. In particular, compare similar orders around a controlled change; surveys cannot predict exact revenue gains.
12. Ecommerce Delivery Benchmarks by Industry and Product Type
Ecommerce delivery statistics 2026 lose meaning when product characteristics disappear from the analysis. Apparel, furniture, food, and wholesale shipments involve different constraints, even when each business sells online. Accurate promises begin with understanding what physically must happen to complete the order.
12.1 Apparel and Sporting Goods: SKU-Level Delivery Challenges
Apparel orders often involve multiple sizes and colors, raising the consequences of inaccurate variant-level inventory. Meanwhile, beauty sellers may handle bundles and promotional order spikes. Sporting goods retailers can mix easily shipped accessories with bulky products. For these businesses, accurate stock allocation, picking verification, and reasonable dispatch cutoffs are important levers.
12.2 Furniture Shipping Costs and Oversized Delivery Windows
Furniture orders may require special packaging, freight handling, delivery appointments, or customer access arrangements. Comparing their shipping cost per order with a small-parcel benchmark creates a distorted picture. Even so, a longer window can work when appointment expectations are clear and met.
12.3 Food and Wholesale Delivery Commitments
Food shipments can face freshness, temperature, and handling constraints. Wholesale orders may require receiving appointments, EDI documentation, partial allocations, or customer-specific service commitments. In both cases, the relevant benchmark is whether the agreed requirement was fulfilled, not simply whether a parcel arrived quickly.
Xorosoft’s industry coverage spans several inventory-driven sectors, making these differences relevant when evaluating connected order, inventory, and warehouse workflows. The ecommerce delivery statistics 2026 lesson is to segment performance by product and business model before deciding where to invest.
13. Shopify Delivery Promise Accuracy and System-of-Record Ownership
For an ecommerce merchant, the storefront may display the customer-facing promise while inventory availability lives in an ERP, warehouse progress in a WMS, and delivery events in a carrier platform. Without clear ownership, each system can show a different version of the same order.
13.1 Establish Ownership of Shopify Delivery Data
The storefront should retain the date or window presented at checkout. Meanwhile, inventory operations should own available and allocated quantities. Likewise, warehouse teams should own pick, pack, and confirmed handoff events. Finally, carriers should supply tracking events and transit estimates. A reporting layer then joins these records without rewriting their history.
Importantly, this does not mean replacing every tool. It requires defined identifiers, update rules, and exception handling. For Shopify users considering a more connected approach, the Xorosoft ERP listing on the Shopify App Store describes order, product, inventory, fulfillment, and financial synchronization capabilities. Those integrations support data flow; they do not independently guarantee a delivery date.
13.2 Prevent Promise Drift Across Fulfillment Systems
If a carrier moves its ETA from Thursday to Friday, the customer-facing update can change, but the original checkout commitment should remain stored. Likewise, split orders must retain each tracking number under the original order. In addition, refunds must reconcile without hiding shipment performance.
These are essential controls behind ecommerce delivery statistics 2026 reporting. When systems disagree about whether an order has shipped, managers should investigate the underlying event and synchronization rules before trusting a dashboard or purchasing new software.
14. Ecommerce Delivery Statistics 2026: A 30-Day Improvement Plan
The practical value of ecommerce delivery statistics 2026 lies in identifying which changes improve customer outcomes without making every shipment more expensive.
14.1 Days 1–10: Benchmark Delivery Cost and Accuracy
Collect order timestamps, original checkout promises, inventory allocations, warehouse completion events, carrier scans, and shipping-related costs. Calculate net delivery cost per order, order-to-ship time, on-time dispatch, original promise accuracy, and split-shipment rate. Break the results down by warehouse, channel, service, and product group. Record missing data separately; do not replace it with optimistic assumptions.
14.2 Days 11–20: Fix Fulfillment Delays and Allocation Errors
Identify the top causes of missed dispatch and broken delivery commitments. They may include inaccurate inventory, late picking, short packing capacity, inappropriate warehouse allocation, or unrealistic carrier cutoff rules. Next, select a few changes, assign owners, and preserve the baseline. If system integrations need repair, validate the data flow before introducing additional automation.
14.3 Days 21–30: Test Shipping Speed, Fees, and Alerts
Pilot a more accurate checkout window, revised free-shipping threshold, improved cutoff messaging, or exception notification. Then measure margin, support contacts, promise accuracy, and fulfillment speed. Keep different order types separate so an improvement in one segment does not conceal deterioration in another.
14.4 When Connected Systems Improve Delivery Visibility
Spreadsheets and specialized tools can work for simple fulfillment models. They become harder to manage when multiple warehouses, Shopify orders, wholesale commitments, purchasing, and accounting depend on different versions of inventory and order status. In that situation, a connected ERP may help when visibility gaps and reconciliation costs persist.
The practical recommendation is to promise only what the operation can support, track that promise against actual delivery, and measure the margin impact of meeting it. Faster shipping is valuable when customers need it and the economics work. Above all, reliable delivery matters on every order.
CTA 3 — Book a Personalized Demo: If growing order volume and disconnected systems make it difficult to see stock availability, fulfillment progress, or delivery-related costs in one place, contact Xorosoft to discuss your workflow and whether a connected ERP approach fits the business.
Frequently Asked Questions About Ecommerce Delivery
What do ecommerce delivery statistics 2026 reveal?
They show growing pressure to balance shipping costs, delivery speed, and reliability. Operators should compare customer expectations with actual fulfillment performance and order profitability, not speed alone.
What is the average ecommerce shipping cost per order?
No single average applies to every business. Costs vary by weight, distance, service, packaging, labor, and surcharges. Calculate cost per shipped order using your own records.
How fast do shoppers expect ecommerce delivery in 2026?
AlixPartners reported a 2.7-day average expectation for free delivery among surveyed US consumers in 2026. Expectations also vary by product category, destination, urgency, and price.
What is delivery promise accuracy?
It is the percentage of eligible orders delivered within the original checkout window. Divide orders meeting their original promise by eligible promised orders, then multiply by 100.
How do shipping fees affect cart abandonment?
Unexpected fees can discourage checkout completion. Display shipping charges early and test free-shipping thresholds against contribution margin rather than assuming every free-delivery offer will increase profit.
What causes ecommerce delivery promises to fail?
Common causes include inaccurate inventory, late picking, missed carrier cutoffs, split shipments, and transit disruptions. Measure warehouse processing separately from carrier performance to locate delays.
Which ecommerce delivery KPIs matter most?
Track net delivery cost per order, order-to-ship time, on-time dispatch, promise accuracy, and split shipment rate. Compare results by warehouse, sales channel, and shipping service.
Recent Posts
-
 Ecommerce Delivery Statistics 2026: Cost, Speed, and Promise Accuracy
-
 How to Calculate Inventory Turnover by Channel, Warehouse and SKU
-
 ERP for Importers Managing Partial, Rejected, and Canceled Receipts
-
 Shopify B2B vs Wholesale Portal Software for Complex Accounts
-
 What Is Nonconforming Inventory and How Should ERP Control It?