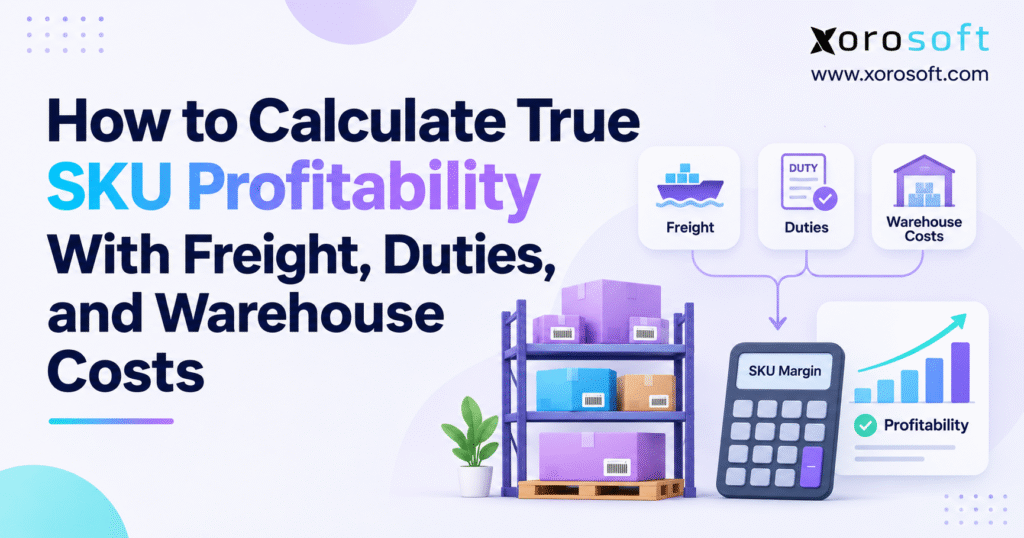
Understanding true SKU profitability is essential for making informed business decisions.
1. Why Strong Sales Can Hide Weak True SKU Profitability
A bestselling product is not necessarily a profitable one. Many growing brands compare selling price with supplier cost, celebrate the resulting gross margin, and move on. Yet the product still has to travel through ports, customs, warehouses, fulfillment stations, and delivery networks. Those steps have costs, and they are rarely distributed equally across every SKU.
Consider a compact apparel item and an oversized home product purchased for the same unit price. Although both products may appear equally attractive on a simple merchandise report, the larger item can consume more container space, warehouse capacity, picking time, and outbound freight. Consequently, supplier-price margins alone may send purchasing teams in the wrong direction.
The Business Decisions Behind SKU Profitability Analysis
Accurate SKU profitability influences replenishment, promotions, product assortment, supplier negotiation, and inventory placement. A purchasing manager may reorder a fast-selling item without realizing that higher freight rates erased much of its contribution. Meanwhile, finance may see reasonable consolidated gross profit but struggle to identify which products are absorbing warehouse costs.
Therefore, a useful product-margin report must connect sales and cost records without pretending that every order has the same economics.
What a True SKU Profitability Calculation Must Show
A practical calculation separates three layers: gross profit after inventory COGS, contribution profit after attributable variable costs, and a fully loaded management view after selected fixed-cost allocations. Each layer answers a different question. For example, contribution profit is often more useful for deciding whether an additional sale is worthwhile, while the fully loaded measure can help examine long-term warehouse capacity.
Throughout this guide, the aim is to make the numbers explainable. Freight and duties should be traced or allocated sensibly, warehouse costs should follow defensible drivers, and every shared cost pool should reconcile to source records. Otherwise, even a sophisticated dashboard can produce confident but misleading decisions.
2. True SKU Profitability Formula: Gross, Contribution, and Fully Loaded Margins
True SKU profitability is the economic result attributable to one stock keeping unit under a clearly defined set of costs. However, no single margin percentage serves every management and accounting purpose.
Gross Profit and SKU Margin After Inventory COGS
Gross profit equals net sales revenue minus inventory cost of goods sold. Net revenue should reflect the business’s consistent treatment of discounts, credits, refunds, and allowances. In addition, COGS should reflect the appropriate acquisition or production cost of the units actually sold, not simply the supplier’s latest advertised price.
Gross profit = Net SKU revenue – Inventory COGS.
Gross margin percentage = Gross profit / Net SKU revenue × 100.
For instance, an item with $50 of net revenue and $28 of recorded COGS generates $22 in gross profit, equivalent to a 44% gross margin. That result is important, but it says little about payment fees, picking costs, customer delivery, or returns. Therefore, gross margin is the starting point rather than the complete answer.
SKU Contribution Margin After Variable Selling Costs
Contribution profit goes further by deducting expenses that change with selling or fulfilling the item. These may include order picking, packaging, outbound shipping, transaction fees, marketplace commissions, and additional return-processing costs.
SKU contribution profit = Net SKU revenue – Inventory COGS – Attributable variable selling and fulfillment costs.
Contribution margin percentage = SKU contribution profit / Net SKU revenue × 100.
As a result, contribution margin is especially helpful for comparing promotions, sales channels, and order economics. An item with a high gross margin may still generate little contribution when the business subsidizes expensive delivery or encounters frequent returns.
Fully Loaded SKU Profit for Longer-Term Decisions
A fully loaded analysis can assign selected fixed expenses, such as ordinary warehouse rent or shared supervision, to products using a documented management allocation. Thus, it reveals how much operating capacity an assortment consumes over time.
Fully loaded SKU profit = SKU contribution profit – Allocated fixed operating costs.
Nevertheless, these allocations are not automatically capitalizable inventory costs. Moreover, a negative fully loaded figure does not necessarily mean that discontinuing the product saves the allocated rent. Managers should consider avoidable costs and alternative uses of capacity before acting on that measure alone.
3. Classify Costs Before Calculating True SKU Profitability
Misclassification can undermine true SKU profitability even when every formula is mathematically correct. For example, a team may subtract inbound freight twice, treat ordinary storage as part of inventory COGS, or include a refundable tax in product cost. Accordingly, cost categories should be approved before building an allocation worksheet.
Inventory Acquisition Costs in the SKU Profitability Model
For purchased goods, qualifying acquisition expenses can include net supplier price, inbound transportation, non-recoverable import duties, eligible insurance, brokerage, and directly attributable handling. These costs generally contribute to the inventory amount that becomes COGS when the relevant units sell.
The IFRS guidance on IAS 2 Inventories explains acquisition, conversion, and other relevant inventory costs. However, US GAAP and applicable tax rules must also be considered where relevant. Specific issues, such as abnormal losses or recoverable taxes, require treatment consistent with the applicable framework rather than an automatic allocation to every surviving unit.
Selling Expenses That Reduce SKU Contribution Margin
Outbound delivery, merchant processing, marketplace charges, and variable fulfillment services ordinarily belong below accounting gross profit in a management contribution analysis. Similarly, return labels and inspection costs may reduce contribution when they are not already captured elsewhere.
Inbound freight attached to unsold inventory may remain in the inventory valuation under the applicable policy. By contrast, freight to deliver an already sold product to a customer relates to the sale.
Fixed Warehouse Overhead and Double-Counting Controls
Management may allocate ordinary rent, utilities, or fixed supervisors to understand the resources consumed by an assortment. Still, the allocation should remain separately visible when it does not qualify as an inventory cost. Under IAS 2, ordinary storage expenses are generally excluded from inventory cost unless storage is necessary during production before a further stage.
To complete the review, maintain a cost map showing source invoice, accounting classification, allocation driver, and reporting period. Then check that every invoice enters the model once.
4. Calculate Landed Cost per SKU With Freight and Duties
Landed cost provides the acquisition-cost foundation for a credible product profit calculation. Without it, imported products can look artificially attractive, particularly when supplier invoices arrive well before transportation and customs bills. Therefore, calculate the cost by receipt or cost layer rather than applying a rough overhead percentage to all products.
Net Purchase Cost and SKU-Level Quantity Records
Start with invoice price, trade discounts, received quantity, and appropriate currency conversion. Suppose a business buys 400 units at $20 each after discounts. Its starting supplier cost is $8,000.
Short shipments, damaged units, supplier credits, and abnormal losses may change the costs and quantities used for inventory valuation. As a result, finance should approve the denominator and adjustment policy rather than automatically spreading every unusual loss across the acceptable units.
Qualifying Freight, Import Duties, and Brokerage
Next, identify eligible ocean or air freight, origin and destination handling, cargo insurance, customs brokerage, non-recoverable duties, and inbound movement. Meanwhile, an invoice described as transportation may actually relate to a warehouse transfer or final customer delivery, so its nature must be reviewed.
Import duties need special attention because classification, origin, customs value, and entry-date rules can differ by SKU. Likewise, recoverable taxes should not be treated as permanent acquisition costs merely because they were paid at the border.
Landed Cost per Unit and Historical Cost Layers
Landed cost per unit = (Net purchase cost + Allocated qualifying acquisition charges) / Appropriate received quantity.
For example, if 400 eligible units carry an $8,000 supplier cost and $1,800 of qualifying acquisition charges, landed cost equals $9,800 / 400, or $24.50 each. That is not the fully loaded expense of selling the product; fulfillment and managerial overhead are considered later.
Additionally, the cost assigned to an actual sale should follow the organization’s supported inventory costing method. A new replacement price is useful for planning, but it does not automatically replace the historical COGS already recognized for earlier transactions.
Late Freight Invoices and Inventory Cost Adjustments
A container may be received and partly sold before the final carrier invoice arrives. Accordingly, some businesses use a documented estimate at receipt and reconcile it when the actual bill arrives. Depending on the accounting framework and facts, adjustments may affect remaining inventory, sold-unit COGS, or other entries.
Preserve the shipment number, purchase order, receipt, vendor bill, and adjustment history. Otherwise, a margin report can show sudden changes that reflect delayed paperwork rather than genuine performance. This control is essential for true SKU profitability across reporting periods.
5. Freight Allocation Methods That Improve SKU Profitability Accuracy
When one shipment contains several SKUs, shared freight must be assigned using a reasonable driver. The best choice depends on how the carrier priced the shipment.
Compare Unit, Value, Weight, and Volume Allocation
| Allocation method | Driver | Useful when |
|---|---|---|
| Unit count | Units received | Products have similar freight requirements |
| Purchase value | Supplier invoice amount | Charges are linked to value |
| Weight | Gross or chargeable weight | Freight is weight-sensitive |
| Cubic volume | Space occupied | Products are bulky or volume-priced |
Allocated SKU freight = Total qualifying freight × (SKU driver amount / Total shipment driver amount).
For example, assume a $1,800 inbound freight bill covers two products. If SKU A occupies one-third of the chargeable volume and SKU B occupies two-thirds, allocate $600 to A and $1,200 to B. By contrast, splitting that expense by unit count could produce a very different margin for each product.
Assign Import Duties to Individual SKUs
Duties should follow actual customs treatment rather than a general freight allocation rule. Specifically, use the relevant product classification, origin, customs value, and applicable entry-date requirements. The USITC Harmonized Tariff Schedule is an official reference for US tariff provisions, although complex entries should be reviewed with a qualified adviser.
Furthermore, a shipment may include products subject to different duty treatments. Assign directly attributable duties to the relevant SKUs before distributing genuinely shared charges. The duty amounts used in the worked example below are hypothetical, not current tariff quotations.
Reconcile Brokerage, Insurance, and Shared Shipment Fees
A brokerage bill may be allocated by supplier value or another documented driver when direct tracing is impractical. Suppose a $300 fee relates to a shipment containing $8,000 and $4,000 in supplier value. The two products receive $200 and $100, respectively, under a value-based allocation.
Finally, total each allocated cost pool and compare it to its original invoices. Review duplicate imports, partial receipts, and corrections before approving the landed cost. As a result, the final profitability report can identify whether a margin change came from actual freight economics or merely a faulty allocation.
6. Warehouse Cost per SKU: Storage, Handling, and 3PL Expenses
A small product stored in a bin and a bulky product occupying a pallet position should not automatically receive the same management overhead per unit. Consequently, calculate storage and activity costs separately before combining them in a management report.
Storage Allocation Using Pallet-Days or Cubic-Foot-Days
A pallet-day represents one pallet position occupied for one day. A cubic-foot-day represents one cubic foot occupied for one day.
Allocated SKU storage expense = Storage cost pool × (SKU measured storage usage / Total measured usage).
Suppose a $700 fixed warehouse cost pool is assigned using 700 units of measured space-time usage. SKU A accounts for 300 and SKU B for 400. Therefore, the resulting allocations are $300 and $400. This is a management allocation of the defined expense pool; it should not automatically be capitalized into inventory.
Picking and Packing Within SKU Contribution Margin
Picking is driven by fulfillment activity rather than storage duration. For that reason, picking expenses may be assigned by picks, order lines, handling minutes, or a carefully maintained labor standard. Meanwhile, cartons, cushioning, and special packaging should follow actual consumption where feasible.
Receiving expenses deserve a separate review because some activities may qualify as costs required to bring purchased inventory to its appropriate location and condition. Routine storage after goods are ready for sale generally serves a different accounting purpose. Keeping receiving, storage, and fulfillment distinct makes true SKU profitability easier to interpret.
Break 3PL Invoices Into Meaningful Cost Pools
Third-party logistics providers often bill receiving, storage, picks, packing materials, shipping labels, returns, and special projects on one invoice. However, those charges do not share one operational driver. Separate them before assigning them to SKUs or orders.
For example, variable pick fees may follow shipped order lines, while storage charges follow pallet-days. Additional return inspection can be attached to returned transactions rather than all outbound units. Where internal warehouse workflows are more complex, Xorosoft’s XoroWMS connects warehouse activity with inventory operations and can provide relevant operational records for analysis.
7. Improve True SKU Profitability With Channel-Level Selling Costs
After landed COGS and warehouse activity are understood, analyze the cost of completing each sale. Therefore, product-level totals should be broken down by channel whenever those differences are significant.
Payment Fees and Marketplace Costs by SKU
Direct ecommerce transactions may incur payment processing and applicable platform charges. Marketplace orders can also generate category-based referral fees or fulfillment service charges. In contrast, wholesale accounts often have customer-specific discounts and service requirements.
Use transaction and settlement records where available. A universal percentage can work as an early estimate, but it should not replace actual channel-level reconciliation. Additionally, keep advertising costs identifiable so managers can compare contribution before and after a defensible marketing allocation rather than hiding uncertain assumptions.
Allocate Outbound Freight Across Multi-SKU Orders
Outbound shipping must be distinguished from freight-in. When a parcel contains several SKUs, its carrier charge can be assigned by chargeable weight, dimensional volume, or another justified driver. By doing so, the model avoids charging the whole parcel to the first order line and leaving the others apparently cost-free.
For example, a free-shipping promotion shifts more delivery cost to the business, whereas a customer freight charge may offset part of that expense. Therefore, compare net economics rather than carrier costs in isolation.
Returns, Refunds, and Reverse Logistics Without Double Counting
Returns can reduce net revenue and create additional inspection, return label, restocking, disposal, or repackaging expense. However, a saleable returned unit can retain inventory value. The model must distinguish refunded revenue, reversed COGS, and truly incremental handling costs.
If refunds have already reduced net revenue, subtracting them again understates contribution. Similarly, do not treat the full original product cost as an additional return loss when the accounting entries already captured it. Accurate true SKU profitability requires a consistent return treatment across all reporting channels.
8. True SKU Profitability Example: Two Products in One Shipment
A concrete example illustrates why the cost layers should remain visible. Imagine a distributor importing 400 units of compact apparel SKU A and 200 units of bulky home-product SKU B. Each has a $20 supplier unit price. Assume all received units are saleable and sold during the illustrative reporting period.
The shipment incurs $1,800 of qualifying inbound freight and $300 of shared brokerage. For illustration, SKU A consumes one-third of chargeable volume, while SKU B consumes two-thirds. Brokerage is allocated by supplier purchase value. Separately, the hypothetical customs records assign $1,000 of import duty to A and $200 to B. These are example amounts, not current tariff rates.
Landed Cost per SKU: Inputs and Calculation
| Acquisition cost | SKU A: 400 units | SKU B: 200 units |
|---|---|---|
| Supplier purchase cost | $8,000 | $4,000 |
| Allocated inbound freight | $600 | $1,200 |
| Assigned import duties | $1,000 | $200 |
| Allocated brokerage | $200 | $100 |
| Total landed cost | $9,800 | $5,500 |
| Landed cost per unit | $24.50 | $27.50 |
Together, supplier costs total $12,000, and additional eligible acquisition charges total $3,300. Accordingly, the combined landed cost is $15,300.
Contribution Profit and Fully Loaded SKU Margins
Assume net selling prices average $45 for SKU A and $50 for SKU B. The net revenue figures already account for relevant discount and refund assumptions. Moreover, the return-handling amounts below represent additional expected expenses per sold unit, not a second subtraction of refunded sales.
| Per-unit measure | SKU A | SKU B |
|---|---|---|
| Net selling revenue | $45.00 | $50.00 |
| Landed COGS | $24.50 | $27.50 |
| Gross profit | $20.50 | $22.50 |
| Outbound shipping | $4.00 | $6.00 |
| Picking and packing | $1.50 | $2.00 |
| Channel/payment fees | $2.00 | $2.50 |
| Additional return handling | $1.00 | $1.50 |
| Contribution profit | $12.00 | $10.50 |
| Allocated fixed warehouse expense | $0.75 | $2.00 |
| Fully loaded profit | $11.25 | $8.50 |
SKU A has a 45.6% gross margin, 26.7% contribution margin, and 25% fully loaded margin. By comparison, SKU B shows 45% gross margin, 21% contribution margin, and 17% fully loaded margin. Thus, the apparent similarity in gross profit conceals a meaningful difference after fulfillment and selected overhead allocations.
The fixed warehouse expense is a $700 monthly management pool. Under the assumed space-time usage method, A receives $300, or $0.75 per sold unit, and B receives $400, or $2 per sold unit. In a real operation, the model must distinguish costs associated with stock held from expenses attributable to the reporting period’s sales.
Reconcile the Reporting Period and Test Higher Freight
Total net revenue is $28,000, while landed COGS equals $15,300. Therefore, gross profit is $12,700. Variable selling and fulfillment expenses amount to $5,800, leaving $6,900 contribution. After the $700 selected fixed warehouse allocation, the defined fully loaded measure is $6,200. This is not company-wide net income because other corporate expenses are outside the example.
Now suppose a later shipment raises SKU B’s inbound freight by $2 per unit, with other assumptions unchanged. Landed unit cost would rise to $29.50, and fully loaded profit would fall from $8.50 to $6.50. Consequently, its fully loaded margin would drop from 17% to 13%. This illustrates why true SKU profitability should be refreshed after material freight and duty changes rather than left unchanged until an annual review.
9. Compare SKU Profitability Across Shopify, Amazon, and Wholesale
The same SKU can produce several contribution margins because its sales channels have different economics. Instead of relying only on a company-wide product average, compare margins by channel, customer type, and fulfillment location.
Shopify SKU Profit: Net Sales and Fulfillment Expense
For a Shopify order, combine actual net product revenue with the relevant landed COGS, payment fees, pick-and-pack charges, outbound shipping, and return costs. Additionally, allocate order-level expenses across line items when several SKUs share one parcel. Otherwise, a popular accessory could appear less profitable simply because the shipping charge was assigned to the wrong item.
The Xorosoft ERP listing on the Shopify App Store describes connected order, inventory, refund, and commerce workflows. Those records can support the data required for SKU analysis, although accounting classifications and specific allocation methods still need explicit validation.
Amazon SKU Contribution: Settlement Fees and Returns
Marketplace expenses should follow actual transaction records when possible. Referral fees, marketplace fulfillment, service charges, storage, and return-related costs may differ by category, program, product dimensions, and marketplace. Therefore, a single assumed fee percentage may be suitable for a rough scenario but not for a reconciled contribution report.
Likewise, paid advertising should be shown separately when precise SKU attribution is uncertain. A product can have attractive contribution before advertising while generating much less afterward. Label both measures clearly so merchandising teams can distinguish product economics from acquisition-spend decisions.
Wholesale SKU Profitability by Customer and Warehouse
Wholesale accounts may receive volume discounts but purchase by the case or pallet, often reducing fulfillment cost per unit. On the other hand, retailer-specific labeling, compliance activity, allowances, or delivery terms can add expense. Accordingly, review SKU contribution by customer segment when service differences are material.
Warehouse location also affects margins through handling productivity, storage rates, inbound routing, and delivery distance. Xorosoft’s integrations are relevant to connecting commerce and operational records. Still, each report needs consistent product identifiers, net-revenue definitions, and a documented way to allocate shared expenses.
10. SKU Profitability by Industry: Apparel, Furniture, Food, and Manufacturing
Effective true SKU profitability analysis reflects actual operating behavior instead of one standard rate for every category.
Apparel and Sporting Goods: Variants, Returns, and Seasonality
Apparel brands often manage many size and color variants. Although those products can share a supplier base cost, their markdown exposure, return behavior, and sell-through rates may differ. Therefore, style-level gross margin can hide a weak variation that consumes considerable working capital.
Sporting goods offer another contrast. Compact accessories may be cheap to store and ship, whereas large equipment requires special packaging and transportation. Consequently, warehouse cost and freight allocation should reflect size and handling requirements rather than treating every sold unit equally.
Furniture and Food: Storage, Damage, and Shelf-Life Economics
Furniture distributors should pay close attention to cubic volume, storage duration, damage, and two-person handling. Meanwhile, food businesses may incur refrigerated storage, spoilage, shrinkage, and product write-downs. Those expenses require careful classification because not all belong in capitalized inventory cost.
As a result, purchasing decisions should consider both unit margin and inventory turnover. The industries served by Xorosoft include apparel, furniture, wholesale, consumer products, food, and manufacturing, where connected inventory and operations records can help identify relevant cost drivers.
Manufacturing SKU Margins: Yield and Production Costs
Manufactured products require a different acquisition or conversion model from purchased finished goods. Materials, qualifying production labor, factory overhead, bills of materials, work orders, and yield can all affect the cost assigned to finished inventory.
However, abnormal waste should not automatically be spread over good units. Keep process inefficiency visible alongside product profitability, and follow the applicable accounting treatment. Otherwise, pricing teams may inherit production-cost distortions without seeing the underlying operational problem.
11. Maintain True SKU Profitability Across Periods and Warehouses
A good margin formula still produces weak answers when revenue and cost records do not refer to the same period or inventory layer. Consequently, reporting controls are essential as products move between facilities, purchase costs change, and invoices arrive after receipts.
FIFO, Weighted Average, and Recorded SKU Cost Layers
FIFO assigns earlier eligible inventory costs to units sold first, while weighted-average costing uses an average for eligible interchangeable inventory. Specific identification can be appropriate for items that are not ordinarily interchangeable. Therefore, the correct historical COGS may differ from the supplier’s latest replacement quote.
A current replacement-cost view is useful for planning, but it should be labeled separately. Otherwise, a forward-looking cost scenario may be mistaken for the margin actually recognized in a completed reporting period.
Late Charges and Inter-Warehouse Transfers
An importer may receive a freight bill weeks after the goods arrive. Similarly, stock can move from a central warehouse to a regional fulfillment center before sale. These events can require different inventory, expense, and managerial allocation treatments depending on their purpose and accounting requirements.
Accordingly, preserve shipment references, transfer records, receipt dates, and the quantity remaining on hand when adjustments are posted. Reconcile late charges to actual invoices and avoid silently pushing every correction into the current month’s product margin.
Reconcile SKU Profit Reports With Finance
Begin with net sales and settlement records, then reconcile inventory COGS to the ledger. Afterward, match shared freight, storage, and fulfillment allocations to their respective invoice totals. Differences caused by timing or management-only overhead should be explained rather than hidden.
A management report does not have to equal corporate net income because it may exclude administrative, financing, or other costs. Even so, it should provide a traceable bridge.
12. Common Errors That Distort True SKU Profitability
Many profitability mistakes originate in data preparation rather than arithmetic. Therefore, build validation into the workflow before the numbers reach management.
Double-Counting Landed Freight and Return Costs
If freight-in has already flowed through inventory COGS, subtracting the same invoice below gross profit counts it twice. Likewise, when refunds have already reduced net revenue, deducting them again as a separate selling cost understates contribution. Recoverable taxes also need to be separated from non-recoverable duties.
A reliable solution is to assign every source charge one primary classification and maintain a clear mapping into management measures. In addition, review unusual margin swings before approving an assortment or promotional decision.
Allocation Drivers That Blur Product-Level Profit
Allocating all shared expenses by unit count is tempting, but cost pools have different drivers. Freight may depend on weight or cube, storage on space-time usage, and picking on order activity. Meanwhile, import duty calculations follow customs treatment rather than warehouse convenience.
Use direct tracing whenever practical. If an allocation is necessary, document why it reflects the activity or charge. Then check that the allocated total equals the source pool. These controls support true SKU profitability without requiring unnecessary complexity.
Fixed Overhead and Product Exit Decisions
A product can show negative fully loaded profit after receiving a portion of warehouse rent. However, discontinuing it may not remove the lease expense. Therefore, managers should evaluate contribution, avoidable cost, and whether released space has a better use before dropping the SKU.
Similarly, evaluate inventory turnover and cash exposure. A high-margin product that sits for months may be less attractive than a fast-moving item with moderate unit contribution. The margin is a decision input, not the entire decision.
13. When SKU Profitability Reports Outgrow Spreadsheets
Spreadsheets can work for a small assortment, but growth often creates a data-integration problem rather than a calculation problem. Orders, receipts, supplier bills, transfer records, returns, and accounting entries may reside in separate systems with inconsistent SKU identifiers.
Signs of Unreliable SKU Margin Analysis
Common warning signs include frequent manual reconciliation, unexplained cost adjustments, freight invoices with no shipment reference, and different margins for the same product in finance and operations.
The correct response is not automatically to buy more software. First, define the transactions and cost categories needed, establish consistent product codes, and document who approves changes. Then determine whether the existing tools can maintain those controls at the required scale.
Connected Purchasing, Inventory, Warehouse, and Accounting
Xorosoft’s XoroONE brings together inventory, purchasing, warehouse management, ecommerce operations, accounting, and reporting for inventory-driven businesses. Separately, its XoroERP provides a broader ERP setting for operational and financial workflows. These connected records can reduce manual data movement and improve traceability.
Nevertheless, no ERP should be assumed to calculate every particular landed-cost driver, customs allocation, or fully loaded profitability measure without verifying that workflow. The finance team still owns the cost policy, and operations must maintain accurate source activity.
Test ERP Workflows Against Real SKU Cost Scenarios
Before upgrading, test a mixed-SKU import, a late freight invoice, a returned item, a marketplace fee adjustment, and an inter-warehouse transfer. Ask where each cost appears, how it is allocated, and whether the result ties to accounting. In addition, verify how reports preserve historical cost layers and adjustments.
When those tests succeed, automation becomes meaningful. Instead of copying disconnected exports into a model each month, teams can focus on explaining margin movements and acting on them. That is the real operational value of better true SKU profitability reporting.
14. Use True SKU Profitability to Guide Pricing and Replenishment
Once a SKU profit calculation is reliable, examine the results alongside inventory turnover, sales velocity, customer service requirements, working capital, and warehouse capacity. A SKU with strong unit margin but slow sales can still tie up cash; meanwhile, a lower-margin item may generate useful contribution through rapid turnover and efficient fulfillment.
Prioritize Changes by the SKU Margin Driver
Begin with the largest controllable issue. If inbound freight has eroded margin, review shipment consolidation, product dimensions, supplier terms, and routing. If storage dominates, examine reorder timing, slow-moving stock, and available capacity. Likewise, when returns reduce contribution, investigate quality, product details, packaging, and customer expectations.
Price increases are not the only remedy. For example, improving packaging or adjusting warehouse placement might reduce cost without changing the selling price. Consequently, compare the expected contribution and volume effects before committing to a change.
Assign Ownership for Ongoing Product Profit Reviews
Finance should approve inventory cost policies and reconciliations. Purchasing should maintain supplier terms and monitor duty or price changes. Warehouse operations should validate storage and handling drivers, while channel teams should maintain fee and return data. Together, these owners can explain results instead of debating inconsistent spreadsheets.
Review margins at month-end and whenever major freight, duty, supplier, or fulfillment changes occur. Additionally, retain the assumptions used in each period so historical comparisons remain meaningful. A report that cannot explain its own changes will quickly lose credibility with managers.
Start With a Focused True SKU Profitability Review
Choose a small group of high-revenue, bulky, high-return, or tariff-sensitive products. Reconcile their acquisition costs, sales, variable expenses, and selected overhead allocations from source records. Next, use what you learn to refine pricing, replenishment, and fulfillment decisions before extending the process across the full catalog.
For businesses managing multiple warehouses or sales channels, contact Xorosoft to discuss how connected purchasing, inventory, warehouse, and financial workflows fit your actual costing requirements. Ultimately, the objective is not a more complicated margin percentage. It is a repeatable view of true SKU profitability that helps people make better operating decisions.
Frequently Asked Questions About True SKU Profitability
How is true SKU profitability calculated?
Subtract landed COGS and variable selling costs from net revenue. For fully loaded profit, also deduct a separate allocation of fixed operating expenses.
How do you allocate freight across SKUs?
Use weight, volume, value, or another defensible driver. The allocated amounts must reconcile to the original inbound freight invoice.
Do import duties count toward landed cost?
Yes. Non-recoverable import duties generally belong in acquisition cost. Calculate duties using each product’s classification, origin, customs value, and applicable rules.
Does warehouse rent reduce SKU profitability?
For managerial analysis, allocate relevant rent when calculating fully loaded profit. Ordinary storage rent generally remains separate from inventory COGS.
How do returns and fulfillment fees affect profit?
Outbound shipping, picking, and transaction fees lower contribution. Refunds reduce net revenue; count extra return handling once, without duplicating existing adjustments.
How is contribution margin different from gross margin?
Gross margin deducts inventory COGS. Contribution margin also deducts attributable variable selling and fulfillment expenses, making channel and order comparisons more useful.
When should companies use ERP for SKU profitability?
Consider ERP when disconnected purchasing, inventory, warehouse, sales, and accounting records make cost allocation and reconciliation slow or unreliable.
Recent Posts
-
 How to Calculate True SKU Profitability With Freight, Duties, and Warehouse Costs
-
 Procurement Exception Statistics 2026: Changes, Shortages, and Invoice Mismatches
-
 Native ERP Connector vs Middleware vs Custom API for Shopify
-
 AI Exception Management in ERP: Automating Detection Without Losing Control
-
 What Is Delivery Promise Accuracy and How Should Operations Measure It?