For businesses aiming to optimise their product selection, conducting a SKU profitability analysis can be an essential step.
1. When Revenue Growth Hides Weak Product Margins
An ecommerce brand can finish its strongest sales quarter and still be unable to explain where the profit went. Orders are up, warehouse activity is rising, and the income statement shows healthy revenue. Yet the finance team cannot say whether the best-selling jacket, furniture set, or replacement part deserves another purchase order.
The issue is rarely a shortage of reports. More often, different reports describe different versions of product performance. A storefront shows sales less the item’s recorded cost. Accounting shows cost of goods sold (COGS) after inventory adjustments. A marketplace deducts fees. Meanwhile, the carrier and warehouse send invoices that may never reach the product report. Each number can be correct within its own definition and still leave the business with an incomplete picture.
1.1. Why High-Volume SKUs Are Not Always the Most Profitable
Consider a product sold for $100 with $45 in accounting COGS. Its gross profit appears to be $55. After marketplace fees, payment charges, outbound shipping, packing, and return handling, however, the contribution might be closer to $22. Another product with fewer orders could contribute more profit per unit because it is less expensive to fulfill and rarely gets returned.
That difference changes decisions. Buyers should not replenish a product only because it sells quickly. Marketing teams should not assume a high-revenue campaign generated strong economics. Finance teams need to identify whether discounts, purchasing costs, or fulfillment expense caused the margin decline. Reliable SKU profitability analysis makes those trade-offs visible.
1.2. Why Software Selection Starts with a Profit Definition
The first question is not whether an ERP is superior to accounting software. It is whether the current systems capture the transactions required to explain product economics. A retailer with one warehouse and stable costs may obtain reliable results from an accounting application and a structured reporting model. A company importing products, operating several warehouses, and selling through multiple channels has a more demanding reconciliation problem.
Before purchasing software, agree on which costs count as gross profit, which belong in contribution profit, and which remain company-level expenses. Once those rules are clear, the software comparison becomes much more useful.
2. What SKU Profitability Analysis Actually Measures
SKU profitability analysis measures the revenue and costs attributable to an individual stock-keeping unit over a defined period. The objective is not to create one impressive margin percentage. It is to explain how net sales become accounting gross profit and how additional operating costs change the product’s contribution.
A SKU is more specific than a product title. A jacket sold in three colors and five sizes may have fifteen separate variants, each with different markdowns, returns, and sell-through patterns. Reporting only at product-family level can conceal these differences. The same SKU may also produce different results in a direct-to-consumer order and a wholesale shipment.
2.1. Gross Profit and Gross Margin Provide the Accounting Baseline
Gross profit is net sales minus COGS. Net sales should reflect applicable discounts, refunds, and allowances under the company’s accounting policy. COGS should reflect the approved inventory costing method, not simply the most recent supplier quote.
Gross profit = Net sales − COGS
Gross margin (%) = Gross profit ÷ Net sales × 100
For example, $100 in net sales and $45 in recorded COGS produces $55 in gross profit and a 55% gross margin. This is the right starting point because the components can be checked against financial records. Still, gross margin does not include every cost of selling and delivering the product.
2.2. Contribution Margin Explains Channel Economics
Contribution profit deducts other relevant variable expenses, such as marketplace referral fees, payment processing, outbound freight, pick-and-pack activity, and attributable return handling. Businesses may also allocate marketing expense when there is a defensible method for associating that spending with a SKU or order.
Contribution profit = Net sales − COGS − Other attributable variable costs
Contribution margin (%) = Contribution profit ÷ Net sales × 100
This management calculation must be distinguished from inventory accounting. The IAS 2 guidance describes qualifying inventory costs and distinguishes them from ordinary selling expenses. US companies should apply the relevant US GAAP requirements rather than using IFRS rules automatically. Allocating outbound shipping to a SKU for management analysis does not make it part of the inventory asset.
2.3. How Product Profitability Analysis Supports Better Decisions
A $10 contribution on 10,000 units provides more total contribution dollars than a $25 contribution on 500 units. At the same time, a high-margin product that sits in storage for nine months can absorb working capital and expose the business to markdowns. Profit dollars, margin percentages, inventory turnover, and replenishment commitments should therefore be reviewed together.
Managers should also distinguish preliminary margins from reconciled results. Late supplier invoices, returns, and cost adjustments can change reported profit after a sale. A useful SKU profitability analysis specifies both its reporting period and the status of underlying costs.
| Metric | Definition | Useful management question |
|---|---|---|
| Gross profit | Net sales less accounting COGS | Is the product economically sound before selling expenses? |
| Gross margin | Gross profit divided by net sales | How does the product’s trading margin compare? |
| Contribution profit | Gross profit less defined variable expenses | What does the product contribute after channel costs? |
| Contribution margin | Contribution profit divided by net sales | Which SKUs or channels retain more from each sales dollar? |
3. Where Accounting Software Helps—and Where Product Margin Reports Fall Short
Accounting software performs essential work that any profitability initiative must preserve. It records bills and invoices, supports financial controls, maintains the general ledger, and produces the statements management uses to evaluate the company. A visually attractive dashboard cannot replace accurate books.
The difficulty usually begins when product profitability requires detail stored outside accounting. Shipping, warehousing, advertising, and marketplace expenses may be posted correctly at account level without being linked to the products that generated them.
3.1. Accounting Systems Can Already Track Items and COGS
Many accounting products support item records, inventory valuation, and product-related reporting. QuickBooks, for example, documents weighted-average inventory costing and inventory valuation reports in supported workflows. Its Intuit support article describes how inventory value becomes an expense when units are sold.
It would therefore be misleading to claim that accounting software cannot calculate product costs. A smaller company with straightforward purchasing, predictable unit costs, and reliable inventory records may be able to create accurate gross-margin reporting without changing platforms. The relevant distinction is whether the required data and operational controls fit the software’s capabilities.
3.2. Why Product-Level Profit Reports Often Miss Costs
A general ledger might contain $18,000 in marketplace fees for the month without showing which order lines incurred them. Carrier bills may include shipping charges for hundreds of packages. Warehouse labor may sit in payroll, while supplier rebates arrive separately from purchase invoices. The accounting records can be correct even when the SKU contribution report is incomplete. SKU profitability analysis needs the operational references that connect those charges to products.
Finance teams sometimes bridge the gap with exports and spreadsheets. That can work, but it requires controlled SKU mappings, consistent time periods, and a documented allocation method. Problems multiply when a product identifier changes, a refund reaches another month, or an integration fails without a visible exception report.
3.3. When Accounting Software Is Still Enough
A company with one fulfillment location, a manageable catalog, and stable purchasing arrangements may need stronger cost controls rather than a new ERP. Updating product costs, standardizing identifiers, and reconciling channel fees could solve the problem at lower cost. A dedicated profitability application may also be appropriate if accounting and inventory operations already work well.
Ask which information is missing, how often it is missing, and what it costs to repair the report. If the existing stack produces reliable SKU profitability analysis without excessive manual effort, a complete system migration may offer little immediate benefit.
4. ERP vs Accounting Software for SKU Profitability Analysis
ERP becomes more relevant when the same transaction affects purchasing, inventory, warehousing, accounting, and customer fulfillment. A product receipt changes physical availability, supplier obligations, and inventory value. A shipment affects inventory movement, sales status, and sometimes customer-specific financial reporting. A connected system can make those relationships easier to trace than separate applications exchanging incomplete records.
4.1. Connected Purchasing and Receiving Improve Cost Traceability
Imagine 500 units arriving from an overseas supplier. Purchasing has the purchase order. Receiving records the actual quantity. Finance receives the supplier invoice. Two weeks later, the freight provider sends a charge that may need to be assigned to the receipt. In disconnected applications, each department may see different cost information until someone completes the reconciliation.
An appropriately configured ERP can link purchase orders, receipts, supplier bills, and cost adjustments. Xorosoft’s XoroONE platform brings together inventory, purchasing, accounting, and operational workflows for inventory-driven businesses. The relevant benefit is traceability, not the mere presence of another dashboard.
4.2. Accounting Integration Can Reduce Reporting Friction
When inventory transactions and financial entries share controlled identifiers, finance can investigate which purchase, adjustment, or shipment changed a margin. Operations can review discrepancies without reconstructing a transaction from several unrelated exports. The result may be fewer manual joins and clearer responsibility for correcting errors.
That advantage is conditional. Integration design, chart-of-accounts configuration, costing methods, and user processes still matter. A company must verify that the chosen ERP actually supports its required dimensions and reports rather than assuming every financial measure appears automatically.
4.3. What ERP Does Not Automate in SKU Profitability Analysis
An ERP may produce reliable product gross profit without capturing all marketplace advertising, payment processing, or third-party logistics expenses. Those costs may originate elsewhere and require integration. Shared campaign spending also needs a defensible rule for attributing expense to products. No software can decide that business policy without input from finance and operations.
Product profitability reporting remains an analytical process as well as a system capability. Businesses should test the exact cost bridge they need, including late invoices, discounts, returns, warehouse charges, and reconciliation to the general ledger.
| Capability | Accounting software | Integrated ERP | Specialized profitability application |
|---|---|---|---|
| General ledger | Core strength | Commonly integrated | Usually relies on another system |
| Product gross margin | Often supported | Commonly supported | Often supported through imports |
| Purchasing and receiving | Varies by product | Usually connected | Usually not its primary purpose |
| Multi-warehouse activity | May need add-ons | Often supported | Typically relies on external records |
| Marketplace contribution margin | May require integrations | Depends on configuration and integrations | Can be a core specialty |
| Reconciliation | Strong financial controls | Can connect operational and financial records | Depends on source-data quality |
A business should compare implementation effort and reporting reliability alongside subscription price. For straightforward operations, simpler software may remain the most efficient choice.
5. Inventory Costing Rules Behind Accurate Product Margins
Even perfect order data cannot produce a trustworthy margin if the inventory cost is wrong. Supplier prices change, freight bills arrive late, and returns alter the quantity and condition of available goods. A credible profitability model should preserve the difference between recorded cost, estimated replacement cost, and managerial allocations.
5.1. Landed Costs Belong in the Right Place
Suppose a product has a supplier price of $40 and another $5 of qualifying inbound costs per unit. If the applicable accounting policy requires those expenses to be included in inventory, the acquisition cost is $45. A sale at $70 then produces $25 in gross profit rather than the $30 suggested by supplier price alone. This difference grows quickly across thousands of units.
Not every transportation charge is an inventory cost. Inbound freight may qualify for capitalization, while outbound delivery to the customer is generally evaluated separately. Those categories must remain distinct in SKU profitability analysis. Deducting inbound freight both within COGS and again as a selling expense would understate profit.
5.2. Late Bills and Inventory Adjustments Change Margins
A company may receive and sell products before the final freight invoice arrives. Additional qualifying costs can then require adjustments to inventory value, COGS, or both, depending on which units remain on hand. The Microsoft Business Central guidance explains why cost adjustment processes matter when charges are recorded after related inventory activity.
Reports generated before these adjustments may disagree with results after month-end close. SKU profitability analysis therefore needs a clear reporting status and cutoff. Establish a clear distinction between provisional operational margins and finalized accounting margins. Finance should also document how credit notes, damaged stock, and inventory write-offs affect product costs.
5.3. FIFO, Weighted Average, and Standard Costs Are Not Interchangeable
Consider 100 units purchased at $40 followed by 100 units at $50. In a simplified FIFO illustration, selling the first 100 units assigns $4,000 in COGS. Under a simplified weighted-average calculation, the average cost is $45, so the corresponding COGS is $4,500. The sales revenue is unchanged, yet gross profit differs by $500.
These methods carry different accounting requirements and operational implications. Companies should follow their applicable financial reporting rules and approved policies rather than choosing whichever method makes margins look strongest. A management view based on latest replacement cost can be useful, but it must be labeled differently from posted accounting COGS.
5.4. Returns Need an Inventory Outcome as Well as a Refund
A returned product might be resalable, require refurbishment, enter damaged inventory, or be discarded. Those outcomes do not have identical accounting effects. The original refund, return shipping, handling labor, and inventory write-off should therefore be traced separately. Otherwise, managers can either miss important expenses or count the same loss twice.
6. SKU Profitability Analysis for Shopify, Amazon, and Wholesale
A product rarely has one universal contribution margin when it sells through several channels. Prices, discounts, fees, fulfillment arrangements, and return patterns differ. Strong multichannel reporting therefore needs both a consolidated SKU view and a way to explain channel-level results.
6.1. Shopify Product Margins Depend on Recorded Costs
Shopify can report gross profit by product and variant when the necessary cost-per-item information is present. The Shopify Help Center describes those reports and their dependence on underlying costs. A useful gross-profit view does not necessarily include every outbound delivery, advertising, or operational expense used in a contribution calculation.
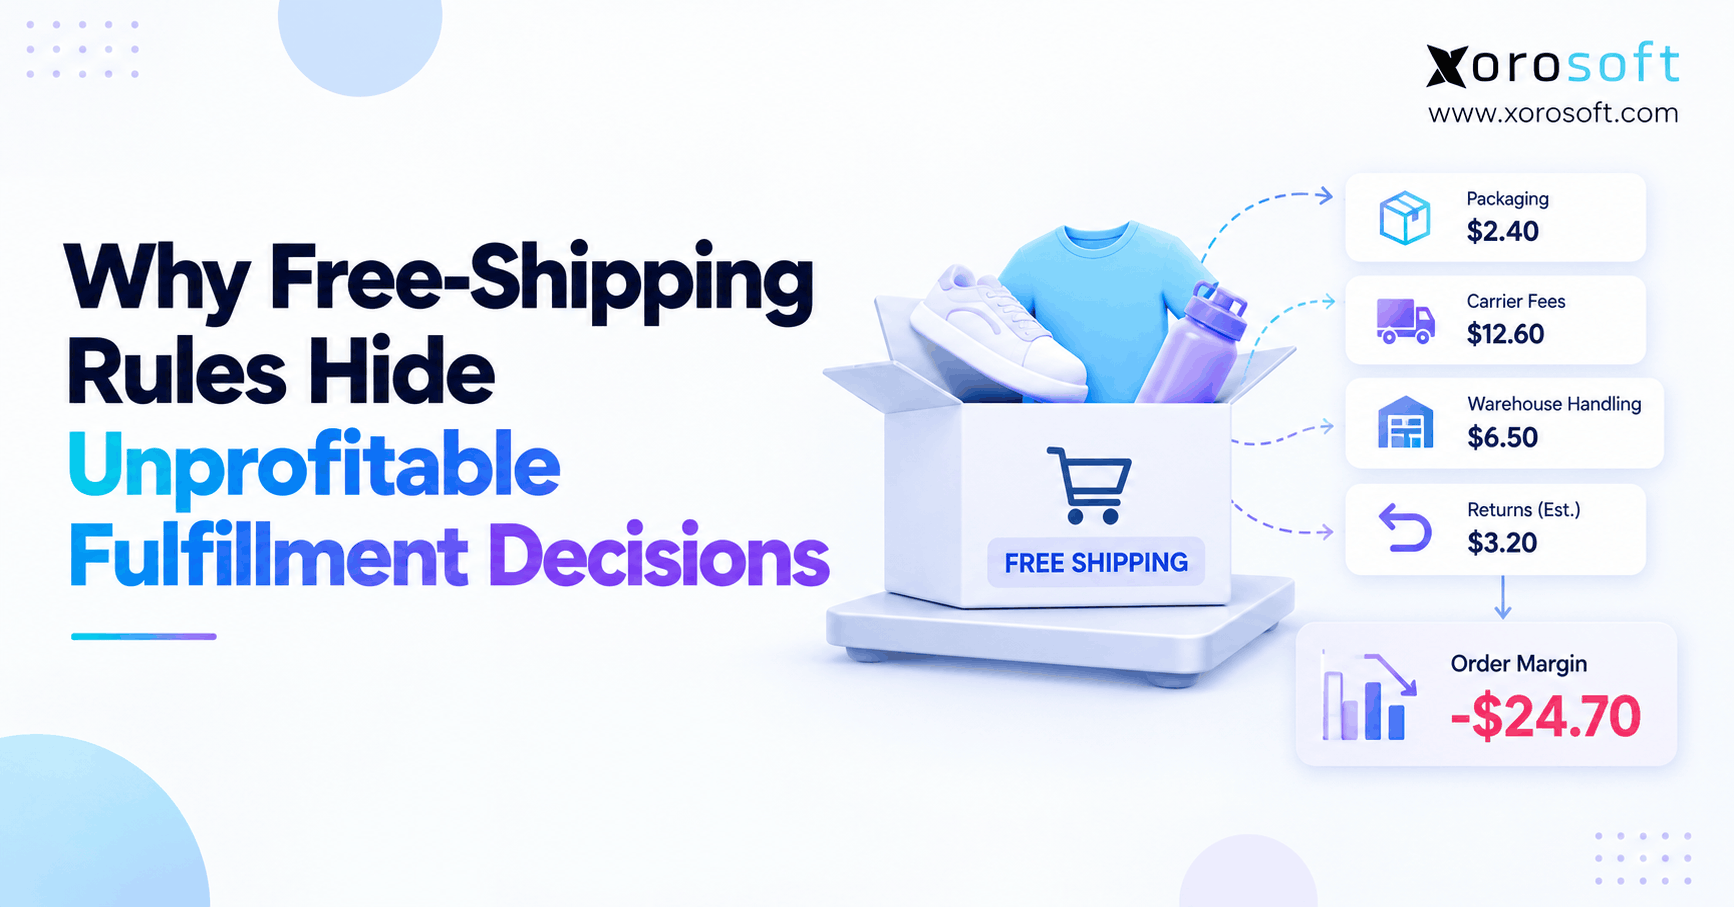
For example, a free-shipping promotion may raise conversions while weakening the profit per order. A product variant might also experience more returns than the average for its product family. To interpret those effects, ecommerce operators need accurate order-line information and a consistent way to associate relevant expenses with sold units.
6.2. Shopify ERP Integration and Channel Data Quality
Growing merchants may need consistent product identifiers, synchronized inventory movements, customer orders, refunds, and accounting entries. The Shopify app listing for Xorosoft provides a starting point for reviewing a potential integration. However, a connector’s existence is not proof that every fee or fulfillment expense is automatically attributed to the correct SKU.
During evaluation, review what data moves, how frequently it moves, and what happens when a transaction fails. Ask whether refunds preserve their original item references and whether a duplicate order can be detected. These operational details matter more to SKU profitability analysis than a generic claim that two systems are connected.
6.3. Amazon Margin Analysis Requires Actual Fee Records
Amazon sellers may encounter referral fees, FBA charges, storage expenses, advertising, and return-related costs. Their applicability depends on product attributes, marketplace programs, and fulfillment arrangements. Amazon offers a seller fee estimator for planning, but actual profitability should be based on posted orders and settlements when available.
A marketplace payout is not necessarily the same as net product revenue. It can combine sales, refunds, and deductions across several transactions. Reconcile the settlement to its underlying orders before assigning charges to individual SKUs. Estimates are helpful for forecasts, while actual records are preferable for historical reporting.
6.4. Wholesale Pricing Changes Customer-Level Profitability
A distributor may sell one SKU at different prices to different accounts. Rebates, freight terms, payment terms, order quantities, and handling requirements can vary as well. A pallet order and a series of small shipments might have similar gross margins but very different contribution economics.
Customer-SKU analysis can reveal those differences. It can inform price reviews and cost-to-serve discussions, although existing contracts and customer relationships must still guide commercial decisions. A useful report explains its allocations rather than presenting every difference as a directly observed expense.
7. How to Calculate SKU-Level Profit with a Worked Example
An effective SKU profitability analysis should show the full bridge between net sales and the measure management intends to use. This makes the calculation auditable and allows different teams to discuss the same figures. The following illustration uses fictional amounts rather than industry benchmarks.
7.1. Build the Calculation From Net Sales and COGS
Assume one ecommerce SKU produces $100 in net sales after discounts and refunds. Its accounting COGS is $45, including qualifying acquisition costs under the company’s policy. The order also incurs selling fees, fulfillment, shipping, and attributable marketing expenses. The report needs to distinguish direct transaction charges from estimated allowances.
| Profitability component | Per-unit amount |
|---|---|
| Net sales | $100 |
| Accounting COGS | −$45 |
| Gross profit | $55 |
| Marketplace and payment fees | −$12 |
| Pick-and-pack expense | −$3 |
| Outbound shipping | −$8 |
| Return-handling allowance | −$4 |
| Attributable marketing | −$6 |
| Contribution profit | $22 |
| Contribution margin | 22% |
The gross margin is 55%, while the contribution margin is 22%. Both are valid within the stated definitions. The difference is $33 of additional variable expenses. The return allowance here covers incremental handling costs; it does not repeat refunds already deducted from net sales.
7.2. Read the Margin Gap Before Taking Action
This cost bridge tells the business where investigation should begin. Perhaps outbound freight increased because of a packaging change. Perhaps the sales channel raised a fee, or marketing campaigns shifted toward products with weaker economics. A lower contribution margin does not automatically mean the product should be discontinued; it means the decision needs more context.
Compare total contribution dollars, demand stability, repeat purchases, and inventory commitments. A product may support important customer relationships or a broader assortment. Likewise, a high-margin item may consume too much cash if it moves slowly. Product-level profitability reporting should support these judgments, not substitute for them.
7.3. Use SKU Profitability Analysis for Sensitivity Testing
If outbound shipping increases by $5 while all other inputs stay fixed, contribution profit falls from $22 to $17. If a packaging improvement reduces that expense by $3 without introducing new costs, contribution rises to $25. These scenarios show the financial value of operational changes before teams make them.
Use sensitivity tests to examine supplier costs, returns, fees, and selling prices. Label the assumptions and test a realistic range rather than treating a single forecast as certain. Avoid automatically scaling unit-level savings to every order if the change might affect demand, service levels, or operational capacity.
8. Comparing SKU Margins Across Warehouses and Industries
Inventory-driven businesses should not force every product into the same profitability model. A furniture distributor, apparel brand, food wholesaler, and manufacturer can all require different cost dimensions. The accounting baseline remains important, but managerial analysis should reflect the processes that generate cost.
8.1. Multi-Warehouse Margin Analysis Needs Clear Cost Ownership
The same SKU may ship from two facilities with different carrier rates, labor requirements, and handling costs. Yet the accounting inventory cost may not be maintained separately at warehouse level. A management report can estimate location-level contribution using shipment and operating data, but it should not present allocated costs as if every amount came directly from the inventory ledger.
Warehouse transaction records become valuable when they can be matched to orders and products. Xorosoft’s XoroWMS product page describes warehouse-oriented workflows that businesses can assess as part of their data requirements. What matters for profitability is whether the system captures the specific activities the company wants to measure.
8.2. Apparel, Sporting Goods, and Furniture Need Different Drivers
Apparel and sporting goods businesses may track profitability by size, color, bundle, season, and promotion. A variant with a high return rate can perform differently from another variant sold under the same product name. Furniture companies face bulky handling, delivery constraints, damage, and product-specific service requirements.
In these settings, SKU profitability analysis gains value when paired with sell-through, inventory aging, and return patterns. A low-margin product with rapid turnover may be better than a higher-margin item that requires months of storage. The right decision considers both product economics and capital tied up in stock.
8.3. Food Distribution and Manufacturing Add Cost Complexity
Food distributors may need lot information, expiry controls, spoilage, and inventory write-offs. Manufacturers may need bills of materials, work-in-process accounting, production labor, overhead, and variance analysis. A simple supplier-price field is often insufficient to explain these businesses’ product costs.
Industry fit should guide software selection. The Xorosoft industries overview identifies several inventory-driven operating environments, but every buyer should validate the capabilities relevant to its own processes. Cost definitions and reporting needs differ even between companies in the same sector.
9. Choosing Software for Product Profitability Reporting
Software evaluation should begin with the reporting breakdown that matters most. Missing marketplace fees are a different problem from unreliable receiving records. A dashboard with sophisticated filters may not help if the cost posted to inventory is consistently late or incomplete.
9.1. Compare ERP, Accounting, and Specialized Tools on the Same Cases
Accounting software can remain the right system of record for a business with manageable inventory complexity. Specialized analytics can be useful when the main gap is channel fees or contribution reporting. Integrated ERP becomes more attractive when purchasing, warehousing, inventory valuation, and finance require coordinated processes.
SKU profitability analysis should be tested as a connected workflow, not as a standalone feature. Ask vendors to reproduce the same real-world scenarios instead of comparing feature descriptions alone. Include an imported SKU, a returned order, a bundled product, and a sale through a marketplace. Product demonstrations should show source records, adjustments, and reporting outputs, not only finished charts.
9.2. Product Profitability Features Vary by Vendor and Configuration
Platforms such as NetSuite, Acumatica, Business Central, Cin7, and other business systems serve different operational needs. Oracle, for instance, documents an item-level reporting example. That does not establish that every selling expense is included in every configuration or that all platforms calculate the same contribution definition.
A company evaluating Xorosoft’s XoroERP offering should take the same evidence-based approach. Require a demonstration of the relevant costing and reconciliation workflows. The strongest purchase decision is grounded in real transactions, realistic implementation requirements, and clear responsibility for any remaining integrations.
9.3. Integration Quality Is More Important Than Connector Counts
A useful integration preserves product identifiers, quantities, dates, discounts, returns, and the references needed to reconcile financial records. It should also make errors visible when transactions fail. Xorosoft provides an integrations overview, which can serve as a starting point for identifying connections to verify in detail.
During evaluation, distinguish between importing summary payouts and obtaining line-level fees. Ask how corrections flow back through the system. If data passes between applications but cannot be traced to an order and SKU, the integration may not support reliable SKU profitability analysis.
9.4. Include Implementation Effort in the Business Case
ERP can reduce duplicate work, but it introduces configuration, training, data migration, and ongoing administration. Conversely, a cheaper software stack can become expensive when employees spend substantial time repairing reports. Compare the full cost of ownership, not subscription fees alone.
If reviewing enterprise alternatives, the vendor comparison page offers one perspective to evaluate critically alongside product documentation and current proposals. A vendor’s marketing comparison should never replace tests using the buyer’s own workflows.
10. Build Reliable SKU Profitability Analysis and Reconciliation
A reporting process needs clear owners as much as it needs software. Finance should define approved accounting costs and reconciliation controls. Purchasing should maintain supplier and receipt information. Ecommerce and warehouse teams should verify transactions originating in their systems. Without this division of responsibility, a unified database can still contain inconsistent records.
10.1. Standardize SKU Identifiers and Data Sources
Begin by identifying the authoritative product master. Map variants, bundles, discontinued items, and alternate marketplace codes to controlled SKU records. Establish ownership for quantities, cost fields, sales-channel references, and fulfillment activity. When two systems disagree, the team should know which source wins and how exceptions are corrected.
A documented data dictionary is valuable. It should explain what “net sales,” “gross profit,” “contribution,” and “warehouse cost” mean. It should also record whether an amount is observed directly, imported from another system, or allocated through a model.
10.2. Reconcile the Product Report to the General Ledger
First, compare SKU-level revenue to the corresponding accounting sales balances for the same entity and period. Next, reconcile product COGS to posted accounting COGS. Investigate missing products, timing differences, credit notes, returns, and late cost adjustments. Only after those totals reconcile should the team build the bridge to managerial contribution expenses.
Contribution allocations need their own checks. For example, total marketplace fees assigned to SKUs should tie back to the source settlement records, subject to documented exclusions and timing rules. This makes the resulting report explainable during pricing reviews and finance close meetings.
10.3. Make the Dashboard Useful to Buyers and Operators
A focused dashboard should show net sales, units sold, COGS, gross profit, contribution profit, and margin rates. It should allow comparisons by product family, channel, and customer where data supports them. Add warehouse-level views only when the costing and expense-allocation rules are understood.
Managers should be able to explain why a margin moved rather than merely notice the movement. A change might reflect new supplier pricing, higher shipping charges, markdowns, or an unusual returns pattern. SKU profitability analysis becomes valuable when those explanations lead to purchasing, pricing, and process decisions.
10.4. Separate Preliminary Monitoring From Final Monthly Results
Ecommerce teams may need frequent operational estimates. Finance generally needs a reconciled period-end view. Use labels that distinguish provisional margins from finalized results, and document the date through which costs and settlements have been processed. This avoids unnecessary disputes when figures change after close.
11. Common Mistakes in Product Margin Reporting
The largest mistakes are often conceptual rather than mathematical. Teams may add together costs with incompatible definitions, trust outdated unit prices, or assume every allocated expense is a directly observed charge. Better reporting starts by challenging those assumptions.
11.1. Ranking Products Only by Revenue
A high-revenue item may have weak contribution after fulfillment, promotions, and returns. Review total contribution dollars and margin rates alongside sales growth. Otherwise, marketing and purchasing decisions can favor volume that does not improve the business’s economics.
11.2. Using Static Supplier Prices for Historical COGS
The latest supplier quote is not necessarily the recorded cost of units sold. FIFO, weighted-average costing, landed-cost adjustments, and inventory corrections can produce different numbers. Use the approved accounting method for historical gross profit and label replacement-cost forecasts separately.
11.3. Treating Allocations as Exact Observations
An order-level carrier charge may be directly known, while the cost assigned to one line in a multi-item order may be estimated. Advertising can be even harder to assign. Document the method and test whether a different allocation would change decisions. False precision makes SKU profitability analysis less trustworthy.
11.4. Assuming ERP Eliminates Every Reconciliation Task
Connected systems can reduce duplicate entry and improve transaction traceability, but they do not remove the need for financial controls. People still need to review cutoffs, exceptions, cost adjustments, and data quality. A successful implementation strengthens those processes instead of hiding them behind automated reporting.
12. Practical Next Steps for Stronger SKU Profitability
The purpose of product-level reporting is not to produce another dashboard. It is to make better decisions about pricing, purchasing, replenishment, channel strategy, and fulfillment. The most useful next step is to prove that a small set of actual transactions can be explained end to end.
12.1. Audit a Representative Group of Products First
Select high-volume items, low-margin products, imported goods, bundles, and returned orders. Trace net sales, inventory COGS, selling fees, fulfillment, and other attributable expenses. Reconcile the core totals to accounting and record which inputs are missing or estimated. This exercise identifies whether the problem is a process gap, an integration gap, or a broader software limitation.
12.2. Match the System to Operational Complexity
Keep accounting software when its controls and supporting applications produce reliable results. Consider specialized tools when the missing information is narrow. Evaluate ERP when purchasing, inventory, warehouse activity, and accounting repeatedly require manual reconciliation. For growing inventory-driven businesses, Xorosoft can be included among the platforms assessed against actual requirements.
Before making a commitment, ask every shortlisted vendor to reproduce the same SKU profitability analysis from real invoices, receipts, orders, refunds, and fees. The system that explains the numbers clearly and supports the required workflows is more useful than one offering the longest feature list.
Book a Personalized Demo
If disconnected inventory and accounting processes are making product margins difficult to trust, contact the Xorosoft team to discuss the specific transactions, integrations, and reporting requirements involved. A focused evaluation should show where costs originate, how they reach the financial records, and what the business can confidently act on.
Frequently Asked Questions
What is SKU profitability analysis?
SKU profitability analysis measures revenue and attributable costs for each stock-keeping unit, helping businesses compare gross and contribution margins before making pricing or purchasing decisions.
Can accounting software calculate profit by SKU?
Yes. Many accounting tools report product sales and COGS. Additional shipping, marketplace, and fulfillment costs may require integrations or a separate profitability model.
When is ERP better than accounting software for SKU margins?
ERP may help when purchasing, warehouse movements, inventory valuation, and financial records need consistent traceability across several sales channels or locations.
Which costs should SKU profitability include?
Start with net sales and COGS. For contribution profit, include attributable selling fees, outbound shipping, fulfillment, returns, and marketing without counting any cost twice.
How do landed costs affect SKU profit?
Qualifying inbound freight and duties increase inventory cost and eventually COGS. Applying them consistently improves gross-margin accuracy and avoids understating acquisition costs.
Can Shopify show profit by product variant?
Shopify provides variant-level gross-profit reporting when cost data is recorded. Fully loaded contribution margins may require additional fee and fulfillment information.
How can businesses verify SKU profit reports?
Reconcile SKU sales and COGS to accounting, match fees to source transactions, investigate timing differences, and document allocation rules before relying on results.
Recent Posts
-
 Barcode vs RFID Inventory Tracking for Mid-Market Warehouses
-
 Inventory Optimization for Machinery and Equipment Distributors
-
 How to Update Landed Costs After a Duty or Surtax Change
-
 ERP Renewal Benchmarks 2026: Increases, Notice Periods and Switching Time
-
 Why Free-Shipping Rules Hide Unprofitable Fulfillment Decisions