To better understand ecommerce trends, it’s helpful to review Shopify product lifecycle benchmarks and how they impact your business.
1. Why Shopify Product Lifecycle Benchmarks Matter in 2026
A product can look successful in Shopify while quietly becoming an inventory problem. Its launch campaign might deliver an impressive sales spike, yet several sizes remain untouched. A bestseller might generate revenue but leave little contribution after shipping, returns, and advertising. Meanwhile, a declining SKU can stay published for months because nobody owns the retirement decision. These problems rarely begin with inaccurate sales totals. They begin when teams treat a product listing as a complete picture of product health.
Shopify product lifecycle benchmarks connect three questions that separate reports often leave unanswered: How effectively did we launch the product? Is it still earning its place in the assortment? What should happen to the remaining inventory when demand weakens? For inventory-driven businesses, answering them changes purchasing commitments, warehouse capacity, margin protection, and working capital.
1.1 Ecommerce Product Lifecycle Stages and Inventory Decisions
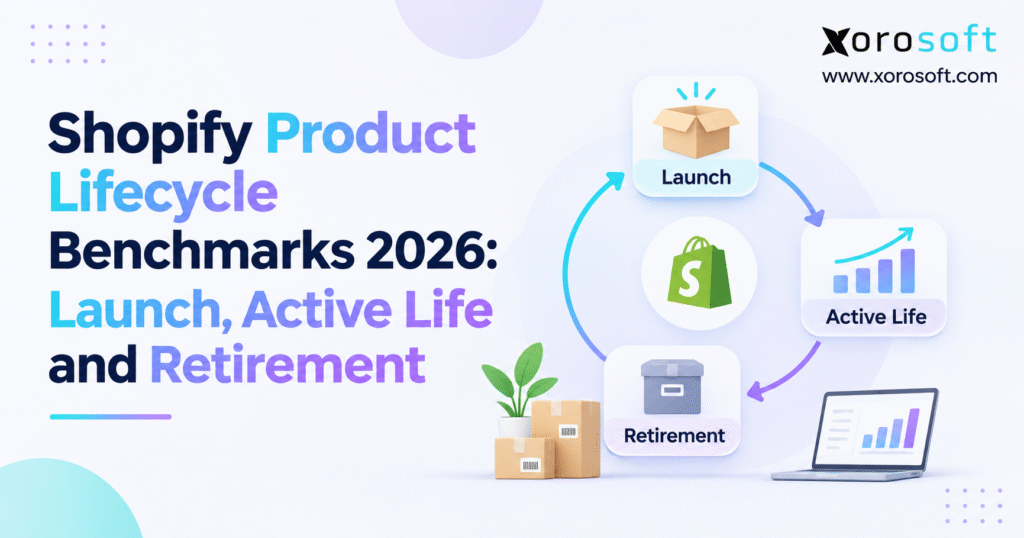
The familiar marketing model includes introduction, growth, maturity, and decline. In daily operations, it helps to organize those into launch, active life, and retirement. Launch covers readiness, publication, first orders, and early validation. Active life includes growth and maturity, when operators focus on profitable replenishment. Retirement covers controlled markdowns, discontinued purchasing, stock disposition, and final catalog treatment.
There is no defensible single 2026 average product lifespan for every Shopify merchant. A limited-edition jersey may complete its commercial lifecycle in six weeks. An evergreen replacement part may remain valuable for years. The decision should depend on comparable product cohorts, not the age of a listing alone.
1.2 Shopify Product Status Versus Lifecycle Performance
Shopify distinguishes a product’s status from the channels and markets where it is published. As Shopify’s product-status guidance explains, Active means ready to sell, Draft means not ready, Archived means no longer for sale, and Unlisted allows direct-link access while preventing normal discovery. An Active product still needs the appropriate sales-channel publication. An Unlisted product is not a private page: someone with its URL can access it, and its search visibility is restricted.
| Shopify status | Customer-facing effect | What it does not tell you |
|---|---|---|
| Active | Purchasable on channels where published | Whether the SKU is profitable or growing |
| Draft | Not available for normal purchase | Whether the product might return |
| Unlisted | Direct-link selling with restricted discovery | Whether inventory is aging or obsolete |
| Archived | No longer offered for sale | Whether all financial and warehouse obligations are closed |
Shopify product lifecycle benchmarks must therefore track operational stages separately from catalog statuses. A mature item can remain Active, while a newly introduced item can be temporarily Draft because fulfillment is not ready.
2. Shopify Product Lifecycle Benchmarks for Launch Readiness and First Sales
2.1 Shopify Product Launch KPIs: Readiness and Time to Market
Many teams calculate time to launch from the day a product record was created. That overstates delays when merchandising deliberately creates listings months before release. A better approach records the approved launch date, the actual publication timestamp, and the first date the SKU was both visible and fulfillable. Keep those events separate in the launch scorecard.
Shopify supports future publishing, but scheduled publishing requires Active status, is not supported on every channel, and cannot be scheduled independently for individual variants. The operational launch checklist should therefore verify publication, variant pricing, available stock, images, taxes, shipping restrictions, and the expected fulfillment location before promotion begins.
Use launch readiness rate to identify preventable exceptions:
Launch readiness rate = Launch-ready SKUs / Scheduled SKUs × 100.
If 45 of 50 planned SKUs pass the readiness checks, the launch-readiness rate is 90%. Investigate the remaining five before judging campaign performance. A missing size or inaccurate price is a process problem, not necessarily a demand problem.
2.2 Time to First Sale and Shopify Launch Performance
Time to first sale is the elapsed time between verified publication and the first valid order. A product published at 9 a.m. Monday and first ordered at 11 a.m. Tuesday has a 26-hour first-sale interval. However, that number says little without knowing how many qualified shoppers saw the listing. A heavily promoted product and a quietly released wholesale component should not share the same success threshold.
For each cohort, retain impressions or sessions where available, first-order time, conversion rate, initial price, traffic source, and stock availability. Look separately at time to first sale and time to the first meaningful sales volume. One employee test order or an isolated transaction does not establish a viable demand curve.
A useful launch review compares seven-day, fourteen-day, and thirty-day results against similar historical launches. If visits rise but orders do not, inspect the offer and product page. If orders arrive but fulfillment fails, examine inventory allocation and operations before changing marketing spend.
2.3 Measuring In-Stock Sales Velocity After Launch
Daily sales velocity = Units sold / Eligible selling days.
Suppose a new SKU sells 180 units in thirty calendar days but is unavailable for six of them. Its calendar-day velocity is six units; its in-stock-day velocity is 7.5 units. The difference matters for replenishment. Using only the lower figure could cause the next purchase order to understate demand, especially when the product lost selling days during its strongest launch period.
However, eligible-day velocity is not a perfect estimate of lost sales. Demand may change after promotions, and shoppers can substitute another variant. Use stockout-adjusted velocity as a diagnostic, then test it against traffic and comparable products. Good Shopify product lifecycle benchmarks distinguish observed sales from modeled demand rather than presenting a forecast as historical fact.
3. Shopify Product Launch Benchmarks: Sell-Through and Profitability
3.1 Shopify Sell-Through Benchmarks for the First 30 Days
The most useful early inventory metric is sell-through: how much inventory a product sold during a defined period relative to units sold plus remaining inventory. Shopify’s inventory reporting defines it as units sold / (units sold + ending inventory units) × 100. The selected period and inventory state must be recorded, especially if stock was replenished, returned, or transferred during the launch window.
Consider a launch cohort with 600 units available, 330 sold, and 270 remaining at the end of thirty days. Assuming no other receipts or quantity adjustments, sell-through is 330 / (330 + 270), or 55%. That rate is neither automatically good nor automatically bad. It must be interpreted against the product’s season, replenishment plan, and margin.
Shopify’s retail sell-through guidance describes roughly 70%–80% as a practical in-period reference for some assortments. Short-life seasonal drops may need more than 80% within their launch window, while 40%–60% per month or quarter can be acceptable for evergreen items if turnover and margin remain on plan. Those are contextual guidelines, not observed averages across all Shopify stores.
3.2 Product Launch Margins Beyond Revenue
An early product can have fast sell-through but disappointing economics. Suppose a SKU sells for $50 after discounts and has a $29 landed unit cost. Its simplified gross margin is 42%. If fulfillment, payment fees, advertising, and returns absorb another $17 per order, the remaining illustrative contribution is only $4 per unit before other overhead. Buying more stock solely because the product sold quickly would miss that weakness.
Use the following launch scorecard to separate operational execution from commercial demand.
| Launch KPI | Calculation or evidence | Management question |
|---|---|---|
| Ready-to-launch rate | Ready SKUs / Planned SKUs | Can the assortment launch correctly? |
| Publication delay | Actual minus planned publish time | Where did preparation slip? |
| First-sale latency | First valid order minus publication | How quickly did shoppers respond? |
| In-stock velocity | Units sold / In-stock selling days | Was demand constrained by availability? |
| Sell-through | Units sold / (Units sold + Ending units) | How much inventory has moved? |
| Gross margin | (Net revenue − COGS) / Net revenue | Is the demand economically useful? |
3.3 Replenishment Decisions Based on Launch Performance
A launch decision should consider whether the current performance can continue after early promotion. Strong margins, rising organic demand, and dependable supply may justify replenishment. When sales depend heavily on discounting, review pricing and acquisition costs before purchasing additional inventory. Repeated stockouts, on the other hand, call for an allocation review rather than a conclusion that customer demand is weak.
For Shopify product lifecycle benchmarks, document each launch decision with its underlying assumption: expected weekly demand, inbound lead time, purchase quantity, and planned review date. That record later helps explain why a successful launch became an overstock problem—or why the team missed a reorder opportunity.
CTA 1 — Free ERP Readiness Assessment: If launch reporting requires manual reconciliation among Shopify, inventory files, purchase orders, and accounting records, assess where the process needs clearer ownership before adding more products or sales channels.
4. Active-Life Shopify Product Lifecycle Benchmarks: Velocity, Turnover, and Stock Coverage
4.1 Shopify SKU Active Lifespan Versus Calendar Age
An Active product is not necessarily available every day. A variant can be out of stock, excluded from a market, or affected by a warehouse hold. Calendar age measures days since first publication; eligible selling days measure the days when the product was actually available in the relevant channel and market. Keep both measures because they answer different business questions.
A product published 180 days ago but unavailable for 24 days has a 180-day catalog age and 156 eligible selling days. Comparing its average daily sales with an always-available competitor without adjusting for availability produces a distorted demand comparison. For seasonal items, also distinguish full-price weeks from promotional weeks. Revenue generated during a clearance event should not be treated as evidence that the original price remains viable.
4.2 Inventory Turnover Benchmarks and Days of Supply
Inventory turnover = Cost of goods sold / Average inventory value at cost.
If annual COGS for a product group is $180,000 and average inventory at cost is $45,000, turnover is four times per year. That does not imply every SKU turns four times. High-performing variants may subsidize older inventory, so analyze the parent category and individual SKU levels where data quality permits.
Days of supply = Ending inventory units / Average daily units sold.
If 280 units remain and demand averages eight units per day, estimated stock coverage is 35 days. When supplier lead time is 42 days and the business needs another seven days of safety coverage, that item faces replenishment risk despite appearing well stocked. Conversely, 35 days may represent excessive supply for an event-based item with only two selling weeks remaining.
Xorosoft’s XoroONE cloud ERP connects inventory, purchasing, warehouse activity, and accounting, which can help inventory-driven businesses review stock coverage alongside open purchase commitments and costs rather than relying on storefront sales alone.
4.3 SKU Profitability and Inventory Investment
Gross margin, contribution, return rate, and stockout frequency should sit beside turnover. A high-turnover item with expensive returns can contribute less than a slower SKU purchased at favorable terms. Similarly, allocating scarce storage space to bulky low-margin products may crowd out more valuable inventory, even if their sales are steady.
Use consistent costing rules. Landed costs may include freight, duties, and other allowable acquisition costs, while marketing and fulfillment costs belong in an explicitly defined contribution model. Do not mix COGS and selling expenses without labeling the resulting margin. When comparing channels, include channel-specific costs and returns. Shopify product lifecycle benchmarks become far more actionable when planners know not just what sold, but what the sale left behind.
5. Shopify Product Lifecycle Benchmarks and the 2026 Reporting Changes
5.1 Shopify Inventory Reporting: October 2026 Quantity Change
From October 1, 2026, Shopify’s inventory reports measure stock using On hand quantity rather than Available quantity. Historical inventory values from before that date retain the old Available basis. On hand includes Available, Committed, and Unavailable units at a location, but excludes Incoming units that are not yet received. This is a reporting-method change, not evidence that the warehouse suddenly gained stock.
Imagine a location with 700 available units, 220 committed units, and 80 unavailable units. It has 1,000 on hand, although only 700 are currently available to sell. Comparing a September report using Available with an October report using On hand could suggest inventory growth when physical stock is unchanged. Analysts must label the basis before comparing inventory levels, cover, or sell-through trends.
Shopify’s inventory-report documentation also notes that product variants need inventory tracking enabled to appear in stock-based reports. Enabling tracking later does not recreate every missing historical snapshot. Reliable Shopify product lifecycle benchmarks depend on measurement continuity, not simply downloading more data.
5.2 Shopify ABC Analysis, Sell-Through and Stock Coverage
Shopify’s ABC analysis assigns grades by each variant’s revenue contribution over the previous 28 days: A-grade variants collectively contribute about 80%, B-grade the next 15%, and C-grade the final 5%. Those percentages describe revenue share, not the proportion of products. Item costs are not part of the ABC grading calculation, so an A-grade SKU can still have weak margins.
The product sell-through report uses the most recent available 30-day period and usually has an approximately two-day processing delay. Days of inventory remaining uses the average daily sales rate from the previous 28 days. These differences matter because a dashboard that mixes windows without labeling them can produce contradictory-looking results.
| 2026 reporting detail | Interpretation risk | Recommended practice |
|---|---|---|
| On hand replaced Available on October 1 | Apparent stock changes across periods | Label quantity basis and avoid unadjusted comparisons |
| ABC uses 28-day revenue share | High revenue mistaken for high margin | Review COGS and contribution separately |
| Sell-through uses available 30-day data | Current sales compared with lagged stock | Display reporting cutoff dates |
| Stock remaining uses 28-day sales pace | Coverage appears inconsistent with other windows | Preserve the denominator and time window |
5.3 Shopify Analytics Session Changes and Deleted Product Records
Shopify rolled out updated session measurement during September 21–23, 2026. Sessions became based on continuing customer activity rather than ending at midnight UTC, and identified bot sessions are filtered by default in relevant reports. Session and conversion metrics can therefore shift without a matching change in orders or demand. Review the Shopify session-measurement explanation before comparing launches across the rollout.
Retirement creates another data risk. Shopify notes that inventory reporting for deleted products or variants depends on deletion date; items deleted after January 14, 2026, stop appearing in relevant inventory data beyond the deletion date. Export or preserve the records your business needs before deleting product records. This is particularly important for long-running lifecycle comparisons, audits, and retrospective purchasing reviews.
6. Shopify Product Retirement Benchmarks: Demand Decline, Aging Stock and Recovery
6.1 Shopify Inventory Aging Metrics and Demand Decline
Product decline is rarely a single bad month. A more convincing signal combines falling unit velocity, a growing stock balance, shrinking full-price sell-through, and reduced margin. Compare like-for-like selling periods and distinguish poor availability from weak demand. A product that sold less because it was unavailable should not automatically enter a retirement queue.
Two useful leading indicators are days since last sale and inventory aging. Days since last sale measures demand inactivity; inventory aging measures how long units have been physically held. They are not interchangeable. A newly received batch can belong to an old product, while a recent sale may have consumed one unit from inventory that has been stored for months.
Aged inventory share = Cost of units older than the selected threshold / Total inventory cost × 100.
If stock worth $24,000 exceeds a company’s chosen aging threshold out of $120,000 of inventory at cost, the aged share is 20%. The threshold should vary by category. Ninety days may be concerning for a fashion drop but normal for a specialist replacement component.
6.2 Product Retirement Costs and Inventory Recovery
Consider 450 units left at a historical unit cost of $22. Their book cost is $9,900. A clearance plan expects 300 units to sell for $28 each and the remaining 150 to be liquidated for $9 each. Gross recovery would be $8,400 plus $1,350, or $9,750. After $900 in additional selling and liquidation costs, estimated recovery is $8,850, which is $1,050 below historical cost.
This is a planning example, not a complete accounting write-down calculation. Accounting treatment depends on the reporting framework, recognized costs, and reliable net-realizable-value estimates. The principle in IAS 2 Inventories is that inventory is measured at the lower of cost and net realizable value under IFRS. Businesses using other accounting frameworks should apply their applicable guidance.
Managers should also consider unpaid supplier commitments, returns, customer warranties, and the storage cost of waiting for a better clearance price. Ending sales may reduce future losses, but it does not eliminate obligations attached to already purchased inventory.
6.3 Shopify Archived Versus Unlisted Products: Retirement Options
A product should not be deleted simply because demand has weakened. If it may return next season, leaving a controlled catalog record or archiving it may be more useful. If direct-link purchasing remains necessary for a warranty component or bundle, Unlisted may be appropriate, although merchants must review channel limitations and indexing consequences. An Unlisted product receives noindex and nofollow directives and is removed from Shopify’s sitemap.
| Business condition | Operational decision | Potential Shopify treatment |
|---|---|---|
| Healthy contribution and repeat demand | Continue replenishment | Active and published |
| Declining velocity with manageable stock | Reduce buying or test price | Usually Active |
| Limited access needed for specific buyers | Restrict discovery and validate channel rules | Consider Unlisted |
| Sales ended but records should remain | Stop purchase orders and preserve history | Archived |
| Permanent removal approved | Export required data and evaluate redirects | Delete only after checks |
When a product URL is removed, use a relevant replacement page where possible rather than redirecting everyone to the homepage. Shopify’s URL redirect guidance explains that native redirects generally apply to broken URLs, not pages that still serve valid content. Search traffic, backlinks, and customer expectations deserve attention before removing product pages.
6.4 Multi-Warehouse Inventory Disposition Before Retirement
A discontinued SKU may still have inventory spread across warehouses, 3PL locations, returned-goods areas, and quality-control holds. Before approving disposal or liquidation, reconcile on-hand, available, committed, and unavailable quantities. Then confirm pending orders, transfers, and open receiving documents. This prevents a team from liquidating stock already promised to customers.
Xorosoft’s warehouse-management capabilities cover receiving, put-away, picking, packing, shipping, barcode scanning, and real-time inventory tracking. Those functions can support accurate physical disposition, although the business must establish its own retirement approval rules. Product retirement ends only when inventory, purchasing, financial records, and customer-facing availability agree.
7. Shopify Product Lifecycle Benchmarks by Industry and SKU Type
7.1 Seasonal SKU Benchmarks for Apparel and Sporting Goods
For apparel, footwear, and sporting goods, the sellable season can be shorter than the replenishment lead time. A high sell-through rate late in the season may not justify another order if the delivery would arrive after peak demand. Size and color curves can also hide overstock. A parent product may look healthy while uncommon variants accumulate aged inventory.
Compare launch cohorts by season, assortment role, price band, and promotional exposure. Review full-price sell-through before markdowns, then measure clearance recovery separately. Products tied to events or limited releases may require an explicit retirement date agreed before the first unit is ordered. These are category-specific operating targets, not universal Shopify product lifecycle benchmarks.
7.2 Wholesale and Furniture Inventory Lifecycle Metrics
Furniture can have high unit costs, substantial storage needs, and longer supplier lead times. A dining table that sells twice each month may be healthy if gross margin, carrying cost, and reorder economics support it. Wholesale products may also sell in infrequent large batches against known account demand. Daily velocity alone would understate their business value.
Use customer-order commitments, available-to-promise stock, inbound supply, and inventory value when reviewing those items. A product that represents a small share of order count can still anchor an important customer relationship. Conversely, a large order may temporarily inflate revenue and make a repeat purchase seem safer than it is.
7.3 Food and Manufacturing Product Retirement Risks
Food and beverage inventory must consider shelf life, lot status, and possible quality restrictions. Manufacturing products may depend on shared raw materials, assemblies, packaging, and work orders. Retiring a finished SKU can strand components that will not sell independently. As a result, a retirement review may need a bill-of-materials impact assessment as well as a storefront status update.
| Product group | Leading lifecycle concern | KPIs to emphasize |
|---|---|---|
| Apparel and footwear | Season-end leftovers and variant imbalance | Full-price sell-through, size-level aging |
| Sporting goods | Event or weather-linked demand | Launch velocity, stock remaining by season |
| Furniture | High carrying cost and long lead times | Inventory value, coverage, contribution |
| Wholesale | Large and intermittent orders | Account demand, committed stock, reorder economics |
| Food and beverage | Expiration and lots | Remaining shelf life, aged stock, traceability |
| Manufacturing | Obsolete components and open work | Component exposure, production commitments |
Xorosoft publishes industry-specific ERP information across distribution, consumer goods, and manufacturing. The operational takeaway is broader than software selection: benchmark each product against peers with similar selling and replenishment constraints.
8. Shopify SKU Lifecycle Management: Native Reports, Spreadsheets or ERP?
8.1 Choosing a Shopify Product Lifecycle Reporting Model
Small stores with a manageable assortment can often begin with Shopify reports and a controlled spreadsheet. They can track launch cohorts, monthly sell-through, basic margins, and planned retirement dates without replacing their systems. The limitations become clearer when purchasing, warehouse availability, landed costs, and wholesale orders live elsewhere. Exporting separate files introduces timing differences and makes it harder to explain why a stock or profit figure changed.
| Approach | Appropriate operating context | Limitation to manage |
|---|---|---|
| Shopify-native reporting | Straightforward ecommerce catalogs | Procurement and full cost context may sit elsewhere |
| Spreadsheets plus Shopify | Small teams testing custom lifecycle rules | Reconciliation and change control |
| Specialized connected apps | A specific forecasting or stock workflow | Overlapping data owners and integration maintenance |
| Integrated ERP with Shopify | Multiple warehouses, channels, purchasing and finance | Implementation planning and governance |
Xorosoft’s ERP offering brings accounting, inventory, warehousing, manufacturing, and order management into a connected environment. That model becomes relevant when teams need consistent operational decisions across several functions; it is not a substitute for agreeing on meaningful benchmarks first.
8.2 Assigning Ownership to Product, Inventory and Cost Data
Before integrating systems, decide where product IDs, selling prices, publication status, inventory availability, purchase orders, landed costs, and financial transactions are controlled. Shopify usually remains central to storefront presentation and online selling, while an ERP or inventory system can own purchasing and warehouse quantities. The exact ownership model varies, but duplicate authority creates avoidable errors.
For example, archiving a product page must not silently cancel a customer’s open order. A purchase restriction should not alter historical financial transactions. A warehouse adjustment must not be treated as new customer demand. Design the data flow around those rules, then test exceptions such as returns, partial receipts, and discontinued variants.
The Xorosoft ERP app on the Shopify App Store describes integration of products, prices, inventory, orders, fulfillment, and payment-related information. Verify its suitability for your store configuration and desired sync ownership before implementation. The practical test is whether a lifecycle decision stays consistent across systems without introducing conflicting records.
CTA 2 — Watch Demo: When decisions depend on Shopify sales, multiple stock locations, supplier commitments, and accounting results, evaluate a connected workflow with realistic sample products and exception cases rather than a generic feature checklist.
9. Build a 30-Day Shopify Product Lifecycle Benchmark Scorecard
9.1 Shopify Product Lifecycle Scorecard: Cohorts and Formulas
Begin with fifty representative SKUs, including a recent launch, several evergreen products, and likely retirement candidates. Week one establishes lifecycle stage definitions, available data, and the person accountable for each decision. Week two reconciles SKU identities, order dates, receipts, stock states, and unit costs. In week three, calculate metrics using fixed cutoffs; week four is a structured review of replenishment and retirement actions.
Consider three illustrative thirty-day SKU records with no receipts or adjustments during the period. A seasonal item sells 300 units and ends with 100, giving 75% sell-through and ten days of supply at ten units a day. An evergreen item sells 140 and ends with 210: 40% sell-through and 45 days of supply. A slowing item sells 15 and ends with 285: 5% sell-through and 570 days of supply at the recent sales pace.
The slowing item deserves investigation, but the scorecard alone should not decide its fate. Its future orders, margin, supplier terms, replacement availability, and possible seasonal demand matter. A decision log should capture the evidence and date for each approved action.
9.2 Operational Review Cadence for SKU Lifecycle Performance
The weekly review can flag sudden stockouts, poor launch execution, and unexpected velocity changes. Monthly meetings should address stock investment, contribution margin, aging, and products recommended for discontinuation. In every meeting, name an action owner and an expected follow-up date; otherwise a dashboard becomes an archive of unresolved exceptions.
Xorosoft’s integration ecosystem connects ecommerce, warehouses, payments, and operational systems, offering a way to reduce fragmented reporting when a business grows beyond manual exports. Even with connected systems, Shopify product lifecycle benchmarks need documented definitions and periodic reconciliation.
10. Common Shopify Product Lifecycle Benchmarking Mistakes
10.1 Avoid Universal Sell-Through and Turnover Targets
A single sell-through target cannot fairly grade every SKU. Seasonal apparel, furniture, food, and industrial components carry different risks. Even two products in the same category may have different lead times, promotion levels, and customer commitments. Use comparable launch cohorts and segment by product role. Document whether a threshold is a company’s internal target, an illustrative example, or a verified external reference.
Similarly, a high inventory turnover figure can hide frequent stockouts. A profitable product can look weak during a temporary supply interruption. Analyze availability, lead times, returns, and margin before interpreting sales alone. This discipline prevents merchants from retiring good items or replenishing weak ones for the wrong reasons.
10.2 Preserve Shopify Lifecycle Data Across Reporting Changes
The date a Shopify product listing was created is not necessarily its first sellable day. Historical inventory comparisons must account for Shopify’s October 2026 reporting changes. Similarly, conversion trends around the September session measurement update require careful interpretation. Before permanently deleting retired SKUs, preserve the records needed for purchasing, accounting, and historical performance analysis.
Treat Shopify product lifecycle benchmarks as a controlled management dataset. Keep versioned definitions of metrics, record manual adjustments, and confirm which stock states are included. Accurate decisions depend on knowing what each figure means—not simply having more metrics.
11. Putting Shopify Product Lifecycle Benchmarks into Action
11.1 Prioritize Shopify Launch, Maturity and Retirement Decisions
At the next monthly product review, select one recently launched cohort, one mature category, and a group of aging SKUs. Evaluate new launches for replenishment readiness, pricing improvements, and operational gaps. Mature products require closer examination of contribution margins and target inventory coverage. Meanwhile, aging stock should undergo a review of supplier commitments, expected recovery value, and retirement options.
Assign an owner to each decision and revisit the result in thirty days. This closes the gap between analytics and action. Shopify product lifecycle benchmarks are valuable precisely because they reveal when the business should change its next purchase order, not merely how its previous sales performed.
11.2 Connect Product Decisions to Inventory and Finance
The most effective lifecycle process leaves a traceable decision across merchandising, purchasing, warehouse operations, and accounting. Teams should know which products are entering the catalog, which deserve continued investment, and which need a controlled exit. That discipline protects availability, working capital, and margin without inventing an average product lifespan that cannot fit every business.
CTA 3 — Book a Personalized Demo: If disconnected systems make these decisions difficult, Xorosoft can help you evaluate how cloud ERP, inventory management, purchasing, warehousing, and accounting fit your Shopify operating model. Book a personalized demo to discuss the workflows and reporting requirements specific to your business.
Frequently Asked Questions
What are Shopify product lifecycle benchmarks?
They measure launch readiness, sales velocity, sell-through, inventory coverage, margins, and retirement risk across comparable SKUs. Targets should reflect category, seasonality, and replenishment lead times.
How do you measure a Shopify product launch?
Track readiness, time to first sale, in-stock velocity, thirty-day sell-through, and margin. Compare each result with comparable launches rather than a universal target.
What is a healthy Shopify sell-through rate?
Shopify discusses 70%–80% for some assortments, but targets vary by season, product type, and reporting period. Evergreen items may justify slower in-period turnover.
How is Shopify inventory turnover calculated?
Divide cost of goods sold by average inventory value at cost for the same period. Also review stockouts, margins, and supplier lead time.
When should a Shopify product be retired?
Review retirement when demand weakens, stock ages, or margins fall. Check outstanding orders, supplier commitments, and expected recovery value before changing the listing status.
Archived versus Unlisted: what is the difference?
Archived products cannot be purchased. Unlisted products can remain available through direct URLs without normal storefront discovery. Neither status completes the financial inventory-retirement process.
How does ERP help manage Shopify product lifecycles?
ERP can connect inventory, purchasing, warehouse records, and accounting with ecommerce orders. Clear ownership of each record supports consistent replenishment, valuation, and retirement decisions.
Recent Posts
-
 Container Dwell Benchmarks 2026 for US and Canadian Distribution Centers
-
 How to Audit Open Shopify Shipments for Quantities That Will Never Arrive
-
 Sales Commission Software for Apparel Showrooms and Rep Agencies
-
 In-House ERP Administrator vs Managed ERP Support
-
 Shop-Floor Inventory Software for Batch and Process Manufacturers