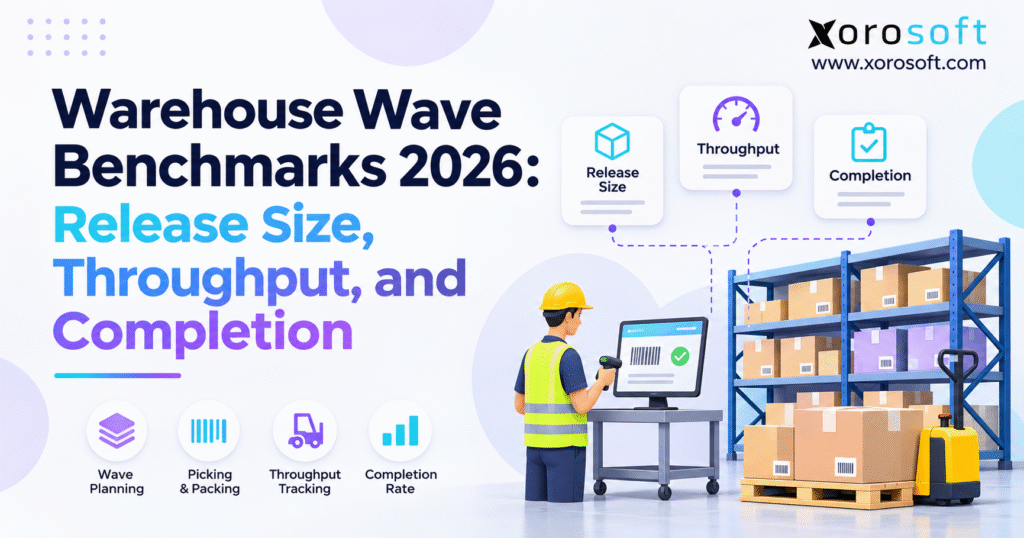
To make informed decisions and improve operations, it is essential to understand warehouse wave benchmarks.
1. Why Fast Picking Still Leads to Late Warehouse Waves
A warehouse can pick thousands of items during a busy shift and still miss its shipping deadlines. Workers may finish picking on time, but orders remain at packing stations. Boxes fill the staging area, shipping labels are delayed, and the last carrier pickup is getting closer.
The problem is not always slow workers. In many cases, warehouse teams release more orders than they can pick, pack, and ship within the time they have.
Warehouse wave benchmarks help managers find the right balance between order release size, picking speed, and on-time completion. Instead of measuring how much work enters the warehouse, these benchmarks show how much work moves through the full shipping process.
This matters for ecommerce brands, wholesale distributors, and businesses that manage orders across several warehouses. As order volumes grow, poor wave planning can lead to late shipments, higher labor costs, and more order errors.
What warehouse wave planning means
A warehouse wave is a group of orders or picking tasks released together for warehouse staff to process.
Warehouse managers can group orders by shipping deadline, carrier, warehouse zone, customer need, or product type. Once a wave is released, workers follow the assigned tasks to pick the required items.
For example, a warehouse may release 150 orders at 9:00 a.m. and another 200 orders at 11:00 a.m. Each group becomes a wave with its own workload and target finish time.
The goal is to release enough work to keep employees busy without creating long queues at packing and shipping.
Why large waves can slow down shipping
Large waves can help workers pick similar items together. However, they can also create problems when packing stations or shipping areas cannot keep up.
A warehouse may finish picking 300 orders but have room to pack only 180 during the same period. The other 120 orders must wait.
As more waves enter the building, these delays grow. Workers spend extra time sorting orders, moving boxes, and finding space.
Strong warehouse wave planning focuses on the full order flow, not just picking speed. Every release should match the amount of work the warehouse can finish before its deadline.
2. Warehouse Wave Benchmarks 2026: What the Data Shows
Warehouse managers often ask how many orders should go into one wave or what a good picking rate looks like.
There is no single answer that works for every warehouse. A business shipping small clothing items has different needs from one handling furniture, heavy goods, or large wholesale orders.
Still, current warehouse research offers useful clues about labor, shipping delays, and the value of tracking work.
What the 2026 warehouse research tells us
The WERC DC Measures report for 2026 covers 36 warehouse measures. The report also found that 48.6% of respondents named cost reduction as their main business goal.
This shows why warehouse teams need to look closely at labor use, order flow, and shipping costs.
The 2026 Warehouse/DC Operations Survey provides more insight. Based on 119 qualified responses, it found that 31% of respondents named the shipping dock as their most crowded warehouse area.
The survey also reported that 59% used a warehouse management system to collect work-rate data, while 77% tracked on-time shipping.
These findings show that picking is only one part of warehouse performance. Work can move quickly through picking and still face delays near the shipping dock.
Why warehouse wave benchmarks need local data
Published figures are useful, but they cannot tell a manager the ideal wave size for a specific building.
Each warehouse has different staffing levels, order types, product sizes, storage layouts, and shipping deadlines.
For example, a warehouse handling mostly single-item orders may process more orders per hour than a site that picks large cases. That does not always mean its workers are more skilled or its process is better.
A sound approach is to compare similar orders within the same warehouse first. Then use industry data to understand how those results fit into wider trends.
Warehouse wave benchmarks become more useful when the team measures its own work over several weeks instead of relying on a general target.
3. Warehouse Wave Release Size: How Much Work Should You Release?
Release size is one of the most important parts of wave planning.
A release that is too small can leave workers with little to do. A release that is too large can fill picking lanes, packing stations, and staging areas with unfinished work.
The right size depends on how much work the warehouse can finish within a set period.
Calculate picking capacity before releasing a wave
Start by measuring how many lines workers can pick during the available time.
The basic formula is:
Picking capacity = Number of pickers × Lines picked per hour × Available hours
Suppose a warehouse has five pickers. Each worker can pick 55 lines per hour, and the team has two hours available.
Picking capacity = 5 × 55 × 2
Total picking capacity = 550 lines
Now assume each customer order has an average of 2.5 picking lines.
550 ÷ 2.5 = 220 orders
Under these conditions, the picking team could handle about 220 orders during the two-hour window.
However, this calculation only covers picking. The warehouse must also check packing and staging capacity.
Compare picking, packing, and staging limits
Consider this sample warehouse:
| Warehouse activity | Two-hour capacity |
|---|---|
| Picking | 220 orders |
| Packing | 240 orders |
| Staging | 180 orders |
| Lowest capacity | 180 orders |
In this example, staging is the main limit.
Even though workers can pick 220 orders, the staging area can hold only 180 orders at once. The example assumes no staged orders leave during the two-hour period.
Releasing more than 180 orders could create a space problem.
Apply a practical safety allowance
Warehouse work rarely follows the plan perfectly. Workers may need to refill pick locations, check damaged products, or fix order errors.
A safety allowance gives teams room to handle these delays.
For example, assume the manager uses a 10% allowance:
Planned wave size = 180 × 0.90 = 162 orders
The planned wave would contain about 405 picking lines.
This 10% allowance is only an example. It is not a published industry rule. Each warehouse should set its own allowance using past delays and actual work records.
Check the result against available labor
At 55 lines per picker-hour, 405 lines require about 7.36 hours of total picker work.
Five workers have ten combined working hours during a two-hour window.
The planned release therefore fits within the available picking time.
Packing also has enough room under the stated rates. Staging remains below its 180-order limit.
However, the manager must still check the order in which work reaches each station. A wave can fit the total capacity and still miss a deadline when too many orders arrive at packing near the end.
These checks help turn warehouse wave benchmarks into useful release rules based on real warehouse limits.
4. Warehouse Picking Throughput Benchmarks: Measure Work Correctly
Picking throughput shows how much warehouse work gets done during a set amount of time.
The problem is that teams often use different ways to measure it.
One warehouse tracks orders per hour. Another tracks picking lines. A third tracks items picked. These figures may all be useful, but they do not measure the same work.
Calculate picking lines per labor hour
One of the clearest ways to track picking output is to measure completed lines against direct picking hours.
Lines per labor hour = Completed picking lines ÷ Direct picking labor hours
Suppose six workers complete 1,440 picking lines during a shift.
Together, they spend 24 hours on direct picking work.
1,440 ÷ 24 = 60
Picking rate = 60 lines per labor hour
This number helps managers compare how work changes across shifts.
However, the time counted must stay the same. If one shift includes walking and waiting time while another does not, the results will not be fair.
Understand the difference between orders, lines, and units
An order can contain one item or many items. A picking line may also contain several units of the same product.
For example, one order may contain three lines with ten total units.
That order counts as one order, three lines, and ten units.
Using only orders per hour can hide the extra work needed for orders with many products.
A better warehouse report tracks at least two measures, such as lines per labor hour and ready-to-ship orders per hour.
Why faster picking does not always mean faster shipping
Imagine that the picking team raises its output from 60 to 70 lines per hour.
That seems like a clear improvement. However, if packing stations cannot handle the extra work, orders may wait longer before shipping.
The picking team becomes faster while the full order process becomes slower.
Managers should therefore compare picking rates with packing output, staging queues, and shipping deadlines.
Warehouse wave benchmarks should help the warehouse finish more orders correctly, not simply increase the number of pick scans.
5. Warehouse Wave Completion Benchmarks: What Counts as Finished?
A major problem with warehouse reports is that teams often use different meanings for the word “complete.”
Picking staff may mark a wave as complete when the last item is picked. The packing team may still have dozens of open boxes. Shipping staff may not consider the wave finished until all orders are ready for the carrier.
Without clear rules, managers can report good completion results while customers receive late shipments.
Track each stage of wave completion
| Work stage | What it means |
|---|---|
| Pick complete | All required picking tasks are finished |
| Pack complete | Products are checked, packed, and labeled |
| Stage complete | Orders are placed in the correct shipping area |
| Ready to ship | Orders meet the required shipping checks |
These stages should have separate time records.
A warehouse may meet its picking target but miss its ready-to-ship deadline. Tracking both results helps managers find where the delay started.
Calculate on-time wave completion rate
The formula is:
On-time completion rate = Waves completed by deadline ÷ Waves due × 100
Suppose a warehouse has 20 waves due during a shift.
Eighteen waves reach the required ready-to-ship stage before their deadlines.
18 ÷ 20 × 100 = 90%
On-time completion rate = 90%
This is an example, not a recommended target for every warehouse.
The warehouse must also count late and unfinished waves. Removing those waves from the report would make the results look better than they are.
Measure how long each wave takes
Wave cycle time shows the time between the release of work and the selected finish point.
Wave cycle time = Completion time − Release time
Suppose a wave starts at 9:00 a.m. and all picking tasks finish at 11:00 a.m.
The picking cycle time is two hours.
However, if the orders are not ready to ship until 12:45 p.m., the full ready-to-ship cycle is three hours and 45 minutes.
Both figures matter.
Managers should also look at the middle result across many waves and the slower waves near the upper end of the range. A few long delays can be hidden when a report shows only an average.
Connect wave completion to carrier deadlines
Carrier pickup times should guide wave planning.
For example, a warehouse may use this schedule:
| Work stage | Planned finish | Actual finish |
|---|---|---|
| Picking | 11:00 a.m. | 11:15 a.m. |
| Packing | 11:45 a.m. | 12:05 p.m. |
| Staging | 12:15 p.m. | 12:35 p.m. |
| Ready to ship | 12:30 p.m. | 12:45 p.m. |
If the carrier arrives at 1:00 p.m., the warehouse may still make the pickup.
However, it has missed its internal ready-to-ship target by 15 minutes. It has also used half of its planned 30-minute buffer.
The wave should be marked late against the internal target even if the shipment leaves with the carrier.
This is why warehouse wave benchmarks need clear deadlines for each stage of work.
CTA #1 — Free ERP Readiness Assessment
If your team cannot track an order from stock availability to shipping readiness, it may be time to review how your systems share data. Start by checking missing time records, manual updates, and gaps between inventory and warehouse work.
6. Warehouse Bottlenecks That Affect Wave Release and Throughput
Even a well-sized wave can fall behind when one part of the warehouse slows down.
The main limit may change throughout the day. Picking might be slow in the morning because shelves need restocking. Packing may become the main issue after lunch. Near the end of the shift, the shipping dock may have the longest queue.
Managers need to find where work is building up before deciding what to change.
Watch where unfinished work starts to grow
A long queue between two work stages is often a warning sign.
For example, if picking finishes 200 orders while packing finishes only 140 during the same period, 60 orders remain in the packing queue, assuming there was no earlier backlog.
That queue may continue to grow if the next wave starts too soon.
The manager could reduce the next release, move trained staff to packing, or delay less urgent work.
The right choice depends on the cause of the delay.
A connected warehouse management system can help teams work with stock, picking, and warehouse task data. Xorosoft supports warehouse management alongside inventory and other business work, although buyers should check the exact wave tools and reports they need.
Check stock before releasing orders
An item may exist in the warehouse but not be ready for picking.
It could be reserved for another order, damaged, held for a quality check, or stored away from the active picking area.
If staff release orders without checking stock, pickers may face short picks and long waits.
Before releasing a wave, managers should check whether stock is ready in the right locations and whether urgent restocking tasks are complete.
This helps keep waves moving and reduces the time spent fixing avoidable shortages.
Track the cost of late warehouse waves
Late waves can increase overtime, extra handling, and rush shipping costs.
Suppose packing delays add three hours of paid work at $28 per hour.
The added labor cost is $84.
If the company also pays for a faster carrier service, the full cost will be higher.
These costs should be based on actual work records and shipping bills. Managers should avoid claiming savings unless they can show that labor, errors, and shipping costs truly went down.
The goal of warehouse wave benchmarks is to help teams improve service while keeping costs under control.
7. Warehouse Wave Benchmarks for Apparel, Wholesale, and Other Industries
Warehouse performance depends heavily on what a company sells.
A wave of small clothing orders may move quickly through picking and packing. A wave containing large furniture items can require more people, equipment, and floor space.
That makes industry and order type important parts of warehouse planning.
Apparel and fashion wave planning
Apparel warehouses often manage many sizes, colors, and seasonal items.
During a sale, order counts may rise sharply. Popular products can run low in active pick locations, even when more stock is stored elsewhere.
Managers should compare single-item orders with orders containing many sizes or products.
They should also track how often picking stops because shelves need more stock.
Wave size may need to change during major sales or holiday periods.
For Shopify brands, the time between order receipt, stock allocation, and physical picking should also be tracked. A delay before picking starts is not the same as a slow picking process.
Furniture and bulky goods
Furniture warehouses need a different way to measure work.
One large sofa may require two workers, lifting equipment, careful handling, and more staging space than several small packages.
Orders per hour may not give managers a fair picture of the work involved.
It can be more helpful to track crew-hours, handling time, damage checks, and space use.
A wave that contains fewer orders may still be the largest workload of the day.
Sporting goods and wholesale distribution
Sporting goods sellers may ship small items through parcel carriers while also handling large or heavy products.
Wholesale distributors may ship cases and pallets to stores or business customers.
These orders can have different labels, delivery dates, packing rules, and shipping needs.
Managers should group similar orders when reviewing wave results. A large wholesale order should not be measured in the same way as a simple online order.
Businesses across the industries served by Xorosoft can use the same core reporting method while setting different goals for each type of warehouse work.
Food and beverage warehouse waves
Food and beverage warehouses may need to track product lots, expiry dates, and special storage rules.
Picking teams may need to follow rules about which stock can ship first.
These checks can slow a wave, but they also help prevent mistakes.
Warehouse teams should track delays caused by stock holds, lot checks, and product availability.
Comparing these waves with ordinary parcel orders would not give a fair view of warehouse performance.
Good warehouse wave benchmarks reflect the real work involved rather than using one target for every product.
8. Wave Picking vs. Continuous Picking: Choosing the Right Release Method
Warehouses can release work in several ways.
Some follow fixed wave schedules. Others release tasks throughout the day. Many use a mix of both methods.
The best choice depends on order volume, shipping deadlines, staff, and the space available in each work area.
Fixed wave picking
Fixed wave picking releases groups of orders at planned times.
For example, a warehouse may release one wave at 8:00 a.m., another at 11:00 a.m., and a final wave at 2:00 p.m.
This method can make staffing and shipping plans easier.
However, urgent orders may need to wait until the next release.
Fixed waves often work well when shipping times and order types are stable.
Overlapping warehouse waves
Overlapping waves allow the next group of orders to start before the earlier wave is fully finished.
This can keep pickers busy and reduce gaps between releases.
However, managers must watch packing and staging space.
If too many waves overlap, workers may face more open tasks than they can handle.
A good overlap plan uses live workload data and limits how much unfinished work can enter each stage.
Continuous and hybrid picking
Continuous picking, often called waveless picking, releases work more often instead of waiting for large planned groups.
This can help warehouses manage urgent online orders.
However, it also needs strong rules to prevent too much work from reaching picking or packing at once.
A hybrid method uses fixed waves for planned orders and a controlled process for urgent work.
This may suit a business that handles both wholesale orders and fast-moving ecommerce sales.
Compare methods using the same measures
Managers should compare each method using on-time shipping readiness, picking labor, open work, order errors, and packing delays.
A method that raises picking speed but causes more missed deadlines is not necessarily an improvement.
The strongest warehouse wave benchmarks help teams test release methods with real results rather than choosing one because it sounds more advanced.
9. Build a Warehouse Wave Dashboard That Shows What Needs Attention
A warehouse dashboard should help managers make decisions while work is happening.
It should show more than the number of orders picked during the day.
Managers also need to see how much work remains, which waves are at risk, and where delays are starting.
Track the most useful warehouse wave KPIs
A simple dashboard can include these measures:
| Warehouse KPI | What managers learn |
|---|---|
| Orders per wave | How much order demand was released |
| Picking lines per wave | How much picking work entered the process |
| Lines per labor hour | How quickly picking work was done |
| Average wave time | How long waves take |
| On-time pick completion | Whether picking met its deadline |
| Ready-to-ship completion | Whether orders reached the shipping stage on time |
| Short-pick rate | How often stock issues stopped work |
| Open packing work | Whether packing is falling behind |
| Late waves | Which releases need help |
These figures should be shown by shift, warehouse, and order type.
A useful dashboard also shows past results so managers can tell whether performance is improving.
Use live data to catch late waves early
Suppose a wave has 300 pick lines remaining and only one hour left before its picking deadline.
If the available team can normally finish 200 lines during that hour, the wave is at risk.
The supervisor can act before the deadline is missed.
Possible actions include moving trained workers, fixing a stock issue, or changing the next planned release.
A basic warning based on remaining work and time can be more useful than a complex forecast that staff do not understand.
Compare warehouse performance fairly
When a company has several warehouses, each location may have different products, staff, and shipping needs.
One warehouse may handle simple ecommerce parcels. Another may ship large wholesale orders.
Their results should be reviewed by similar order types before being compared.
Xorosoft combines inventory, warehouse work, and reporting within a connected business system. This can help businesses bring related data together, while each company still needs to check that the reports and time records match its workflow.
A clear dashboard turns warehouse wave benchmarks into daily tools that supervisors can use to manage work.
10. Connect Warehouse Wave Planning With Shopify, Inventory, and ERP
Warehouse waves do not start with picking.
Before workers can act, orders must enter the business system, stock must be available, and the right warehouse must receive the work.
When these steps take place in separate systems, delays can be hard to find.
Track the full order journey
A customer may place an order through Shopify at 9:00 a.m.
The ERP may receive that order at 9:05 a.m. Stock may not be ready for release until 9:20 a.m.
The warehouse then starts picking at 9:30 a.m.
If picking finishes at 10:15 a.m., the pick cycle took 45 minutes.
However, the full time from order placement to completed picking was one hour and 15 minutes.
Both numbers matter, but they answer different questions.
Managers should record order receipt, stock readiness, wave release, picking, packing, and shipping events separately.
Keep stock and order records connected
When ecommerce orders, warehouse work, and inventory records do not match, teams often spend time checking spreadsheets and fixing errors.
For Shopify merchants, this can affect stock availability, order release, and shipping plans.
Xorosoft supports connected ERP, inventory, and ecommerce work through XoroERP. Its Shopify App Store listing also describes order and inventory sync features.
These links can help teams keep order and stock data aligned. However, businesses should still test how the system handles their own warehouse tasks, holds, and shipping events.
Manage waves across several warehouses
Multi-warehouse businesses may have different release times, staff levels, and carrier schedules at each site.
A wave that works well at one location may be too large for another.
Managers should track performance by site before combining the results into a company-wide report.
They should also record whether the order came from Shopify, Amazon, wholesale, or EDI.
These channels may have different shipping promises and handling needs.
Xorosoft’s integration options are relevant when teams want data from sales channels and business systems to work together. Its XoroONE platform brings core inventory, purchasing, accounting, and warehouse work into one system.
Connected data makes warehouse wave benchmarks easier to check, but good reporting still depends on clear rules and correct event records.
CTA #2 — Watch Demo
When reviewing warehouse software, ask to see how a real order moves from stock allocation to picking, packing, and shipping. Test a missing item, a canceled task, and a late order. The goal is to confirm that the system supports the reports and work rules your team needs.
11. Common Warehouse Wave Planning Mistakes That Hurt Performance
Many warehouses collect large amounts of data without using it to improve the way work is released.
The problem is often not a lack of reports. It is that teams measure the wrong things or fail to agree on what the numbers mean.
Releasing more orders to keep workers busy
A full picking queue may look like a sign of high output.
However, more open work can lead to crowded aisles, long packing queues, and missed shipping times.
Managers should release enough work to keep the main work stages moving without filling the warehouse with unfinished orders.
When packing is the slowest stage, increasing picking volume may make the problem worse.
Using average picking speed as the only target
An average can hide large delays.
For example, five waves may finish in 90 minutes while one takes more than three hours.
The average may still look reasonable, but the long wave could miss an important carrier deadline.
Managers should review late waves separately and find out what caused them.
Ignoring missing scans and incorrect records
A wave may appear late because workers forgot to scan a finished task.
It may also appear complete because a system closed the wave before all packing work was finished.
Both problems create weak reports.
Warehouse teams should check a sample of records against the actual work on the floor.
When reviewing Xorosoft or another connected warehouse system, businesses should test whether their planned setup keeps clear records of stock changes, picking tasks, order holds, and shipping events.
Reliable warehouse wave benchmarks depend on clean data as much as they depend on warehouse speed.
12. A 30-Day Plan to Improve Warehouse Wave Benchmarks
Businesses do not need to change every part of the warehouse at once.
A short review using real order data can show where the largest delays begin.
A 30-day plan gives managers enough time to collect a baseline, test one change, and decide whether it helped.
Week 1: Record current wave performance
Choose 20 recent waves with similar order types.
Record the release time, number of orders, pick lines, worker hours, packing finish time, and shipping readiness time.
Include shortages and late waves.
Then calculate picking output, average wave time, and on-time completion.
If some records are missing, fix those gaps before using the results to set new targets.
Week 2: Find the main source of delays
Review where each wave spent the most time waiting.
Look for large queues at picking, packing, staging, or the shipping dock.
Check whether stock issues caused workers to stop.
Also review the busiest hours and whether staffing matched the work released.
The goal is to find the one problem that has the biggest effect on finishing orders.
Week 3: Test one practical change
Choose one change based on the data.
For example, the warehouse could release smaller waves, move trained workers to packing, refill pick locations earlier, or adjust the time between releases.
Keep other conditions as steady as possible.
Compare the test waves with similar earlier waves.
Watch on-time readiness, labor hours, work waiting in queues, and order errors.
An improvement in one number should not come at the cost of worse shipping service.
Week 4: Set new release rules and assign owners
Review the test results and decide which changes should remain in place.
Set wave-size ranges for different order types and shifts.
Make clear who can change a release, how urgent orders are handled, and when staffing changes require a new plan.
Managers should review these rules during peak periods and when the order mix changes.
If the business still struggles to connect order, stock, and warehouse records, Xorosoft is one ERP and warehouse management option to assess against its needs.
The goal is not to buy software for its own sake. It is to make better release choices with reliable data.
13. Turn Warehouse Wave Benchmarks Into Better Shipping Results
The purpose of warehouse wave benchmarks is not to release the most orders or record the highest pick rate.
It is to help warehouse teams finish accurate orders within the time promised to customers.
A strong wave plan starts with three simple actions: measure the work, find the main capacity limit, and release only what the warehouse can finish on time.
From there, managers can track picking speed, packing queues, stock issues, and ready-to-ship results. They can use these records to improve labor plans and reduce delays before the next busy period.
The best wave size will change as order volume, staffing, product mix, and shipping needs change. That is why regular checks matter more than one fixed target.
For growing ecommerce and wholesale businesses, connected order, inventory, and warehouse data can make these checks easier. However, clear work rules and accurate records must come first.
CTA #3 — Book a Personalized Demo
If your business is dealing with late warehouse waves, stock mismatches, or weak reporting across locations, contact the Xorosoft team to review your current workflow and explore how connected ERP and warehouse management may support better shipping results.
Frequently Asked Questions
What are warehouse wave benchmarks?
Warehouse wave benchmarks measure release size, picking speed, and on-time completion. They help teams compare similar workloads and spot delays before shipping.
How many orders should be in a warehouse wave?
Base release size on the slowest stage before the shipping deadline. Check picking, packing, staffing, and staging capacity instead of following one fixed order count.
How do you calculate warehouse picking throughput?
Divide completed pick lines by direct picker labor hours. For example, 600 lines in 10 labor hours equals 60 lines per labor hour.
What is a good warehouse wave completion rate?
There is no universal target. Set goals using past results, shipping deadlines, and order mix. Then review performance by shift and warehouse.
How do you calculate on-time wave completion?
Divide waves completed by their deadline by all waves due, then multiply by 100. Include late, unfinished waves in the total.
Why do warehouse picking waves finish late?
Late waves often result from stock shortages, slow restocking, packing queues, crowded staging, or oversized releases. Use stage timestamps to find the cause.
When should a warehouse upgrade its WMS?
Consider upgrading when manual records, poor stock visibility, or missing timestamps make wave tracking unreliable. Test the system against real warehouse tasks and exceptions.
Recent Posts
-
 ERP for Nutraceutical Manufacturers Managing Formulas, Lots, and Expiry
-
 Warehouse Wave Benchmarks 2026: Release Size, Throughput, and Completion
-
 How to Design a B2B Credit-Limit and Order-Release Workflow
-
 Xorosoft vs Fulfil for Shopify Inventory and Warehouse Operations
-
 Why Unposted Production Scrap Overstates Inventory and Margin