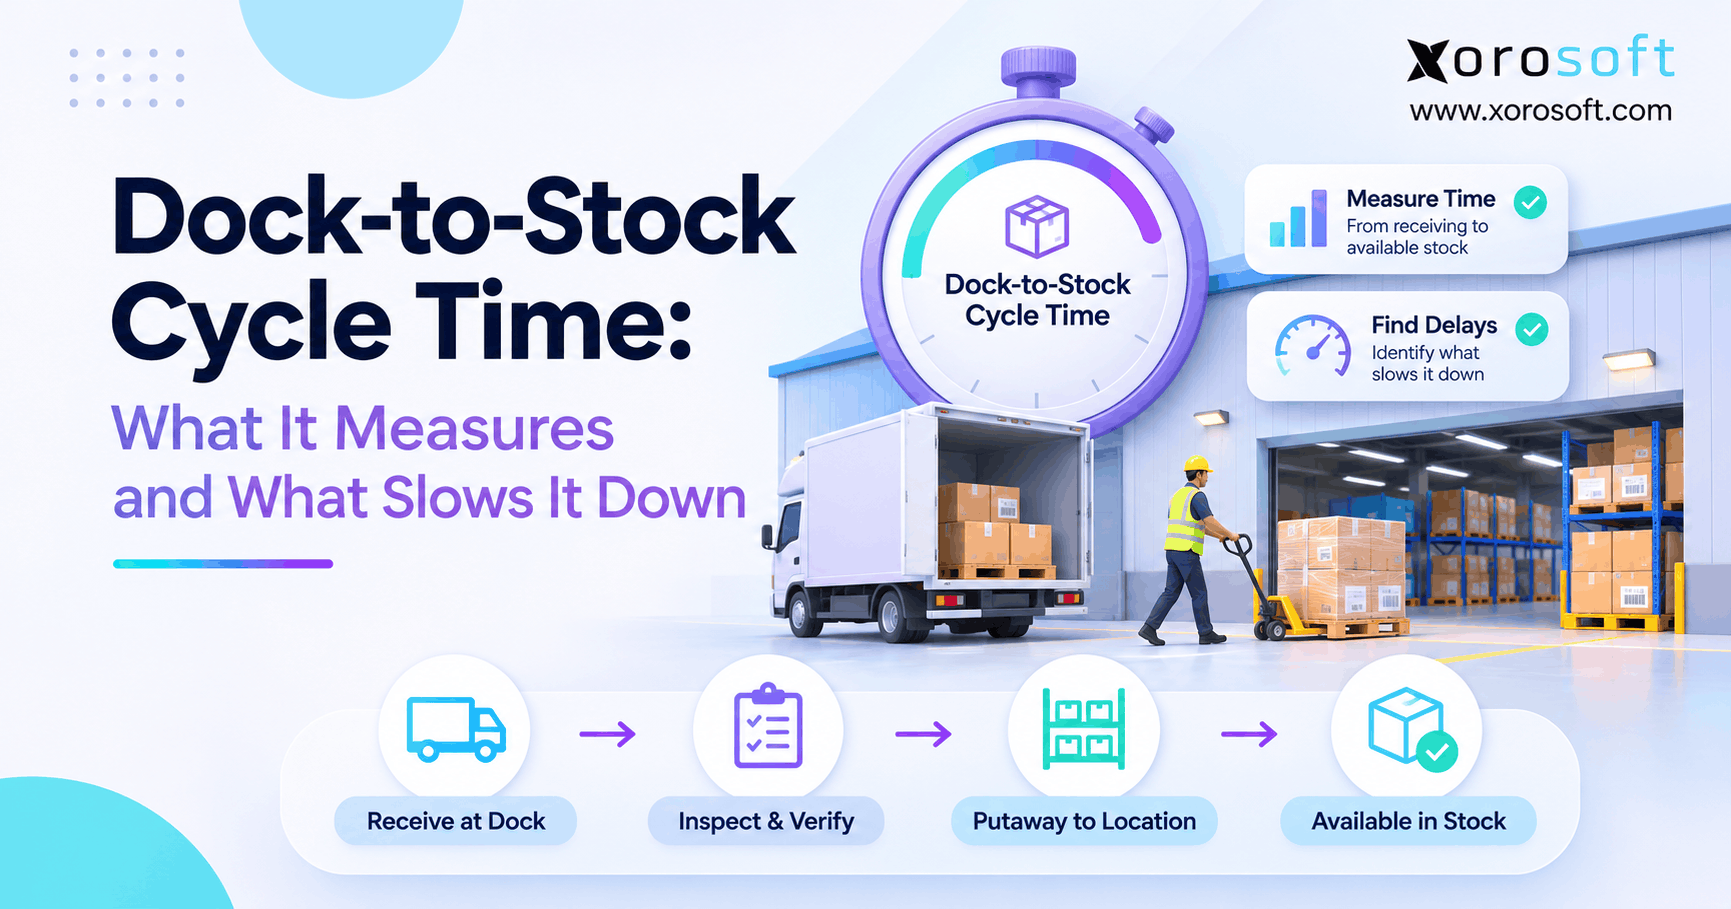
An important metric for warehouse efficiency is dock-to-stock cycle time.
1. Why Stock Arrives Before Your Warehouse Can Use It
Dock-to-stock cycle time reveals a costly gap in warehouse operations: goods may arrive at the receiving dock hours before workers can find, store, and use them. A supplier delivers a pallet at 9 a.m. The receiving team unloads it by 10 a.m. Yet an order picker still cannot access those units at 3 p.m. The shipment is physically inside the building, but the stock is not ready for normal work.
For example, buyers see a delivered purchase order. At the same time, customer service expects available stock. Meanwhile, warehouse staff may be checking quantities, waiting for an inspection, correcting a label, or searching for an empty location. As a result, teams make decisions using different versions of the same inventory event.
Therefore, the solution starts with measuring the receiving-to-putaway journey. This guide explains the KPI, its formula, benchmarks, delays, and improvements without sacrificing accuracy.
2. What Does Dock-to-Stock Cycle Time Actually Measure?
Dock-to-stock cycle time is the average elapsed time from receiving a supplier delivery until the goods are recorded in the inventory system and put away in their storage locations. The authoritative APQC definition uses hours and includes the time spent waiting between process steps.
2.1 Dock-to-Stock Cycle Time: Definition and Boundaries
First, the clock should start when the business receives the delivery, using a recorded event such as the accepted receiving timestamp. Next, it ends when the required inventory recording and putaway are complete. Therefore, choose one defensible definition and use it consistently.
Some warehouses also measure when inventory becomes eligible for picking. That is valuable, but it may be a separate availability metric. For example, a pallet stored in a quarantine area can be physically put away while still blocked from sale. Therefore, do not quietly combine incompatible endpoints in one KPI.
2.2 Dock-to-Stock Cycle Time From Receiving to Putaway
| Stage | What happens | Common source of delay |
|---|---|---|
| Delivery receipt | Warehouse accepts the arriving shipment | Bay scheduling and paperwork |
| Unloading | Cartons or pallets leave the vehicle | Staffing and equipment availability |
| Verification | Staff check SKU, quantity, and PO details | Missing ASN or mismatched units |
| Inspection | Goods undergo required quality checks | Testing queues or damage reviews |
| Inventory recording | Accepted quantities enter the system | Manual entry and unresolved exceptions |
| Putaway | Goods move to confirmed storage locations | Staging congestion or unsuitable bins |
For example, a load may need 20 minutes of counting yet wait three hours for its next assigned task.
2.3 What This Inbound KPI Includes and Excludes
In practice, the standard KPI captures the defined supplier-delivery-to-putaway span. However, it does not measure supplier manufacturing lead time, transportation before receipt, or outbound picking and shipping. Similarly, it does not directly prove inventory accuracy, storage quality, or order availability.
Consequently, the metric is most useful when paired with receiving accuracy, putaway throughput, and the age of open receiving exceptions.
Because a dock-to-stock measure ends at recorded putaway, it should not stop when a pallet leaves the trailer. Likewise, it should not keep running until the last customer order ships. Those are different processes with different owners.
In practice, attach each timestamp to a receipt ID and warehouse. That way, a manager can trace one slow result back to an actual pallet or delivery instead of debating a summary number.
3. How to Calculate Dock-to-Stock Cycle Time
Fortunately, the calculation is straightforward once the team agrees on its event timestamps.
3.1 Dock-to-Stock Cycle Time Formula
Dock-to-stock time in hours = (putaway completion timestamp – supplier delivery receipt timestamp) / 60, when the difference is measured in minutes.
First, for a reporting period, calculate the time for each eligible completed delivery. Next, divide the sum of those durations by the number of deliveries.
3.2 A Dock-to-Stock Cycle Time Calculation Example
For example, consider a hypothetical supplier shipment received at 9:00 a.m. The crew then finishes unloading at 10:00 a.m., counting at 12:30 p.m., and physical putaway at 3:00 p.m. Finally, the inventory system records the final completion event at 3:30 p.m.
| Event | Timestamp | Elapsed time since receipt |
|---|---|---|
| Delivery accepted | 9:00 a.m. | 0 hours |
| Unloading complete | 10:00 a.m. | 1 hour |
| Verification complete | 12:30 p.m. | 3.5 hours |
| Physical putaway complete | 3:00 p.m. | 6 hours |
| Recorded completion | 3:30 p.m. | 6.5 hours |
Under the stated measurement rule, the result is 6.5 hours. By contrast, stopping at unloading would report just one hour and overlook the larger delay. In this example, dock-to-stock cycle time includes the wait before the final record is posted.
3.3 Dock-to-Stock Cycle Time for Partial Receipts
For example, a shipment may contain ten purchase-order lines, but only seven arrive. Meanwhile, another line might go directly into quarantine while the rest reaches storage.
Choosing shipment-, receipt-, or line-level measurement
First, decide whether a delivery counts as complete only when every accepted unit is put away. Alternatively, track each receipt line or handling unit and separately summarize the shipment. Importantly, keep missing goods out of the denominator for physically received stock; a supplier short shipment is a purchasing discrepancy, not a pallet waiting in the building.
Setting timestamp rules for weekends, holds, and exceptions
Also, record why work stops: inspection hold, missing label, unavailable rack, system outage, or supplier discrepancy. Use calendar elapsed hours for a true end-to-end clock unless the dashboard explicitly defines a working-hours variant. In addition, open receipts need an aging report even before their final cycle time can be calculated.
For example, suppose five pallets arrive together but one fails a damage check. The other four may finish putaway that afternoon, while the held pallet needs review. Therefore, show both the completed-unit durations and the open exception. Otherwise, the report can hide a stalled pallet inside an attractive shipment average.
4. What Is a Good Dock-to-Stock Cycle Time?
However, there is no single ideal target for every warehouse. For example, a small-parts distributor with pre-labeled cartons faces different work from a furniture importer receiving bulky goods or a food operation requiring checks.
4.1 Dock-to-Stock Cycle Time Benchmarks in Context
APQC’s published benchmark covers 3,560 companies. It reports a 15.0-hour median, a 6.0-hour 25th percentile, and a 25.0-hour 75th percentile. In general, a lower time is better, provided the warehouse completes its required controls.
| APQC percentile | Dock-to-stock time |
|---|---|
| 25th percentile | 6 hours |
| Median | 15 hours |
| 75th percentile | 25 hours |
The WERC DC Measures framework likewise treats dock-to-stock time as an important inbound operational metric. Therefore, use dock-to-stock cycle time as a comparison measure, not a reason to bypass necessary checks.
4.2 Why Warehouse Averages Hide Slow Receipts
A warehouse can average eight hours while some priority receipts spend two days in staging. Therefore, review median and 90th-percentile durations, not only the mean. Also count receipts that remain open beyond the agreed target.
For instance, ten small deliveries may finish quickly while one bulk load blocks an inbound zone. Segment results before declaring success.
For a better view, add a small aging ladder: receipts open for less than four hours, four to eight hours, eight to 24 hours, and more than 24 hours. These bands are illustrative, not standard targets. Then filter by purchase order, receiving shift, and reason code. As a result, managers can separate a daily staffing issue from one unusual shipment.
4.3 How to Compare Dock-to-Stock Cycle Time Across Sites
First, use the same start event, stop event, clock convention, and treatment of holds. Next, group receipts by handling type, supplier, shift, warehouse, and product requirements.
Finally, inspect the supporting accuracy data. Premature putaway confirmations create inventory errors, not genuine gains.
5. Seven Bottlenecks That Slow Dock-to-Stock Cycle Time
Often, queues form at handoffs between suppliers, employees, locations, and business systems. Therefore, rather than blaming the slowest visible task, find the precise point where a receipt stops advancing. In many cases, dock-to-stock cycle time grows because nobody owns the wait between two tasks. Then assign an owner and measure the wait.
5.1 Why Dock Congestion Extends Dock-to-Stock Cycle Time
For example, when several carriers arrive together, one receiving bay may block another. Workers cannot safely unload until space, equipment, and people become available. First, track appointment adherence and time from accepted arrival to unloading start. Then stagger bookings and separate urgent goods from routine arrivals.
5.2 Slow Unloading and Gaps in Receiving Capacity
Similarly, unloading may wait for a forklift or trained operator despite open floor space. Therefore, compare hourly arrivals with available labor and equipment.
For example, a warehouse may have enough workers in total but only one person certified to operate a needed lift truck. Consequently, inbound pallets wait while labor appears available on paper. Plan capacity by task and equipment type, not by headcount alone. Also compare peak-hour demand with the planned shift roster.
5.3 How Supplier Errors Extend Dock-to-Stock Cycle Time
For example, incorrect SKUs, quantity differences, and missing advance shipping notices force workers to stop and ask purchasing for a decision. However, an ASN is useful only when it describes what actually arrived. For identifiers, GS1 explains how an SSCC can identify a logistics unit and connect its scanned barcode to shipment information.
Quantity, SKU, and unit-of-measure mismatches
For example, a supplier may ship six cases of twelve while the PO expects 72 individual units. If staff confuse the units, they can overstate stock or delay the receipt. Therefore, maintain approved conversions and a defined exception owner. Do not change the physical count simply to make a purchase order reconcile.
5.4 Quality Inspections and Inventory Holds
Similarly, fragile, regulated, or quality-sensitive goods may need damage, lot, temperature, or specification checks. Of course, those controls are legitimate. The avoidable delay comes from unassigned inspections, unclear approval authority, or goods left unmarked while awaiting a decision. Therefore, track hold age separately from handling time.
5.5 Labeling, Staging, and Misplaced Pallets
For example, pallets that lack readable labels often enter an informal holding area. Later, the putaway crew must search for the right load, repeat a count, or recreate a label. Instead, give each handling unit an identity and defined staging location.
Meanwhile, teams may move the same pallet twice because a staging zone has no fixed lane or scan point. Each extra move adds time and raises the chance of a lost unit. Instead, mark temporary locations and require a transfer event when goods move between them. Then review any stock parked there beyond the shift.
5.6 Poor Putaway Planning and Warehouse Slotting
Meanwhile, even verified goods can wait if suitable bins are full, aisles are congested, or task assignments ignore travel distance. However, respect size, weight, lot, and safety rules; a convenient location is not always an eligible one.
5.7 How System Updates Extend Dock-to-Stock Cycle Time
Finally, the physical pallet may reach its shelf while the receiving record remains unfinished. Manual reentry, disconnected warehouse applications, or a failed synchronization can extend the official cycle time and confuse stock visibility.
| Bottleneck | Diagnostic signal | First corrective action |
|---|---|---|
| Dock congestion | Queue before unloading | Spread appointment windows |
| Receiving capacity | Load waits for equipment | Match coverage to arrival peaks |
| PO discrepancy | High correction frequency | Validate supplier and unit data |
| Inspection backlog | Aging held receipts | Assign review owners and deadlines |
| Staging confusion | Pallets repeatedly relocated | Label handling units and zones |
| Putaway delay | Verified stock has no task | Review bin capacity and assignments |
| Posting delay | Physical work predates records | Audit transaction handoffs |
6. Why Received Inventory Is Not Always Ready for Fulfillment
In practice, an inbound delivery can pass through several inventory states without immediately becoming pickable. Physical possession, a posted receipt, a confirmed storage location, and available-to-promise quantity answer different questions. Therefore, even a short dock-to-stock cycle time does not prove every unit is ready for sale.
6.1 Received, Recorded, Stored, and Available Inventory
For example, imagine 400 units arrive. Next, staff accept 390, hold ten for damage review, and record the accepted quantity. Meanwhile, the team stores 300 units while 90 remain in staging. Depending on the business rules, the system might show received stock that is not yet eligible for customer allocation.
At the same time, an on-hand balance should not be treated as a promise to every sales channel. Some units may belong to existing orders, a specific wholesale customer, or a quality hold. Therefore, show the quantity by status and location before publishing it to a storefront or promising it to a buyer.
6.2 How Holds and Reservations Affect Stock Availability
For example, a hold prevents ordinary use until someone releases the affected stock. Meanwhile, customer orders may already commit part of the accepted quantity. As a result, on-hand and available stock can differ even when the receiving data is correct. The forward-pick replenishment guide explains another distinction: stock in reserve is not always ready at the active pick face.
6.3 Dock-to-Stock Cycle Time and Customer Order Promises
For example, if purchasing treats a delivered PO as fully usable inventory, it may delay a needed replenishment. Conversely, if a posted receipt remains invisible to planning, buyers may reorder unnecessarily. For Shopify and wholesale operations, inaccurate available quantities can affect allocations and delivery promises. Xorosoft connects inventory, purchasing, and warehouse processes, but any platform still needs explicit status and transaction rules.
7. How to Reduce Dock-to-Stock Cycle Time Without Losing Accuracy
In short, improvement means removing needless waiting while preserving controls. First, review the oldest incomplete receipts and follow their timestamps rather than asking teams to work faster without evidence. That way, dock-to-stock cycle time improves through shorter queues instead of skipped checks.
7.1 Separate Handling Time From Receiving Queues
For each sampled delivery, time unloading, counting, inspection, posting, and putaway separately. Also record every gap between tasks. For example, a two-hour wait for an empty bin is not an unloading productivity problem. Therefore, assign one owner to each avoidable delay.
For example, if a pallet needs 40 minutes of hands-on work but sits idle for five hours, buying a faster scanner will not address the main delay. Instead, compare the queue before each task with the time spent doing it. As a result, the team can choose the lowest-cost fix first.
7.2 Standardize PO and ASN Receiving Checks
First, require a consistent supplier reference, expected SKU, unit of measure, and exception procedure. Where appropriate, use ASNs to prepare locations and staff before arrival. However, confirm physical quantities independently; advance information must not replace receipt checks.
7.3 Improve Dock-to-Stock Cycle Time With Better Scanning
Next, give cartons or pallets reliable identifiers and confirm the destination at the point of movement. A barcode can reduce retyping, but it cannot fix incorrect master data. The barcode inventory control guide offers additional context. Xorosoft supports barcode-driven warehouse workflows; assess them against your actual receiving exceptions.
7.4 Fix Staging, Slotting, and Labor Handoffs
First, designate temporary zones, assign putaway tasks, and review capacity before peak inbound windows. Then align trained operators and equipment with the expected arrival mix. If repeated deliveries require special handling, create a documented route instead of relying on memory.
In addition, create a simple escalation rule when a pallet has no valid destination. If it waits past a chosen limit, the receiving lead should know who can assign overflow space or approve a location change. Otherwise, the same unresolved item can pass across several shifts without a clear owner.
7.5 Balance Dock-to-Stock Cycle Time With Accuracy
Also, track dock-to-stock hours alongside receipt discrepancy rates and location accuracy. In addition, review receipts still open after the target time. Above all, never reward premature putaway confirmation or skipped inspections.
A root-cause scorecard for recurring delays
| Indicator | Review question | Owner |
|---|---|---|
| Cycle-time median and 90th percentile | Where are long-tail delays growing? | Warehouse manager |
| Open receipt aging | Which goods have no next action? | Receiving lead |
| Receipt discrepancy rate | Which suppliers or SKUs recur? | Purchasing and receiving |
| Putaway completion accuracy | Do system locations match physical goods? | Inventory control |
Free ERP Readiness Assessment: Use this ERP readiness checklist to assess ownership, data quality, workflows, and integrations before deciding whether the solution requires software or process changes.
8. Dock-to-Stock Cycle Time vs. Other Warehouse KPIs
Clearly, no single metric explains warehouse performance. Cycle time measures elapsed flow, whereas accuracy and throughput describe whether the work was completed correctly and at a sustainable rate. As a result, dock-to-stock cycle time belongs beside these measures, not on a dashboard alone.
8.1 Receiving Cycle Time Versus Putaway Time
Generally, receiving processing time covers checking and recording goods. By contrast, putaway time covers the move into storage. Meanwhile, dock-to-stock spans both, plus the waiting between them. Since organizations may define substeps differently, publish the boundaries with every dashboard.
For example, unloading may finish in 30 minutes, while checks take 90 minutes and putaway starts four hours later. If a report includes only labor activity, it misses the four-hour gap. Therefore, measure task time and end-to-end elapsed time side by side. That separation turns a vague complaint about slow receiving into a clear action list.
8.2 Dock-to-Stock Cycle Time vs. Order Fulfillment Time
By contrast, outbound order cycle time starts from a customer-order event and ends at a defined fulfillment or delivery event. Inbound dock-to-stock begins with supplier delivery receipt. Although they can influence each other, they should never share one KPI label.
8.3 Receiving Accuracy, Throughput, and Labor KPIs
| KPI | Main question answered | Why pair it with cycle time? |
|---|---|---|
| Dock-to-stock hours | How long until putaway is complete? | Measures inbound elapsed time |
| Lines received per hour | How much work is processed? | Shows throughput and capacity |
| Receiving accuracy | Were SKU and quantities correct? | Guards against speed-driven errors |
| Putaway location accuracy | Is stock where records say it is? | Protects picking and cycle counts |
| Open receipt aging | What remains unfinished? | Exposes hidden backlog |
For broader context, WERC’s DC Measures covers inbound documents, damage-free receipts, supplier timeliness, and lines received and put away per hour.
However, a high rate of lines received per hour does not prove the count is correct. Likewise, a low dock-to-stock time can mask a backlog of unfinished exception receipts if only completed deliveries appear in the average. In addition to the metrics below, display how many receipts remain open past the target and whether their stock is blocked from normal use.
9. How Dock-to-Stock Cycle Time Varies by Industry
Because product handling, storage needs, and inspection rules differ, a fast receipt means different things across sectors. Therefore, compare like-for-like deliveries when setting targets. Accordingly, dock-to-stock cycle time targets should reflect the types of loads each team handles.
9.1 Apparel, Furniture, and Sporting Goods
For example, apparel deliveries often contain many color and size variants, so incorrect SKU labels can delay checks. Furniture may require equipment, damage checks, and larger storage spaces. Sporting goods often combine small accessories with seasonal bulky products.
For example, a fashion brand may get 500 cartons containing several sizes in one shipment. Because the variants look similar, a single label error may hold multiple cartons for recounting. By contrast, a furniture site may spend more time on safe unloading and damage checks. As a result, the two sites need different task targets even when they share the same overall KPI name.
9.2 Food, Beverage, and Manufacturing
Likewise, food and beverage facilities may need lot, expiry, temperature, or release controls. In manufacturing, a delayed raw-material receipt can affect production readiness even when the supplier delivered on schedule.
In food operations, for example, staff may have to confirm batch codes and shelf-life rules before stock can be released. Meanwhile, a plant may need a raw-material lot to reach an approved storage point before it can support a work order. Therefore, shorten avoidable waits without removing checks that protect safety and traceability.
9.3 Multi-Warehouse Receiving and 3PL SLA Rules
For example, wholesale teams may receive mixed pallets for many customer commitments. Ecommerce brands must distinguish stock physically received from stock eligible to sell across channels. Multi-warehouse businesses also need consistent location and timestamp definitions. Xorosoft supports multi-warehouse and ecommerce inventory workflows, making those handoffs relevant when operations become more connected.
Therefore, 3PLs should agree on time boundaries and exception exclusions. The 3PL SLA management guide provides related considerations.
| Industry | Typical receiving difficulty | Important control |
|---|---|---|
| Apparel | Size and color variants | SKU and carton checks |
| Furniture | Bulky or fragile goods | Condition and location checks |
| Sporting goods | Seasonal mixed-SKU loads | Labor and space planning |
| Food and beverage | Lot, expiry, and inspection | Eligibility and traceability |
| Manufacturing | Materials needed for work orders | Timely, accurate material receipt |
| Wholesale and 3PL | Mixed receipts and SLAs | Agreed timestamps and exceptions |
10. When Manual Receiving Needs a WMS or Connected ERP
For example, a small warehouse with predictable inbound volume may improve through scheduled receiving, clear labels, and a shared exception log. However, recurring mismatches across departments may signal a larger coordination problem. Before choosing software, identify whether dock-to-stock cycle time suffers most from missing data, limited space, or unclear task ownership.
10.1 When Better Receiving Processes Are Enough
Likewise, a small team with few daily receipts can succeed with scheduled unloading, labeled staging, and a shared exception log. Define owners and test data accuracy first. Therefore, upgrade only when coordination breaks down.
For instance, a team processing a few predictable deliveries each day may only need a shared receipt log, fixed storage labels, and daily follow-up on exceptions. Therefore, test those changes before replacing software. If the same SKU is received in several sites, however, the team must also check whether it can maintain one accurate stock record.
10.2 How WMS Tracks Receiving and Putaway
For example, a WMS can support scanning, task assignments, location tracking, and receiving-to-putaway confirmation. For its part, Xorosoft offers these functions through XoroWMS. Confirm the exact sequence in a workflow demonstration, especially for partial receipts, holds, and wrong-bin exceptions.
10.3 When Purchasing, Inventory, and Accounting Need One Workflow
However, if the warehouse, buyers, and finance team repeatedly reconcile different receipt totals, the issue extends beyond putaway. In that case, a connected ERP/WMS approach can reduce separate data entry and provide shared inventory context. The broader Xorosoft cloud ERP platform connects accounting, inventory, warehouses, and orders. Still, evaluate implementation fit rather than assuming integration fixes weak procedures.
| Approach | Suitable situation | Main limitation |
|---|---|---|
| Documented manual workflow | Low-volume, simple receiving | Depends heavily on consistent follow-through |
| Inventory application | Basic receipt and stock tracking | Warehouse tasks may remain separate |
| Standalone WMS | Complex physical execution | Requires dependable integration with other systems |
| Connected ERP and WMS | Frequent cross-team receipt and inventory issues | More process design and change management |
Watch Demo: Start with the XoroONE product explainer and ask for a receiving-to-putaway walkthrough using a genuine exception from your warehouse. An explainer is not a substitute for validating a complete workflow.
For instance, a buyer may close a purchase order after a supplier confirms delivery even though the warehouse has accepted fewer units. Meanwhile, finance may record the full invoice amount. Consequently, the real issue is not how fast a pallet moves. Instead, the company needs a clear receipt approval process and shared quantities across teams.
11. A 30-Day Plan to Improve Dock-to-Stock Cycle Time
Importantly, use the same population and timestamp rules throughout the test. Therefore, compare dock-to-stock cycle time using the same start and end events each week.
11.1 Week One: Define the Measurement Rules
First, document start, end, holds, partial deliveries, and calendar conventions. Then, export recent completed receipts and today’s open backlog. Check sample timestamps against actual receiving records before trusting the dashboard.
11.2 Week Two: Find the Longest Receiving Delays
First, review the slowest receipts with warehouse staff, purchasing, and inventory control. Group waiting by docks, inspections, mismatches, staging, and putaway. Finally, pick one or two causes with clear owners and measurable evidence.
Next, interview the people who worked on the flagged receipts. Ask what they needed, who they contacted, and where the pallet waited. Then compare their answers with the record of system events. In this way, the team can distinguish a missing scan from a genuine physical delay. Keep each cause specific enough to test in the pilot.
11.3 Week Three: Pilot Better Warehouse Receiving
For the pilot, try better appointment staggering, early bin assignments, or clearer exception escalation on one shift or product group. Then, record the new process and compare similar deliveries.
11.4 Week Four: Review Results and Assign Owners
First, review median, 90th percentile, exception age, and accuracy together. Finally, keep changes that reduce needless delay without creating new errors.
| Week | Deliverable | Success check |
|---|---|---|
| 1 | KPI definition and baseline | Timestamps verified |
| 2 | Ranked root causes | Each delay has an owner |
| 3 | Controlled pilot | No loss of accuracy |
| 4 | Ongoing scorecard | Repeatable review cadence |
Finally, agree on a weekly review with the receiving lead, inventory control, and purchasing. Compare equivalent loads rather than using a favorable week with fewer complex deliveries. Also record the cost of changes, such as overtime or extra handling. A lasting improvement should lower waiting time without shifting expense or mistakes to another team.
12. What Warehouse Teams Should Fix First
In the end, faster dock-to-stock performance begins with an accurate clock, not a faster-looking dashboard. First, define supplier receipt and completed putaway consistently. Next, locate the longest waiting periods and give every open receipt a clear owner. Finally, compare cycle time with accuracy, inspection controls, and the inventory states that customer orders depend on.
For simpler warehouses, process changes may be sufficient. However, when receiving delays repeatedly affect purchasing, inventory, ecommerce, and finance, evaluate whether connected workflows would help. Xorosoft is one option for inventory-driven businesses; use a real receiving exception to test the fit. Book a personalized demo to review the requirements without assuming software alone will solve them.
Frequently Asked Questions About Warehouse Exception Codes
What are warehouse exception codes?
They are standard labels for problems such as receiving shortages, short picks, and stock count gaps. Consistent codes make issues easier to track and compare.
How do you design warehouse exception codes?
Group issues by task, use clear names, and define when each code applies. Add owners and test choices with warehouse staff.
What warehouse exception code examples should I use?
Common examples include REC-SHORT for a short receipt, PICK-SHORT for unavailable stock, and INV-VAR for a count difference.
How are exception codes different from root causes?
A code records what happened. A root cause explains why. Record the event first, then confirm the cause after reviewing stock and task records.
What data should each exception record include?
Capture the code, time, warehouse, SKU, task reference, quantity, owner, and status. Add the confirmed cause and resolution when known.
How do you calculate a warehouse exception rate?
Divide recorded exception events by eligible tasks, then multiply by 100. Apply the same rules across sites and periods for fair comparisons.
When should businesses automate warehouse exception tracking?
Consider a WMS or integrated ERP when spreadsheets cause duplicate entries, poor traceability, or inconsistent reports. Test real workflows before choosing software.
Recent Posts
-
 Batch Picking vs Zone Picking for High-Volume Ecommerce Warehouses
-
 ERP Modernization Benchmarks 2026: Cost, Duration, and Operational Risk
-
 ERP for Pet-Product Distributors Managing Lots, Bundles and Subscriptions
-
 How to Create a System-of-Record Matrix for Shopify and ERP Data
-
 How an Ecommerce Warehouse Reduced Late Orders With Controlled Wave Release