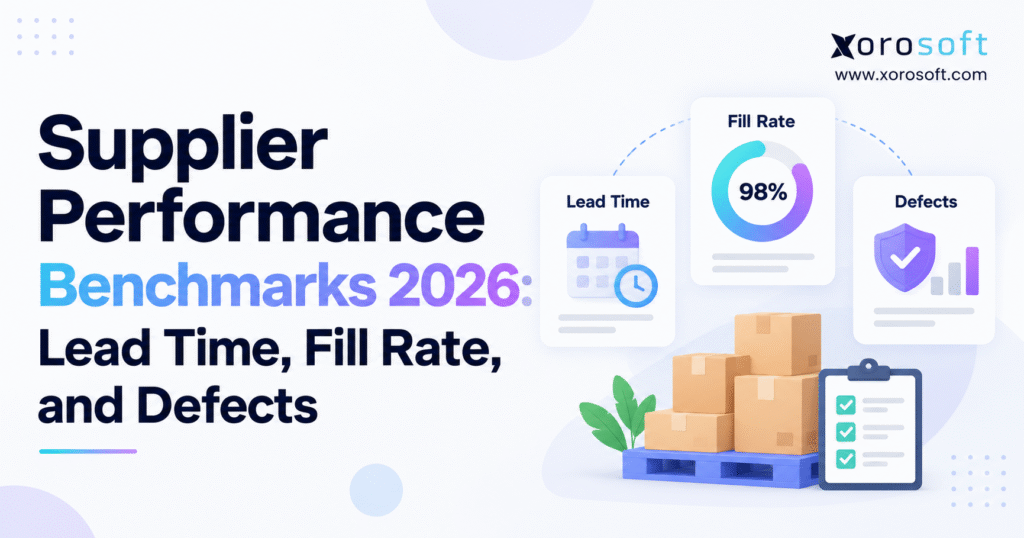
When evaluating your supply chain, it is important to understand supplier performance benchmarks.
1. Supplier Delays Become Inventory Problems Long Before They Become Reports
A supplier promises 2,000 units for a seasonal launch. The shipment arrives four days late, 180 units short, and with several cartons damaged. Purchasing records show the order as received. The warehouse sees a shortage. Sales has already committed the stock. Finance is left sorting out claims and credits. Everyone is looking at the same purchase order, but nobody has the same answer about supplier performance.
This is why supplier performance benchmarks matter in 2026. A single late-delivery percentage cannot tell a business whether a vendor supports reliable replenishment. Purchasing teams need to understand how long products take to arrive, how much of each commitment is fulfilled, and how much received inventory is actually usable.
1.1 Why Growing Businesses Lose Visibility Into Supplier Reliability
At lower purchase volumes, an experienced buyer often knows which vendors need chasing. That informal knowledge breaks down when a distributor opens another warehouse, an apparel brand adds wholesale accounts, or a manufacturer sources hundreds of components. Different employees manage confirmations, freight, receiving, and quality inspections. Exceptions end up in inboxes rather than a shared performance record.
The cost appears elsewhere: extra safety stock, expedited freight, postponed production, customer backorders, and cash tied to inventory that cannot be sold. A supplier may seem inexpensive on the purchase order while creating substantial costs after the order is placed. Without consistent measures, teams struggle to separate supplier failures from internal process delays.
1.2 What Supplier Performance Benchmarks Should Answer
A useful benchmark helps answer three operational questions. Was the inventory available when needed? Did the supplier deliver the quantity it committed? Were the products acceptable for sale or production? Lead time, fill rate, and defect rate provide the foundation, while on-time delivery and lead-time variability add essential context.
Benchmarking does not require every business to hit the same number. It requires comparable definitions, reliable source data, and targets that reflect the consequences of failure. This guide examines published figures, practical formulas, industry differences, and the steps needed to turn a supplier report into better purchasing decisions.
2. Supplier Performance Benchmarks Available in 2026: What the Data Shows
Published averages help procurement teams establish context, but only when the figures are interpreted carefully. One study may measure complete purchase orders, another may count individual order lines, and a third may track units received before a cutoff. Those percentages describe different things and should never be treated as interchangeable.
2.1 Four Published Supplier Benchmarks Worth Understanding
APQC publishes cross-industry procurement measures with publicly displayed medians and sample sizes. The following figures are available for reference in 2026; the displayed pages do not establish that every observation was collected during 2026.
| Published APQC measure | Cross-industry median | Sample size |
|---|---|---|
| Average supplier lead time on purchased materials | 10 days | 3,077 companies |
| Supplier orders received by original request date | 81.0% | 2,205 companies |
| Purchase orders received complete | 90.9% | 1,927 companies |
| Purchase-order lines received complete | 95.0% | 749 companies |
These medians come from separate company samples, not one common group. APQC’s supplier lead-time measure starts when a purchase order is transmitted and ends when delivery is received. Its on-time measure uses the originally requested date. The two completeness measures distinguish entire orders from individual order lines.
2.2 Why a Cross-Industry Median Is Not a Universal Target
The 10-day median does not mean imported furniture should arrive in ten days, nor does an 81% on-time median make missing nearly one in five commitments acceptable. A benchmark describes the middle of a measured population; a target should reflect business requirements, commercial agreements, and the cost of disruption.
2.3 A Practical Way to Use 2026 Supplier Benchmark Data
Treat published supplier performance benchmarks as a starting point for questions, not an automatic grading scale. If your complete-order rate trails an external median, investigate whether partial shipments are common, whether promises are unrealistic, or whether warehouse receiving is recording shortages correctly. Then compare suppliers operating under similar conditions.
Keep the published benchmark separate from your actual baseline and agreed service target. That three-column view makes meetings more constructive: external context shows what other organizations have reported, the baseline describes current performance, and the target expresses what your operation needs.
3. Supplier Lead Time Benchmarks: Measure Reliability, Not Just Speed
Averages are useful for budgeting replenishment time, yet they conceal the deliveries that cause the worst problems. A vendor that routinely takes twelve days is often easier to plan around than one that alternates between seven and seventeen days, even when both have a similar average.
3.1 Calculate Actual Supplier Lead Time From Purchase-Order Records
For a consistent procurement measure, use supplier lead time = physical receipt date minus purchase-order transmission date. Suppose a buyer sends an order on April 3 and the warehouse receives it on April 17. The elapsed lead time is fourteen calendar days. If a business plans in working days, its calculation should use that convention throughout.
3.2 Compare Averages With Median and Upper-Percentile Results
Imagine five lead times of 8, 10, 11, 12, and 19 days. Their average is twelve days, while their median is eleven. The nineteen-day receipt exposes a tail risk that neither average nor median describes well. For frequent purchases, the 90th percentile can show the lead time within which approximately nine out of ten comparable receipts arrive.
To apply supplier performance benchmarks fairly, segment results by supplier-item combination. A vendor may ship standard stock quickly but require a longer production window for custom variants. Combining those purchases creates a number that serves neither planning process. Also separate rush orders, unusual freight arrangements, and abnormal disruptions before setting ordinary replenishment assumptions.
3.3 Convert Lead-Time Variation Into a Purchasing Decision
If demand is steady at forty units daily, a twelve-day average lead time implies 480 units of expected demand during replenishment. Planning for eighteen days implies 720 units before adding any separate safety stock. That difference affects reorder timing and working capital even though sales demand has not changed.
Do not simply set every reorder point to the slowest receipt ever recorded. Identify a suitable service objective, review demand variability, and consider the cost of a stockout. Supplier lead time benchmarks help inform this decision; inventory planning should still reflect a broader assessment of risk, demand, and replenishment behavior.
4. Supplier Fill Rate Benchmarks: What Actually Arrives by the Deadline
Fill rate is one of the most useful purchasing metrics and one of the easiest to misinterpret. People use the same term for units delivered, lines completed, and entire orders fulfilled. Each view answers a different question about operational availability.
4.1 Distinguish Unit Fill Rate, Complete Lines, and Complete Orders
In supplier performance benchmarks, unit fill rate divides units received by the due date by units due by that date. A line-completeness rate asks whether each purchase-order line was fully delivered. A complete-order rate asks whether the whole purchase order met the agreed quantity requirement. Those calculations can produce sharply different percentages from the same receipts.
For example, a purchase order with ten lines might arrive with nine lines complete and one line only half fulfilled. Its complete-line rate is 90%, but the whole-order completeness result is zero for that purchase order. Unit fill rate depends on the quantities within the lines. This is why the APQC order and line completeness medians cannot stand in for a universal unit fill-rate benchmark.
4.2 Work Through a Supplier Fill Rate Example
Assume a supplier has 2,400 units due during a month. By the original deadlines, the warehouse has received 2,280 units. The on-time unit fill rate = 2,280 / 2,400 x 100 = 95%. This is a quantity-weighted result, not the simple average of individual purchase-order percentages.
Now assume the remaining 120 units arrive during the following week. Eventually receiving every unit does not change the original 95% on-time result. The purchasing report can show both original on-time performance and eventual completion, provided they remain clearly labeled. Otherwise, late backorders can make a supplier appear consistently reliable after the fact.
4.3 Measure Partial Receipts Against Real Customer Risk
Not all shortages have equal consequences. Missing fifty units of a slow-moving accessory may create little disruption; missing fifty components required to finish existing production orders may halt shipments. Alongside overall fill rate, identify late units linked to high-demand SKUs, customer allocations, production-critical materials, or seasonal launches.
When suppliers send advanced shipping notices, compare expected contents with received quantities and record variances immediately. This makes supplier performance benchmarks more actionable because the report shows not only how often shortages occur but also which shortages threaten orders and what purchasing must do next.
5. Supplier Defect Rate Benchmarks: Quality Is Part of Availability
A perfectly timed delivery can still fail the business if the goods cannot be used. Quality problems create replacement orders, inspection work, blocked stock, customer returns, and sometimes safety or compliance exposure. Accordingly, supplier quality belongs alongside lead time and completeness in every serious performance review.
5.1 Calculate Defect Percentage and Parts Per Million
The standard observed unit defect-rate formula is defective inspected units / total inspected units x 100. If inspectors find thirty defective items among 6,000 inspected, the observed defect rate is 0.5%. To express the same result as parts per million, multiply the fraction by one million, producing 5,000 PPM.
Both figures describe the inspected population. If the warehouse inspects a statistical sample rather than every unit, avoid presenting the observed sample rate as the exact rate for an entire shipment. Keep the sampling plan, product specifications, and defect classification attached to each result.
5.2 Set Acceptance Criteria by Product Risk
Supplier performance benchmarks cannot establish one responsible defect-rate target for every product. Minor appearance issues on a low-risk accessory do not carry the same consequences as faults in safety-related equipment, food ingredients, or precision components. Define critical, major, and minor defects where appropriate, and establish the acceptance rules with the supplier before delivery.
The ISO 2859-1:2026 acceptance-sampling standard provides AQL-indexed plans for inspecting lots by attributes. An acceptance quality limit is part of a sampling framework, not evidence that a specific supplier delivers at that defect rate. The selected plan and its risk implications should match the product and the organization’s quality obligations.
5.3 Separate Supplier Defects From Transport and Warehouse Damage
When cartons arrive crushed, the cause may lie in inadequate packaging, carrier handling, or internal movement after receipt. Each possibility calls for a different corrective action. Use receiving photographs, inspection timestamps, carrier notes, lot records, and supplier specifications to investigate before assigning responsibility.
Track defect rate alongside rejected lots, claims, replacement lead time, and the value of unusable goods. A supplier with few but severe quality incidents may deserve greater attention than one with more frequent minor nonconformities. The business outcome matters as much as the percentage.
6. On-Time Delivery and OTIF Complete the Supplier Reliability Picture
Supplier performance benchmarks become more meaningful when date and quantity measures are kept distinct. A delivery that reaches the dock on schedule is not necessarily useful if critical cartons are absent. Similarly, a complete delivery has limited value if it reaches the warehouse after a customer commitment has been missed.
6.1 Understand OTD, Fill Rate, and OTIF Side by Side
| Measure | Core question | Typical unit |
|---|---|---|
| On-time delivery (OTD) | Did the eligible delivery meet the selected date? | Deliveries or orders |
| Unit fill rate | How many required units arrived by the cutoff? | Units |
| Complete-order rate | Did the whole order arrive with all required quantities? | Purchase orders |
| OTIF | Did an eligible order arrive on time and in full? | Orders meeting both tests |
| Defect-free delivery | Did the delivery meet specified quality conditions? | Orders, lines, or inspected units |
The ASCM SCOR Digital Standard distinguishes supplier delivery quantity accuracy, committed-date achievement, damage-free performance, and defect-free conformance. Its definitions reinforce why procurement teams should not combine different service dimensions without preserving the detail behind them.
6.2 Keep the Original Date Even When Commitments Change
A common reporting mistake is overwriting the requested delivery date every time the supplier issues a new confirmation. The order can then appear on time despite a series of postponements. Preserve the original requested date, original supplier commitment, revised commitments, and actual receipt date in separate fields.
Use each date for an explicit purpose. The original requested date shows whether purchasing needs were met, while a confirmed-date measure can show whether the supplier kept its own promise. Reporting both identifies unrealistic buyer requests as well as supplier reliability problems, which leads to more constructive discussions.
7. Compare Supplier Performance Without Hiding Critical Weaknesses
Supplier performance benchmarks support decisions when they preserve important differences rather than producing a single flattering score. A vendor with excellent prices and delivery speed may still be unsuitable if defects jeopardize customer safety or production continuity. Use individual metrics before applying overall ratings.
7.1 Three Illustrative Suppliers With Different Risks
| Supplier | Average lead time | On-time unit fill rate | Inspected defect rate |
|---|---|---|---|
| North | 9 days | 89% | 0.3% |
| Central | 13 days | 98% | 0.2% |
| South | 11 days | 95% | 1.8% |
These figures are hypothetical, not published supplier averages. North delivers quickly but often leaves quantities missing. Central is slower yet provides a more dependable quantity and quality outcome. South looks reasonable on completeness, but defective stock may compromise availability. The best choice depends on which products each supplier provides and how much failure the operation can tolerate.
7.2 Use Criticality Gates Before Weighted Scores
Weighting delivery, cost, quality, and responsiveness can help prioritize supplier reviews. Still, a high composite score should not override a failed safety requirement or repeated shortages of production-critical components. Establish mandatory quality and supply-continuity thresholds before applying weighted comparisons.
Segment vendors by category and role. A packaging supplier, seasonal finished-goods manufacturer, and emergency spare-parts vendor serve different operational needs. Compare equivalent supplier groups over the same measurement window, and use performance trends rather than judging long-term relationships on a single unusual month.
8. Supplier Performance Benchmarks by Industry and Operating Model
A benchmark that works for one inventory-driven business can mislead another. Product complexity, demand patterns, shipping distance, quality obligations, and replacement options all influence the right target. Rather than inventing industry averages, translate common operating conditions into the measures each sector should monitor.
8.1 Wholesale Distribution and Multi-Warehouse Operations
Distributors often replenish thousands of SKUs against wholesale orders, ecommerce demand, and multiple warehouse locations. One incomplete inbound shipment may trigger transfers, allocations, and several partial customer shipments. Line completeness and on-time unit fill rate are often more revealing than average supplier lead time alone.
Measure supplier performance by the warehouse receiving goods as well as by vendor. A supplier delivering reliably to one region may struggle with a different route or carrier. Purchasing teams should also watch backorder age and the percentage of shortages affecting committed customer demand. These operating needs vary across inventory-driven industries.
8.2 Apparel, Footwear, and Sporting Goods
Seasonal collections create a deadline problem that average delivery statistics may not capture. A garment arriving two weeks late can miss an advertised launch or important wholesale shipping window. The supplier may still meet a reasonable annual average while causing a substantial commercial loss on a single collection.
Use supplier performance benchmarks to track launch-critical milestones, complete size-color assortments, labeling accuracy, and inspection failures. A shipment containing most of the units but missing popular sizes may create a worse customer experience than the headline fill rate suggests. Measure availability at the variant level when those variants determine actual sellability.
8.3 Manufacturing and Industrial Distribution
Manufacturers depend on components arriving in sequence with work orders and production schedules. Missing one low-value part may prevent shipment of a much more valuable finished product. For these businesses, supplier delivery reliability should be connected to material requirements planning, line stoppages, substitute approvals, and incoming inspection results.
Assess criticality at the item level instead of using purchase value as the only priority. A cheap but single-sourced component may require tighter monitoring than an expensive material available from several approved suppliers. Review supplier capacity, confirmed schedules, and material quality before production plans become fixed.
8.4 Furniture, Food, and Other Quality-Sensitive Goods
Furniture businesses may face long overseas replenishment cycles, bulky handling, missing assembly hardware, and damage that becomes visible only after unpacking. Food and beverage operations face additional requirements around remaining shelf life, temperature, batch identity, and traceability. Each category needs quality rules that reflect how inventory becomes usable.
For furniture, measure complete sets, damage-free receipts, and replacement time. For food, evaluate acceptance conditions and lot traceability alongside on-time delivery. A single combined percentage cannot substitute for these operational checks, although consistent supplier performance benchmarks can make their trends easier to compare.
9. Connect Supplier Performance to Stockouts, Safety Stock, and Cash Flow
Procurement reports earn attention when they explain business consequences. Delivery percentages by themselves rarely settle a purchasing decision. Showing their effect on stock availability, emergency spending, production continuity, and working capital gives leaders a reason to act.
9.1 Translate Lead Time Risk Into Replenishment Exposure
Consider a product selling fifty units per day. Expected demand over a ten-day lead time is 500 units. Over sixteen days, it becomes 800 units. If the business still reorders as though supply consistently arrives in ten days, it may run short before the replacement stock becomes available.
This simple example excludes safety stock and demand variability; it is not a complete inventory policy. A proper reorder point combines expected demand during replenishment with a buffer appropriate to the chosen service level and uncertainty. Updated supplier lead times should inform that calculation, especially after persistent changes in delivery performance.
9.2 Count the Cost of Incomplete and Defective Receipts
The purchase price does not show the total burden of unreliable inbound inventory. Partial shipments may generate split freight, rescheduling, customer service work, and urgent transfers. Defective receipts may add inspection time, quarantined stock, supplier returns, replacement purchases, and accounting adjustments.
Tie exceptions to real transaction costs whenever possible. For example, record expedited freight against the shortage that caused it, not just as a general warehouse expense. This reveals whether a lower-priced supplier remains economically attractive once downstream consequences are considered.
9.3 Avoid Using Excess Inventory as the Only Solution
Increasing inventory can temporarily protect against late deliveries, but it also consumes cash and warehouse capacity. Worse, additional inventory may conceal ongoing supplier defects or incomplete shipments until the next seasonal shift or demand spike.
Before raising purchasing quantities, determine whether the underlying problem can be addressed through more realistic commitments, better forecasts, alternate sources, improved packaging, or stronger receiving controls. Supplier performance benchmarks should help the business choose the least costly effective response rather than automatically expanding stock buffers.
10. Reliable Supplier Reporting Starts With Reliable Transaction Records
Many supplier dashboards fail because the source data was never designed for consistent evaluation. Dates are overwritten, partial receipts are closed incorrectly, and rejected units appear alongside usable inventory. Better reporting starts with the operational record, not with the chart.
10.1 Preserve the Full Purchase-Order and Receiving History
Capture the PO transmission timestamp, requested date, original confirmed date, current confirmed date, due quantities, item identifiers, receiving location, actual arrivals, and accepted quantities. Maintain one record for each receipt against an order instead of losing the timeline when later cartons arrive.
Suppliers may ship early, late, or in several installments. The report needs to know which units met the original commitment, which arrived later, and which were rejected. These facts are difficult to reconstruct from a final order status alone. Clear audit trails also make supplier conversations more objective.
10.2 Separate Warehouse Delays From Supplier Delays
A truck arriving at 10 a.m. and being unloaded the next morning represents a different performance problem from a truck reaching the facility one day late. If the system captures only the eventual goods-receipt posting, the supplier may be blamed for internal congestion.
Where practical, track arrival, unloading, inspection, and stock availability as separate events. Consistent timestamps can show whether the right improvement is better dock scheduling, additional receiving capacity, carrier coordination, or supplier corrective action.
10.3 Protect the Quality and Quantity Denominators
A damaged shipment should not silently count as fully available inventory. Define when units become accepted stock and how rejected units affect defect, fill-rate, and financial measures. Equally, canceled lines should follow documented rules so their removal cannot artificially improve reported performance.
Review data exceptions underlying supplier performance benchmarks every month. Orders with missing original dates, implausible negative lead times, duplicate receipts, or inconsistent units of measure deserve investigation. A small set of data-quality controls can improve supplier comparisons more than a sophisticated visualization built on unreliable records.
11. Turn Weak Supplier Metrics Into Specific Corrective Actions
Benchmarking should lead to a decision, an owner, and a follow-up date. Otherwise, the same suppliers appear on the exception report month after month while the organization absorbs the consequences.
11.1 When Deliveries Are Late, Diagnose the Failed Stage
Compare original commitments with purchase-order release, production readiness, carrier pickup, transit, and physical receipt. If a vendor repeatedly delays production, earlier forecasts or capacity agreements may help. If inventory waits at a border or port, the solution may involve shipping schedules, documentation, or alternate routes.
Identify whether the delay is predictable. A consistently longer lead time can often be planned around, while highly variable delays may require different service buffers or sourcing arrangements. Supplier performance benchmarks are most useful when they separate those two situations rather than simply flagging both as late.
11.2 When Fill Rate Is Low, Follow the Missing Quantities
Investigate stock allocation, production shortages, minimum batch sizes, substitutions, and order confirmation practices. Ask whether suppliers accepted quantities they could not realistically fulfill. Then measure the products, customers, and production orders affected by the missing stock.
For recurring partial shipments, consider staged commitments with clear dates, improved order visibility, or alternative sourcing for critical items. Update purchasing rules only after understanding the failure. Ordering more from an unreliable supplier may increase open commitments without improving availability.
11.3 When Defects Rise, Improve Evidence and Containment
Hold questionable lots when required, document the nonconformity, and establish who owns inspection, return authorization, credits, and replacement decisions. Ask for a corrective-action plan that identifies root cause and tests whether the proposed fix works. Measure repeat issues instead of closing cases when a credit memo arrives.
Review defect severity as well as frequency. A small number of critical failures can be more important than many cosmetic problems. Where sampling is involved, preserve the method and sample size so quality trends remain comparable over time.
11.4 Manage Relationships Without Weakening Accountability
Suppliers respond better when supplier performance benchmarks reflect agreed obligations instead of surprise ratings. Review trends, share examples, clarify commitments, and document next steps. A regular performance discussion should distinguish supplier responsibility from purchasing assumptions that were unrealistic in the first place.
Set escalation thresholds for recurring failures and define when to qualify an alternate source. Strong supplier management combines collaboration with measurable accountability. It also protects the business from making reactive switching decisions after one isolated exception.
12. When Supplier Benchmarking Calls for Connected ERP and Warehouse Systems
A spreadsheet may be sufficient for a small supplier base and limited purchase volume. Complexity changes the equation. As transactions spread across purchasing, warehouse receiving, accounting, ecommerce, and multiple facilities, consistent supplier measurement becomes harder to maintain manually.
12.1 Recognize When Disconnected Systems Distort Supplier Performance
Unreliable supplier performance benchmarks often stem from buyers retyping receipt quantities, warehouses lacking purchase-order context, finance reconciling credits outside inventory, and reports taking days to assemble. A business may have adequate individual applications but lack a dependable view of the transaction from commitment through accepted receipt.
At that point, platforms such as XoroERP become relevant to evaluate. Xorosoft positions its ERP for inventory-driven operations that need purchasing, stock control, accounting, and reporting connected. Software alone cannot fix unclear KPI rules, but integrated records can reduce avoidable reconciliation work.
12.2 Link Receiving Exceptions With Purchasing and Inventory
A warehouse management system can help maintain the physical record of what arrived, where it was received, and what happened next. For supplier measurement, this matters because purchased quantities, received quantities, and accepted quantities are not always the same.
The practical requirement is traceability between the purchase order, each receipt, quality exceptions, and inventory status. Xorosoft’s connected warehouse and ERP environment is one option for organizations comparing those workflows. Validate specific inspection, exception, and reporting features during product evaluation rather than assuming every KPI is configured by default.
12.3 Connect Inbound Reliability to Shopify and Other Sales Channels
A supplier shortage can affect several sales channels simultaneously. A merchant may have Shopify orders, wholesale commitments, marketplace listings, and stock reserved at different warehouses. Purchasing needs to understand those commitments before deciding which delayed inbound products require immediate attention.
Review the business’s integration requirements alongside supplier reporting needs. The Xorosoft ERP listing on the Shopify App Store provides additional product context for Shopify merchants. Xorosoft may be relevant where connected order, inventory, and purchasing workflows are needed, but exact integrations and synchronization behavior should be confirmed for the intended setup.
13. Build a Supplier Benchmarking Process in 30 Days
A useful first month does not require a massive procurement transformation. Start with a manageable supplier group and enough history to expose meaningful patterns. Use the initial effort to build confidence in definitions and data before broadening the program.
13.1 Week One: Agree on Definitions and Owners
Choose how lead time, on-time delivery, unit fill rate, complete orders, and defects will be measured. Establish date cutoffs, calendar conventions, eligibility rules, and quality classifications. Assign data owners across purchasing, receiving, and quality functions.
Start with the twenty or thirty suppliers that represent the greatest supply-continuity risk, rather than simply selecting those with the highest spend. Document the original promise fields that must remain unchanged even if later commitments are revised.
13.2 Week Two: Calculate Historical Baselines
To establish supplier performance benchmarks, match recent purchase-order lines to receipts and inspection records. Calculate the selected metrics, then flag missing dates, questionable quantities, and other gaps. Report incomplete data openly rather than filling it with invented estimates.
Segment suppliers into comparable groups. Use the first baseline to identify patterns, not to assign penalties. A supplier with a short history or very few orders may require more observation before its percentage results become meaningful.
13.3 Week Three: Investigate Exceptions That Matter Commercially
Find the late receipts, missing quantities, and defects with the greatest effect on customer promises or production plans. Trace a small sample of those exceptions back through the PO, supplier communication, carrier information, and warehouse events.
Ask which failures are recurring and preventable. Then identify process changes with clear owners, such as earlier confirmations, revised packaging requirements, improved receiving timestamps, or a backup source for a vulnerable item.
13.4 Week Four: Set Targets and Establish a Review Rhythm
Set reasonable supplier-specific targets based on operational requirements, contract terms, historical performance, and relevant external references. Establish monthly scorecard reviews and more frequent alerts for critical exceptions. Confirm that suppliers understand the measurement definitions.
At the end of the first month, assess whether the reporting process is repeatable. If generating results still requires extensive manual matching, identify the systems and data controls that need attention before adding more metrics or rolling the program out to every vendor.
14. Turn Supplier Performance Benchmarks Into Better Purchasing Decisions
The most useful result of supplier benchmarking is not a ranking of vendors. It is a clearer understanding of when inventory will arrive, how much of it will be usable, and what action purchasing must take before a delay becomes a customer problem. That requires looking beyond average lead time to delivery consistency, complete quantities, and product quality.
14.1 What to Change First in Your Purchasing Process
Begin by agreeing on the three core definitions. Preserve original supplier commitments, record partial receipts accurately, and keep rejected stock separate from sellable inventory. Compare suppliers over consistent periods and investigate the exceptions that affect critical products. Then use the findings to adjust sourcing, reorder policies, and supplier improvement plans.
Supplier performance benchmarks become more valuable as the measurement process becomes routine. Businesses that can connect supplier evidence with inventory exposure and financial consequences are better positioned to make informed trade-offs among price, reliability, quality, and working capital.
14.2 When to Review the Systems Behind Those Decisions
If purchasing teams repeatedly reconcile spreadsheets with warehouse and accounting records, it may be time to evaluate an integrated approach. XoroOne brings inventory, purchasing, warehouse operations, and financial workflows into a connected ERP environment for product-based businesses. The relevant question is whether that structure solves your specific reporting and operational gaps.
For a practical review of those requirements, contact Xorosoft to discuss your current purchasing process, supplier reliability measures, and what a more connected workflow would need to deliver. The goal is stronger decisions grounded in trustworthy supplier data, not another report that nobody uses.
FAQ
What are supplier performance benchmarks?
They compare suppliers using delivery speed, order completeness, on-time performance, and defects. Use consistent definitions and reporting periods before comparing vendors or setting targets.
What is a good supplier lead time?
APQC reports a 10-day cross-industry median for purchased materials. That is a reference point, not a universal target; sourcing routes and product complexity matter.
How is supplier fill rate calculated?
Divide units received by the required deadline by units due by that deadline, then multiply by 100. Track partial and late receipts separately.
What is a good supplier on-time delivery rate?
APQC reports an 81% cross-industry median for orders received by the original requested date. Set targets according to customer commitments and item criticality.
How is supplier defect rate measured?
Divide defective inspected units by total inspected units and multiply by 100. Record inspection methods and distinguish supplier defects from transit or warehouse damage.
How does OTIF differ from fill rate?
Fill rate measures the share of units delivered by a deadline. OTIF measures whether an order arrives both on time and in full.
Can ERP software improve supplier performance tracking?
ERP can connect purchase orders, receipts, inspections, and inventory records for consistent reporting. Confirm required calculations and data capture before relying on automated benchmarks.
Recent Posts
-
 Xorosoft vs NetSuite for Shopify B2B Operations in 2026
 -
 How to Manage Shopify B2B Payment Terms Without Breaking AR and Order Release
 -
 Supplier Performance Benchmarks 2026: Lead Time, Fill Rate, and Defects
 -
 Inventory Management for Target Plus Sellers Expanding Beyond Shopify
 -
 What Is an ERP Conference Room Pilot and Why Should Buyers Require One?