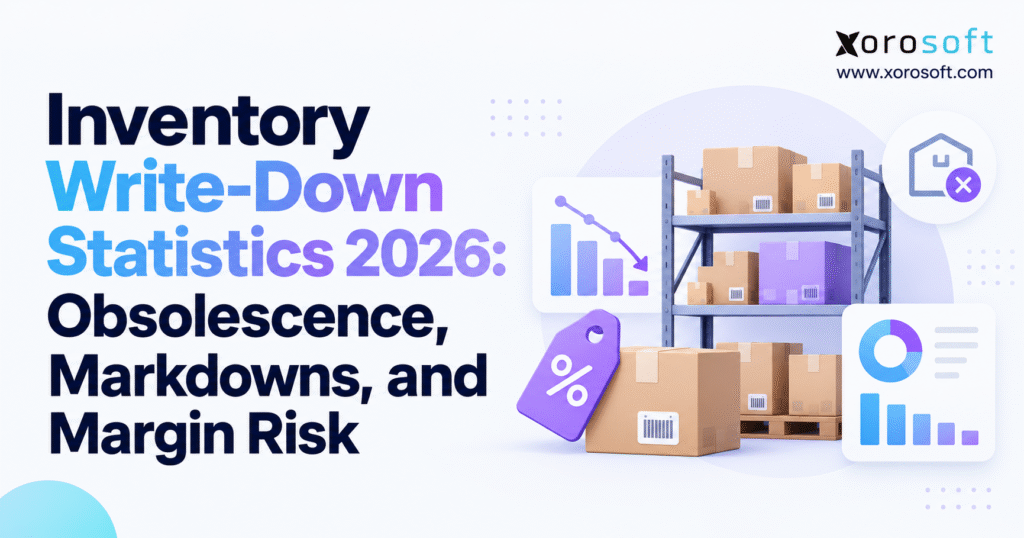
If you are seeking the latest inventory write-down statistics for 2026, this article will provide the essential data and insights.
1. Inventory Write-Down Statistics 2026: Key Data and Trends
1.1. Inventory obsolescence statistics: verified company figures
The most useful inventory write-down statistics 2026 come from company reports that state the measure, time period, and business context. For example, three companies show why similar-looking numbers can mean very different things.
| Company | Reporting period | Verified amount | What it represents |
|---|---|---|---|
| Mattel | December 31, 2025 | $32.1 million | Closing inventory obsolescence reserve |
| Mattel | Fiscal 2025 | Approximately $38 million | Obsolescence-reserve expense recognized in cost of sales |
| Bassett Furniture | Nine months ended August 29, 2026 | $1.749 million | Additions charged to excess-and-obsolete inventory reserve expense |
| Bassett Furniture | Same nine-month period | $2.241 million | Write-offs applied against existing reserves |
| DICK’S Sporting Goods | Fiscal 2025, ending January 31, 2026 | $10.6 million | Estimated pretax-income sensitivity to a hypothetical 10% change in obsolete-inventory reserves |
These values show real financial risk. However, they do not measure the same thing. Mattel reports a reserve balance at a single date. Bassett’s additions and write-offs describe movements during a period. The DICK’S figure is a sensitivity calculation rather than an actual expense. So, combining them into one average would mislead readers.
1.2. Why inventory write-down rates vary across industries
A single average inventory write-down rate sounds convenient, especially for benchmarking. However, these filings cannot establish a single, comparable industry-wide 2026 rate. Stock mix, product life, accounting rules, report dates, and reserve methods vary widely. For example, a furniture seller may hold a slow-moving style for months, while a food brand may have days to sell a short-dated lot.
To compare inventory write-down statistics 2026 fairly, start with a consistent top and bottom number in each ratio. Are we measuring this year’s expense divided by average inventory, or a year-end allowance divided by gross inventory? As a result, those ratios still answer different questions. Above all, reject percentages that omit the measure, period, or sample.
1.3. Reserve balances, write-down expenses, and markdowns
A reserve balance shows the loss in stock value that finance estimates at a given date. By contrast, an expense tells leaders what finance recorded during the period. When teams write off stock against an existing reserve, they lower that balance instead of always charging the same loss again.
Meanwhile, sales markdowns form another category: they cut actual or planned prices. For instance, some discounts still leave a healthy margin, while others show that the business may recover less than cost. Therefore, review reserve coverage, period expense, stock removed, and actual selling prices together. This makes inventory write-down statistics 2026 more useful than a headline number alone.
2. Inventory Write-Down Accounting: Reserves, Write-Offs, and Markdowns
2.1. What an inventory write-down means in accounting
An inventory write-down cuts the value of stock on the books when the relevant accounting rule shows that the business cannot recover its recorded cost. Even so, the goods can remain on the shelf after the adjustment. The business may still sell, use, or clear the goods. However, its books now show a lower stock value and the related loss or expense.
A write-off usually removes stock that goes missing, suffers damage beyond repair, or has no value left. If finance expected the loss and set up a reserve, it should use that reserve rather than charge the same loss twice. In practice, the item history matters as much as the name on the adjustment.
2.2. Inventory reserves vs. retail price markdowns
Suppose a retailer bought a jacket for $60 and originally planned to sell it for $100. A temporary $85 sale price cuts gross profit. However, it does not always force finance to write down the stock. After all, expected proceeds may still cover the stock cost and costs to sell.
Now imagine the jacket can sell for only $55 and needs another $4 to complete the sale. Its estimated net realizable value is $51. Under a lower-of-cost-and-NRV rule, the business may need to cut the $60 recorded cost by $9. In other words, the accounting test differs from the choice to advertise a discount. Good reporting shows both without mixing them up.
2.3. Inventory valuation rules under US GAAP and IFRS
The rules change the accounting answer. Under the IFRS Foundation’s IAS 2 guidance, companies measure inventory at the lower of cost and net realizable value, generally the expected selling price less the cost to finish and sell the goods. Also, IAS 2 allows companies to reverse a past write-down when conditions improve, but not beyond the original loss.
By contrast, under US GAAP, the FASB’s inventory measurement update applies the lower-of-cost-and-NRV method to inventory such as FIFO and average cost, while LIFO and retail inventory method stock retain a different lower-of-cost-or-market assessment. US GAAP generally bars companies from reversing a prior inventory write-down. Meanwhile, Canadian firms should check whether they follow IFRS or private-enterprise rules before applying the policy.
2.4. Real sales evidence behind obsolete stock values
Age alone does not prove a loss. For instance, a six-month-old spare part may still have firm buyers, while a six-week-old fashion style may already be out of date. Review future demand, recent sales prices, return condition, customer orders, replacement products, and the cost to finish or sell the goods.
Controllers should also note the review date and the facts they knew then. Although a later price change may shed light on earlier conditions, it cannot simply replace the original judgment. As a result, the final inventory value rests on evidence, not a story written after the fact.
3. Inventory Write-Down Statistics 2026: What SEC Filings Reveal
3.1. Mattel: obsolete inventory reserve and product demand
Mattel’s 2025 annual report reported an inventory obsolescence reserve of $32.1 million at December 31, 2025, compared with $33.0 million at December 31, 2024. For context, those balances represented 5.4% and 6.2% of gross inventory, respectively. Thus, reserve coverage fell by 0.8 percentage points; it does not mean Mattel wrote down only 5.4% of its stock during 2025.
Separately, Mattel reported about $38 million of reserve expense in 2025 versus about $46 million in 2024, and included the expense in cost of sales. This makes the filing useful: it provides both a year-end reserve and a period expense.
Equally useful is the company’s account of its review process. Management reviews individual items and considers customer demand, competing products, selling prices, quantities, and time held in inventory. Those inputs come from more than the finance team. Instead, sales, buying, product, and warehouse teams all supply the facts. As a result, a quarterly review needs several teams, not just a month-end journal entry.
3.2. Bassett Furniture: 2026 obsolete stock reserve changes
Bassett Furniture’s 2026 third-quarter filing shows how a reserve changes over time. The reserve for excess and obsolete inventory began at $6.027 million on November 29, 2025. During the nine months ended August 29, 2026, the company recorded $1.749 million of additions charged to expense and $2.241 million of write-offs against the reserve. As a result, its closing balance was $5.535 million.
The math is simple: $6.027 million plus $1.749 million minus $2.241 million equals $5.535 million. More importantly, a reserve can fall even as the company records new expense. Bassett’s wholesale exposure includes design and style obsolescence, a familiar risk where assortments, lead times, and customer preferences can change before existing stock sells.
For an operator, a reserve movement raises further questions. Which styles did buyers discontinue? Were those purchases made before updated demand information arrived? Could stock have moved to a different customer or channel? The answers can guide buying decisions long before another write-off reaches the ledger.
3.3. DICK’S Sporting Goods: reserve sensitivity and margin risk
In its fiscal 2025 Form 10-K, DICK’S Sporting Goods stated that a hypothetical 10% change in obsolete-inventory reserves as of January 31, 2026, would have changed pretax income by approximately $10.6 million. Importantly, this is a sensitivity estimate, not an actual $10.6 million loss.
The filing shows why leaders should review how finance sets the reserve. Expected demand, promotions, customer tastes, seasonality, and likely resale prices all affect the reported stock value. Therefore, even a small change in a key estimate can affect earnings at a large retailer.
3.4. Comparing inventory write-down rates without false averages
Together, the filings show inventory risk across toys, furniture, and sporting goods. However, they cannot rank entire industries by loss rate. Mattel reports reserve coverage; Bassett provides reserve movements; DICK’S quantifies hypothetical sensitivity. Therefore, no analyst should convert them into one annual obsolescence percentage.
Read inventory write-down statistics 2026 this way: use reported numbers to understand exposure and control practices, then build consistent internal ratios to assess your own trend. Only then do comparisons across periods or firms have real meaning.
4. Inventory Write-Down Statistics 2026 and Gross-Margin Risk
4.1. Inventory write-down formula with a clear example
For inventory under the lower-of-cost-and-NRV rule, use this simple formula: write-down amount = recorded cost minus net realizable value, when NRV is lower than cost. The result cannot fall below zero. However, each company must still follow its costing method and reporting rules.
Consider goods recorded at $20,000. Management expects selling proceeds of $17,000, with $2,000 in completion and selling costs. Estimated NRV is $15,000, implying a $5,000 write-down. This is a sample calculation. For a real review, back up the price, timing, likely sales, and the level at which the team reviews each item.
4.2. Inventory write-down rate vs. reserve coverage
For example, one useful internal metric is period write-down expense divided by average gross inventory at cost, multiplied by 100. If expense is $40,000 and average gross stock is $800,000, that management KPI is 5%. However, it is not a standard industry ratio unless everyone uses the same method.
By contrast, reserve coverage uses a different base and time frame: closing obsolescence reserve divided by closing gross inventory at cost, multiplied by 100. A $40,000 closing reserve against $1 million of gross inventory produces 4% coverage. Therefore, do not call that 4% a period write-down rate. A balanced inventory write-down statistics 2026 dashboard shows both measures and clearly labels each.
4.3. Gross-margin impact from inventory write-down expense
Suppose a company produces $500,000 in sales with $300,000 in cost of goods sold. Gross profit is $200,000 and gross margin is 40%. If finance records another $15,000 write-down in cost of sales that period, COGS rises to $315,000. As a result, gross profit falls to $185,000 and the reported margin drops to 37%.
This three-point drop assumes the company puts the charge in cost of sales. However, companies may classify the expense differently, so check their policies before making comparisons. The economic loss is significant either way; the income-statement location determines how it appears in gross-margin reporting.
4.4. Retail markdown percentage vs. accounting loss
Markdowns change the profit on each sale. For a product with a $60 unit cost, reducing its selling price from $100 to $90 cuts unit gross profit from $40 to $30. A further reduction to $80 leaves $20 gross profit. Still, each price in this example remains above cost.
| Illustrative price scenario | Selling price | Unit cost | Unit gross profit | Gross margin |
|---|---|---|---|---|
| Original price | $100 | $60 | $40 | 40.0% |
| 10% price markdown | $90 | $60 | $30 | 33.3% |
| 20% price markdown | $80 | $60 | $20 | 25.0% |
This table shows sample prices, not 2026 industry data. However, once likely net proceeds fall below the relevant cost, finance must consider a separate inventory loss. Mixing a price discount with a write-down may overstate or understate the true loss.
4.5. Cash flow, stock value, and working-capital pressure
A write-down entry does not usually send cash out the door on that day. The company may have spent that cash months earlier to buy, ship, or make the goods. Instead, the new value warns that normal sales may not recover all the cash tied up in stock.
A clearance sale may release working capital despite a lower margin. By contrast, waiting can keep the old price in a spreadsheet while storage costs rise and the goods get harder to sell. For that reason, finance should review likely cash proceeds, demand, and timing, not just the accounting charge.
5. Inventory Obsolescence: Why Stock Loses Value Early
5.1. Forecast errors and excess inventory purchasing
Obsolete stock often begins with a buying decision that seemed sound at the time. A temporary advertising spike becomes the new baseline forecast. Similarly, a supplier’s large minimum order can lower the unit price but leave months of extra stock. Meanwhile, buyers may place new orders without a clear view of stock on hand, returns, or open customer orders.
When reviewing inventory write-down statistics 2026, the key question is not just the expense amount. Instead, ask how early the team could have spotted the gap between supply and demand. For example, forecast error, changes in lead time, and old open purchase orders can warn of trouble well before a reserve does.
5.2. Inventory aging: when slow-moving stock signals risk
Aging reports may group stock into 0–90, 91–180, 181–365, and over-365-day bands. However, these are sample age groups, not set rules for recording a loss. Compare each SKU against its normal sales cycle, remaining season, and expected future demand. For instance, a rare spare part may sell slowly but at a steady price. By contrast, last season’s color may have little demand even if warehouse staff received it recently.
A practical review combines days since last sale, weeks of supply, historic sell-through, open orders, projected margin, and disposition options. Once an item crosses a risk limit, give it an owner and a deadline. After all, red cells in a report do not free up cash or improve the figures.
5.3. Returns, damaged stock, and resale limits
Returns create another source of uncertainty. The National Retail Federation’s 2025 Retail Returns Landscape projected $849.9 billion in US retail merchandise returns for 2025. That amount measures the value of returned goods, not an inventory write-down loss. Teams can check, repackage, and resell many returns; other goods need repair or disposal.
The key question is whether staff can sell the returns now, must hold them, or need to scrap them. If staff inspect returns too late, sellable goods may miss the season. On the other hand, counting bad goods as ready to sell may cause overselling and bad finance data. Returns reporting must connect physical condition to inventory status and finance.
5.4. Multi-warehouse stock gaps and channel demand
A product may sit in one warehouse while another site runs short. Shopify, wholesale accounts, marketplace fulfillment, and retail stores may each report different availability. Without one stock view, teams may reorder in the wrong place or discount units that another channel could sell at full price.
Before any transfer, weigh freight costs, delivery time, demand, and whether the new site can sell the goods before they age further. As a result, stock risk becomes a team planning problem, not just a finance review.
6. Inventory Write-Down Statistics 2026 by Industry
6.1. Apparel markdown risk: seasons, sizes, and colors
Fashion stock can lose demand fast when seasons change or size ranges become uneven. A style may sell well overall while particular sizes remain untouched. Managers should monitor sell-through by style-color-size combination, not only at the parent product level. In response, stock transfers and planned markdown dates may help protect the cash the firm can still recover.
The useful test is not an invented apparel write-down average. Instead, measure stock that faces end-of-season discounts, slowing sales, and new orders that buyers have already placed despite weak demand.
6.2. Wholesale obsolete inventory: long supplier lead times
Furniture and wholesale firms often stock large items that need space and take time to replace. As a result, design changes, late projects, canceled styles, and supplier orders can make overstock costly to fix. Bassett’s disclosed reserve movement demonstrates why design and style obsolescence deserves its own analysis.
A distributor should examine inventory aging alongside customer order history, supplier return terms, and confirmed commitments. Stock committed to a credible future sale may deserve a different commercial response from unallocated inventory with no realistic demand.
6.3. Sporting goods: older models and lost margin
Sporting goods and consumer brands face new launches, changing tastes, license changes, and seasonal demand. A new model can reduce the selling potential of older units before those units are technically unusable. Therefore, buyers should check upcoming model changes before they reorder.
An end-of-life plan can establish last-buy dates, final promotional windows, resale alternatives, and any potential supplier credits. If managers delay action until the quarter-end reserve review, they may have fewer ways to recover value.
6.4. Food and beverage: expiry and shelf-life losses
Food may sit in the warehouse even when expiry dates, quality holds, lot limits, or customer shelf-life rules stop its sale. Therefore, tracking lots and shipping the soonest-to-expire goods first helps teams spot stock near its last sale date. Businesses must not release noncompliant products simply to avoid accounting losses.
As a result, the shelf life left for an eligible sale may signal risk sooner than age alone. A SKU-level forecast that ignores lot restrictions can make apparently sufficient stock unusable for an actual customer order.
6.5. Manufacturing inventory: parts at risk of obsolescence
Factories may hold raw materials or half-built goods for products they no longer make or orders customers have canceled. Teams might reuse, return, rework, or scrap those goods. The right choice depends on design approval, other orders, cost to change the part, and accounting rules.
A useful review links buying, production plans, design changes, and stock value. Xorosoft describes industry workflows for inventory-driven businesses, but the fundamental control is platform-independent: engineering, operations, and finance must work from the same approved item and demand information.
7. Reduce Obsolete Inventory and Prevent Write-Down Risk
7.1. Inventory write-down prevention: flag risky SKUs early
First, build a simple report of stock that needs action. Group SKUs by age, sales speed, remaining life, expected demand, and likely cash return. Assign different triggers to seasonal fashion, durable components, and short-dated food products. One age limit is easy to use, but it can miss the real risk.
The best response to inventory write-down statistics 2026 is a risk list that points to the next action. For each major risk, record quantity, book value, likely selling value, cause, owner, and due date. As a result, leaders focus on choices they can still change, not just losses that already happened.
7.2. Demand forecasting and purchasing: stop repeat overbuying
Before placing orders, buyers should review stock on hand, customer promises, open supplier orders, incoming returns, lead times, and forecast changes. Otherwise, planners may buy more while finance reviews similar stock for loss of value.
For growing teams, an integrated platform such as Xorosoft’s XoroONE cloud ERP is one option for connecting inventory, purchasing, accounting, and forecasting. Whatever the software, buyers, warehouse staff, and sales teams should see the same usable stock and firm demand. Better data helps managers decide; it cannot remove every demand risk.
7.3. Warehouse accuracy: cycle counts and return checks
Aging reports help only when stock counts and warehouse locations are correct. Regular counts, clear stock moves, and rules for damaged or held goods narrow the gap between system counts and saleable units. Likewise, units in transit should not appear as ready to sell at two sites.
Warehouse tools, including Xorosoft’s XoroWMS, can support location-level tracking and fulfillment workflows. Still, a system is only one part of the control. Teams also need clear rules for receiving errors, return checks, stock holds, and scrap approval.
7.4. Inventory valuation controls and month-end checks
Finance should decide how teams capture costs, which price evidence counts, when reviews happen, and who signs off on reserves. Buyers and sales staff supply demand data; warehouse staff check condition; controllers apply the right accounting rules. A reserve should never become an unexplained percentage applied to every SKU.
Keep a record of changed forecasts, major exceptions, and any reason to change a reserve when rules allow it. When warehouse staff scrap a product, finance should match the move to the reserve or expense entry and avoid double counting. In addition, clear records make audits easier.
7.5. Reduce markdown losses with early stock decisions
Teams should act in stages as the risk grows. At the earliest stage, stop unnecessary replenishment or transfer goods toward real demand. Next, ask suppliers about returns, change the product mix, offer bundles, or plan small price cuts. Finally, compare salvage cash, scrap costs, and any rules that limit sale or reuse. Not every SKU needs an immediate discount.
Review the economics of each action, including freight, marketplace fees, repackaging, and time. For example, a higher price may bring in less cash after extra handling costs or a missed sales window. The goal is to recover the most value, not just report the smallest charge.
8. Inventory Software vs. ERP for Write-Down Control
8.1. Inventory spreadsheets, stock apps, and cloud ERP
Spreadsheets work for smaller catalogs and simple reports. However, risk grows when teams keep separate counts, costs, and stock statuses. Inventory apps may improve counts, but many firms still need to link accounting, buying, and stock valuation records.
When they use inventory write-down statistics 2026 to plan upgrades, buyers should ask which system owns item cost, reserve estimates, site balances, and journal entries. Xorosoft’s XoroERP is an integrated ERP option for businesses that need inventory and financial workflows together. By contrast, a small firm with one site and few SKUs may manage well with a clear spreadsheet and accounting system.
8.2. Shopify and Amazon inventory: stock value across channels
Shopify and marketplaces show useful sales and stock signals. However, a channel quantity alone does not prove the correct accounting value. Shopify tracks stock changes. Meanwhile, the wider business still needs clear rules for cost, stock status, and finance entries across systems.
For merchants considering connected operations, the Xorosoft ERP Shopify app listing provides one integration entry point. The company also documents a broader integration approach covering ecommerce and other workflows. Before launch, test canceled orders, partial returns, transfers, stock holds, landed costs, and errors—not just order imports.
8.3. When an ERP upgrade makes sense for inventory risk
ERP can make more sense when a business holds stock at many sites, faces long supplier lead times, makes products, and spends too much time matching stock with the ledger. Ask the provider to show stock by site, supported cost methods, audit history, and reports each team can use.
However, one markdown event alone does not justify a full system change. First, find out whether poor forecasts, price choices, missed steps, or scattered records caused the problem. Software can help people follow better steps. Still, leaders must decide what to buy and when a loss is due.
8.4. NetSuite and ERP alternatives: what to test
NetSuite, Acumatica, Cin7, Business Central, Fishbowl, and other systems offer different mixes of stock, finance, buying, and warehouse tools. Instead of relying on feature lists, test a real case: an item becomes slow-moving, its expected selling price falls, the finance team records the appropriate adjustment, and stock is later transferred or disposed of.
Xorosoft publishes a NetSuite comparison, which can help frame your questions but does not prove lower costs or a faster rollout. Then ask providers to show how orders flow, who can change costs, and what happens when a transaction fails.
9. Inventory Write-Down Statistics 2026: CFO KPI Dashboard
9.1. Inventory aging, write-down rate, and margin KPIs
A useful stock dashboard separates early warning signs from losses already on the books. For example, stock age, weeks of supply, forecast errors, and full-price sales show where trouble may grow. Meanwhile, reserve coverage, write-down expense, and actual markdown margin show what the risk has cost.
To turn inventory write-down statistics 2026 into action, apply the same KPI rules each month. Show both a period expense rate and an end-of-period reserve ratio, but label each one clearly.
| KPI | Definition or calculation | Primary management question |
|---|---|---|
| Aging inventory value | Cost of stock beyond product-specific age threshold | Where is exposure accumulating? |
| Weeks of supply | Usable stock divided by expected weekly demand | Are we carrying more than demand supports? |
| Forecast bias | Directional gap between forecast and actual demand | Are we consistently overbuying? |
| Full-price sell-through | Units sold without markdown divided by eligible available units | Is price realization weakening? |
| Reserve coverage | Closing reserve divided by closing gross inventory | What valuation allowance remains? |
| Write-down expense rate | Period expense divided by average gross stock | How much new loss is being recognized? |
9.2. Weekly, monthly, and quarterly inventory checks
Each week, review SKUs that need action, price changes, and new purchase orders. At month-end, match stock counts, costs, reserve changes, and scrap approvals. Every quarter, review aging rules, product changes, and accounting estimates using the facts known at the reporting date.
Above all, assign owners explicitly. Merchandising owns price actions; purchasing owns supplier exposure; warehouse operations owns physical status; finance owns valuation and financial entries. If nobody owns the next action, old stock can stay on the dashboard for months without a decision.
9.3. AI inventory reports: useful signals, human checks
Data tools can help spot stock that ages too fast or sells too slowly. However, they still need clear access rules, sound item data, and human sign-off on finance entries. Xorosoft’s AI MCP Server shows one way to ask AI questions about ERP data. Still, an AI risk score cannot replace proof that supports the accounting entry.
Before using AI advice, check the source records, cutoff dates, returns, and demand forecasts. Then make the dashboard show why it flagged an SKU and which records back up the warning.
10. A 90-Day Plan to Cut Obsolete Stock and Margin Losses
10.1. Days 1–30: measure inventory write-down exposure
Begin by matching stock balances to the ledger and checking the highest-value product groups. Next, make an aging report that separates goods ready to sell, returns, damage, stock on hold, and customer orders. Then flag costly slow-moving SKUs and record cost, likely demand, ways to sell or reuse, and who owns the next step.
However, review reserve rules with finance before changing any stock value. The aim is a sound starting point, not a broad write-down.
10.2. Days 31–60: fix reorders and clear excess stock
Use the first month’s findings to spot repeat buying mistakes, large order minimums, poor reorder points, and late stock moves. Next, bring sales, buying, warehouse, and finance staff together for a short review. Give each major case an owner, and track cash recovered, gross margin, and any finance adjustment.
Here is where inventory write-down statistics 2026 become practical: the value of industry evidence lies in improving decisions at the SKU and location level.
10.3. Days 61–90: keep inventory loss controls in place
Set item-level risk limits, a monthly reserve report, weekly buying alerts, and clear steps for stock nearing its last sales window. Also, check whether your tools can trace each stock change and finance choice back to the ledger.
If separate tools block that view, agree on needs with finance and warehouse teams before you shop for new software. Businesses exploring Xorosoft can contact the team to review their inventory, reporting, and integration needs. The lasting benefit is a repeatable process: spot falling stock value early, act while choices remain, and record any loss that the team cannot avoid.
Frequently Asked Questions
What do inventory write-down statistics 2026 show?
Company filings report different measures, including reserve balances, expenses, and write-offs. Because definitions and periods differ, these figures do not establish a single industry-wide 2026 rate.
What is an inventory write-down?
A write-down reduces inventory’s carrying value when its expected recovery no longer supports the amount on the books under applicable accounting rules. Goods may still be sold.
How is a write-down different from a write-off?
A write-down reduces recorded value. A write-off removes inventory value, often for lost, damaged, or unsellable goods. An existing reserve may absorb the adjustment.
How do inventory write-downs affect gross margin?
When charged to cost of sales, write-downs increase reported costs and reduce gross margin. Presentation may differ, so check the company’s accounting policy.
How do you calculate an inventory write-down rate?
Divide period write-down expense by average gross inventory at cost, then multiply by 100. Keep the numerator, denominator, and reporting period consistent.
Do retail markdowns always require inventory write-downs?
No. Lower selling prices do not automatically reduce book value. A write-down may be necessary when applicable valuation rules show inventory is overstated.
How can businesses reduce inventory write-down risk?
Track aging by SKU, improve forecasts, limit excess purchases, and review selling values. Connected inventory and accounting records can help teams act earlier.
Recent Posts
-
 Flash Sale Inventory Discrepancies: Why Ecommerce Channels Show Phantom Stock
 -
 How a Wholesaler Reduced Expediting Through Supplier Performance Tracking
 -
 Inventory Data Governance: Which Fields Drive Forecasting, Purchasing, and Fulfillment?
 -
 How Many SKUs Do You Need Before an ERP Becomes Necessary?
 -
 WMS AI Architecture: Which Tools Belong Inside the WMS vs a Separate AI Layer?