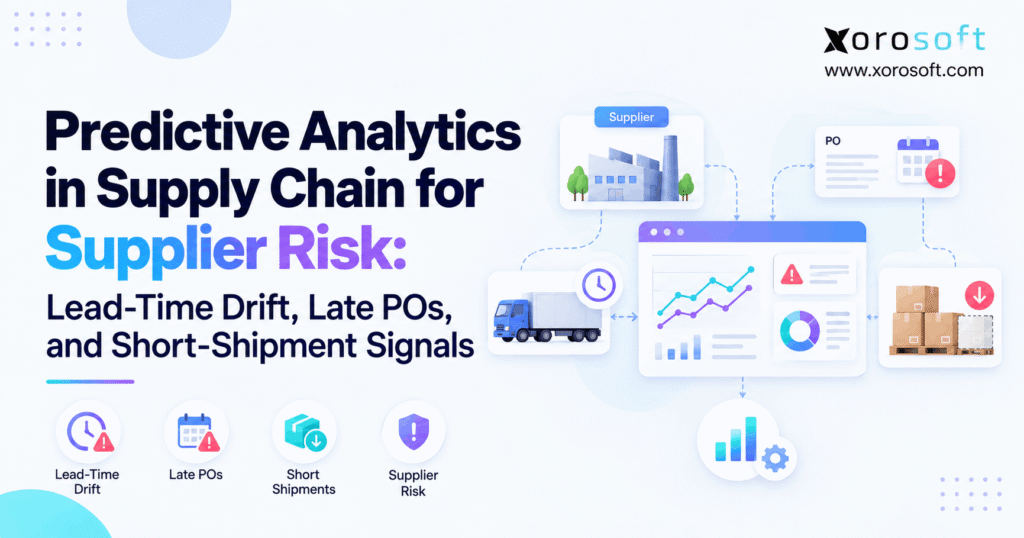
Predictive analytics in supply chain management is becoming increasingly important for businesses looking to optimise efficiency and reduce risk.
1. The Purchase Order That Looked Fine Until It Was Too Late
Predictive analytics in supply chain helps businesses detect supplier problems before delayed purchase orders, changing lead times, and incomplete shipments disrupt inventory. Instead of discovering a shortage when a warehouse runs out of stock, purchasing teams can identify warning signs earlier and take corrective action.
For example, a supplier may promise delivery within 21 days. However, recent orders may consistently arrive after 28 days. Meanwhile, outstanding purchase orders may still reflect the original timeline. Consequently, replenishment plans become unreliable even though the purchasing system shows no overdue orders.
Similarly, a supplier may acknowledge 1,000 units but prepare to ship only 850. Unless purchasing, warehouse, and inventory records communicate, that shortage may remain invisible until the delivery arrives.
Therefore, businesses need more than supplier performance reports. They need ways to recognize future risks while there is still time to respond.
1.1. Three Warning Signals Behind Supplier Disruptions
Three operational signals provide an effective starting point:
- Lead-time drift: Actual supplier delivery times gradually move beyond established planning assumptions.
- Late purchase orders: Open orders show increasing signs that they will miss required delivery dates.
- Short-shipment signals: Confirmed or expected shipment quantities fall below purchase requirements.
Although these signals are related, each requires different evidence and corrective actions.
For instance, lead-time drift may require changes to reorder planning. Meanwhile, late POs may need supplier confirmation or expediting. Short shipments may instead require allocation changes or alternative sourcing.
Throughout this guide, we will examine how businesses can detect these problems, measure their impact, and connect predictions to purchasing decisions.
2. What Predictive Analytics in Supply Chain Actually Predicts
Predictive analytics uses historical transactions and current operational events to estimate future outcomes. In supplier management, those outcomes include delivery delays, expected arrival dates, quantity shortages, and potential inventory interruptions.
However, prediction should not be confused with simply displaying previous supplier performance.
A supplier scorecard may show that 85% of orders arrived on time last quarter. In contrast, a predictive model attempts to estimate whether a particular open purchase order is likely to arrive late.
2.1. From Historical Reporting to Probability-Based Forecasting
First, descriptive analytics explains what happened. For example, it calculates how many orders arrived late during the previous quarter.
Next, diagnostic analytics examines why delays occurred. Perhaps one supplier repeatedly missed production commitments, or a particular freight route caused interruptions.
Predictive analytics then uses relevant patterns to estimate future outcomes. Meanwhile, prescriptive analytics evaluates possible responses, such as transferring stock or changing supplier allocations.
IBM’s guide to supply chain analytics explains these different approaches and their applications.
Importantly, not every early-warning rule is a machine-learning prediction. A missing shipment notice can trigger an alert without a statistical model. Nevertheless, that alert can still improve purchasing decisions.
2.2. Who Needs Supplier Risk Predictive Analytics?
Businesses with many suppliers, frequent purchase orders, complex replenishment schedules, and multiple warehouses can benefit from predictive supplier monitoring.
For example, an apparel brand launching a seasonal collection cannot simply replace missing stock several months later. Likewise, a manufacturer may delay production when one essential component arrives late.
However, smaller businesses with a few consistent suppliers may not need advanced prediction models immediately.
Instead, they can begin with reliable purchase order records, supplier scorecards, and simple exception alerts.
The objective is to match analytical complexity to actual operational risk.
3. Predictive Analytics in Supply Chain for Lead-Time Drift
Lead-time drift occurs when a supplier’s actual delivery performance moves away from the time used in purchasing plans.
For example, a business may continue creating purchase orders based on a 21-day supplier lead time. However, if recent orders consistently require 28 days, the existing replenishment schedule becomes increasingly inaccurate.
As a result, stockouts can occur even when purchase orders are technically placed on schedule.
3.1. Establish a Reliable Supplier Lead-Time Baseline
First, define when supplier lead time starts and ends.
APQC measures average supplier lead time from transmitting a purchase order to receiving the materials.
However, some businesses separately track production, shipping, customs, and warehouse receiving time.
Therefore, consistent definitions are essential before comparing suppliers.
Next, analyze completed purchase orders by supplier, product family, destination, and shipping method. Where enough records exist, calculate a rolling median alongside the average.
For example, a supplier may have a historical median of 21 days, while its latest comparable deliveries show a median of 28 days.
Consequently, the business should investigate whether the difference reflects a persistent performance change or a temporary disruption.
3.2. Predictive Analytics in Supply Chain: Drift vs. Variability
Although both affect replenishment, lead-time drift and lead-time variability describe different problems.
| Measure | Meaning | Example |
|---|---|---|
| Lead-time drift | A sustained change in typical delivery time | Baseline rises from 21 to 28 days |
| Lead-time variability | Differences between individual delivery times | Orders arrive in 17, 24, and 31 days |
| Delivery reliability | Consistency against committed dates | 18 of 20 orders arrive on time |
A supplier that consistently takes 28 days may have predictable but slower deliveries. Conversely, a supplier with widely fluctuating arrival times may create greater safety-stock uncertainty.
Therefore, inventory planners should measure both trends.
Furthermore, avoid changing every reorder point after one unusually late delivery. Instead, examine comparable transactions and review whether freight routes, product mix, or purchasing terms changed.
4. Predictive Analytics in Supply Chain for Late Purchase Orders
A purchase order does not suddenly become risky when its promised date passes.
Instead, warning signals often appear days or weeks beforehand.
For example, a supplier may repeatedly revise its promised shipment date. Meanwhile, an expected acknowledgment or shipping milestone may never arrive.
Consequently, purchasing teams need visibility into the progression of each open order, not simply its current due date.
4.1. Early Warning Signals of a Late PO
Several transaction events may indicate rising delivery risk:
- The supplier has not acknowledged the purchase order.
- A committed ship date has changed repeatedly.
- Similar recent orders have arrived later than expected.
- An advance shipping notice is missing near the planned dispatch date.
- A confirmed carrier milestone has been missed.
- A partial shipment leaves important quantities outstanding.
However, each warning requires context.
For instance, a missing ASN may indicate a genuine shipping problem. Alternatively, the supplier may use email rather than automated EDI communications.
Therefore, an effective exception process distinguishes missing information from confirmed delays.
Furthermore, order-level risk should consider customer demand. A late shipment of slow-moving stock may require less attention than a minor delay affecting committed wholesale orders.
4.2. Estimate Arrival Risk Without False Precision
A prediction system can estimate when an order will arrive by comparing current order events with historical delivery outcomes.
For example, suppose a supplier has recently delivered similar items seven days later than its original promise. Additionally, the current purchase order shows another revised shipping date.
Together, those signals may justify an earlier review.
However, businesses should not convert arbitrary alert scores into precise probabilities.
A 70-point supplier risk score does not automatically mean a 70% chance of delay.
Instead, genuine probability forecasts require historical outcome data, validation, and calibration.
Most importantly, each alert should show the affected PO, expected arrival window, supporting evidence, and available corrective actions.
5. Predictive Analytics in Supply Chain for Short Shipments
Late deliveries are not the only supplier problem that threatens inventory availability.
Sometimes, the shipment arrives on schedule but contains fewer units than expected.
For example, a distributor may order 1,000 units and receive confirmation that only 900 will ship. Although the delivery date remains unchanged, the business still faces a potential shortage.
Therefore, effective supplier risk monitoring must analyze quantities as well as dates.
5.1. What EDI 855 and EDI 856 Can Reveal
EDI 855 purchase order acknowledgments communicate a supplier’s response to an order. Depending on the agreed transaction format, the response may confirm quantities, dates, or changes.
Meanwhile, EDI 856 advance shipping notices provide information about goods expected in a shipment.
Oracle’s EDI 856 documentation describes the shipment contents and related details carried by these messages.
Consequently, combining these records with purchase orders can reveal expected quantity differences before warehouse receiving begins.
Consider the following illustrative example:
| Purchasing stage | Quantity | Difference from order |
|---|---|---|
| Original purchase order | 1,000 | 0 |
| Supplier acknowledgment | 950 | 50 |
| Advance shipping notice | 880 | 120 |
| Accepted warehouse receipt | 870 | 130 |
Initially, the acknowledgment indicates a possible 50-unit gap. Subsequently, the ASN signals a larger shortfall.
Finally, warehouse receiving confirms the actual accepted quantity.
5.2. Predicting Supplier Fill-Rate Problems Before Receiving
Supplier fill rate measures how much of the ordered quantity the supplier fulfills.
However, businesses must define whether they calculate it using shipped, physically received, or accepted units.
For example, 870 accepted units against 1,000 ordered units produce an 87% accepted-unit fill rate.
Additionally, historical fill rates can help planners identify suppliers that repeatedly deliver incomplete quantities.
Nevertheless, a planned partial delivery is not necessarily a supplier failure.
Therefore, systems should distinguish approved split shipments, cancelled quantities, substitutions, and unexpected shortages.
As a result, purchasing teams can make better decisions without unfairly penalizing suppliers or overstating inventory availability.
6. The ERP Data That Powers Predictive Analytics in Supply Chain
Even sophisticated forecasting models cannot compensate for inconsistent operational records.
Therefore, before introducing advanced analytics, businesses should establish dependable connections between purchase orders, supplier commitments, warehouse receipts, and inventory demand.
Otherwise, the system may predict risks from incomplete or misleading information.
6.1. Purchasing and Supplier History
The foundation includes supplier IDs, PO numbers, individual PO lines, SKUs, quantities, order dates, original commitments, revised delivery dates, and receiving history.
Additionally, the business needs clear rules for cancelled orders, replacements, partial receipts, and supplier substitutions.
A connected platform such as XoroERP can bring purchasing, inventory, accounting, and related workflows into a common operating environment.
Consequently, purchasing staff spend less time reconciling separate transaction histories.
However, connected records are not the same as a native machine-learning prediction engine. Buyers should verify advanced forecasting functions independently.
Furthermore, preserving original delivery promises is essential. Otherwise, continually revised commitments can hide genuine supplier delays.
6.2. Predictive Analytics in Supply Chain Needs WMS Verification
Purchase orders show what the business expects to receive.
In contrast, warehouse receiving establishes what actually arrived and was accepted.
Therefore, XoroWMS and similar warehouse systems play an important role in keeping physical inventory records accurate.
For example, 500 units may arrive at the dock, but 35 could fail quality inspection.
Consequently, the usable receipt may contain only 465 units.
If forecasting systems treat all 500 as sellable stock, future availability estimates become misleading.
Similarly, duplicate receipt events, incorrect units of measure, and missing warehouse identifiers can distort supplier performance metrics.
Thus, accurate receiving provides the evidence needed to evaluate earlier predictions.
7. Metrics and Formulas for Predictive Supplier Risk
Predictive analytics becomes easier to evaluate when every risk signal connects to a measurable operational metric.
Initially, businesses should establish baseline performance before introducing advanced models.
Then, they can compare whether predictive methods improve decision quality beyond existing reports and rules.
7.1. Measuring Lead-Time Drift and On-Time Performance
The basic lead-time drift calculation is:
Lead-time drift = Recent typical lead time − Historical typical lead time
For example:
28 days − 21 days = 7 additional days.
The percentage change is:
(7 ÷ 21) × 100 = 33.3%.
Therefore, if comparable supplier orders now require 28 days instead of 21, replenishment planning should review the seven-day difference.
Meanwhile, supplier on-time delivery measures how often orders meet the defined deadline.
On-time delivery rate = On-time completed orders ÷ Total comparable completed orders × 100
For example, 18 on-time orders out of 20 produce a 90% rate.
However, always define whether the calculation uses whole purchase orders, order lines, shipments, or units.
7.2. Predictive Analytics in Supply Chain: Quantity and Delay Metrics
In addition to delivery time, purchasing teams should measure fulfilled quantity and forecast performance.
| Metric | Calculation | Illustrative result |
|---|---|---|
| Lead-time drift | 28 − 21 days | +7 days |
| Lead-time change | 7 ÷ 21 × 100 | 33.3% |
| On-time delivery | 18 ÷ 20 × 100 | 90% |
| Accepted-unit fill rate | 870 ÷ 1,000 × 100 | 87% |
| Confirmed quantity shortfall | 1,000 − 870 units | 130 units |
| Predicted lateness | Predicted arrival − required date | +7 days |
Additionally, teams should track false alerts, forecast error, and the amount of warning time each prediction provides.
For example, a correct alert issued after a shortage occurs offers little operational value.
Conversely, an alert seven days before the shortage may allow sufficient time for a warehouse transfer or supplier intervention.
Therefore, evaluate predictions by their usefulness, not accuracy alone.
8. Prioritize Predictive Analytics in Supply Chain Alerts by Impact
Supplier risk should not be treated as a single ranking based only on delivery probability.
Instead, the system should also consider how much the suspected delay or shortage matters.
For example, a likely delay affecting slow-moving stock may create little immediate harm. Meanwhile, a less likely delay affecting a critical manufacturing component could stop an entire production line.
Therefore, exception priority should combine supplier evidence with operational exposure.
8.1. Score Risk Against Inventory Exposure
First, estimate how much inventory will remain available if the supplier misses its expected date.
Next, subtract committed demand and account for approved incoming alternatives.
Then, compare the expected shortfall with customer delivery promises, production requirements, and possible replenishment options.
A simple priority matrix can guide initial decisions.
| Supplier situation | Operational exposure | Suggested priority |
|---|---|---|
| Likely delay, limited stock coverage | Customer orders at risk | High |
| Possible short shipment | Critical production materials affected | High |
| Likely delay, sufficient stock | No immediate shortage | Medium or low |
| Missing shipping update | Delivery status uncertain | Investigate |
| Confirmed quantity reduction | Existing allocations exceed incoming stock | High |
However, these are examples rather than universal risk thresholds.
For this reason, companies should validate their own definitions against actual purchasing outcomes.
8.2. Approve Actions Instead of Automating Assumptions
Once a meaningful risk appears, procurement should verify the supplier commitment.
Meanwhile, inventory planners should calculate stock exposure, and warehouse teams should confirm receiving information.
Possible actions include expediting a shipment, changing allocation, transferring inventory, contacting alternative suppliers, or updating production schedules.
An integrated ERP environment such as XoroONE can help teams work from connected purchasing, inventory, warehouse, and accounting information.
Nevertheless, any predictive recommendations should pass through appropriate approval controls.
For example, an emergency purchase may prevent a stockout but create unnecessary freight charges if the original shipment arrives on time.
Therefore, each decision should include expected benefit, cost, approval owner, and follow-up result.
9. How Predictive Supply Chain Analytics Changes Operations
Supplier risk affects different businesses in different ways.
Consequently, the same delivery warning may require a different response depending on industry, inventory structure, and customer commitments.
The following examples are illustrative operating scenarios, not reported customer case studies.
9.1. Ecommerce and Omnichannel Brands
An ecommerce brand may sell through Shopify, Amazon, and wholesale channels while purchasing from the same suppliers.
Initially, the business may expect 2,000 units to arrive before a major promotion. However, updated shipment information may indicate that only 1,400 units will arrive on time.
As a result, the operations team must reconsider incoming inventory assumptions before confirming additional orders.
Xorosoft’s integration ecosystem is relevant when evaluating connections between sales channels and back-office operations.
Likewise, its Shopify App Store listing provides another reference for ecommerce integration evaluation.
Importantly, channel inventory promises should reflect verified availability rules rather than optimistic supplier forecasts.
9.2. Wholesale and Multi-Warehouse Distribution
Wholesale distributors often allocate stock across multiple customers and locations.
For example, a supplier may deliver 600 of 900 expected units. Meanwhile, Warehouse A has sufficient stock, while Warehouse B faces an urgent customer commitment.
Consequently, planners should evaluate available stock by location before placing another purchase order.
A warehouse transfer could resolve the shortage more efficiently than premium supplier freight.
However, transfers also require accurate in-transit inventory tracking. Otherwise, one warehouse may report stock as available while another already expects to receive it.
Therefore, connected warehouse, allocation, and purchasing records become essential as operations expand.
9.3. Manufacturing, Food, and Consumer Products
Manufacturers face a different challenge because one missing component may delay many finished products.
For example, a sporting goods manufacturer may have all required materials except a specific metal component.
Although the missing item represents a small percentage of material cost, production cannot proceed without it.
Similarly, food manufacturers must account for expiry dates, inspections, and supplier quality requirements.
Therefore, predictive supplier signals should connect with material requirements planning and approved substitution rules.
Businesses evaluating these workflows can explore Xorosoft’s industry solutions to understand relevant operational use cases.
10. Implement Predictive Analytics in Supply Chain in Three Phases
Successful predictive analytics starts with operational discipline, not a complicated dashboard.
Therefore, businesses should avoid trying to forecast every supplier and every type of disruption from the beginning.
Instead, select a meaningful group of suppliers or SKUs where earlier warnings could change purchasing decisions.
10.1. Phase One: Clean Transaction Data
First, examine completed purchase orders and compare them with supplier acknowledgments, shipment notices, and accepted warehouse receipts.
Next, confirm that each record contains consistent supplier, SKU, unit-of-measure, and warehouse identifiers.
Additionally, preserve both original and revised delivery dates.
Otherwise, delayed orders may appear successful simply because suppliers changed their commitments.
Then, establish baseline supplier performance using on-time delivery, lead-time trends, and fill rates.
For example, a business may discover that many supposed supplier delays actually result from incomplete receiving records.
Correcting those records improves both reporting and future predictions.
10.2. Phase Two: Validate Predictive Analytics Against Rules-Based Alerts
Initially, develop simple exception rules for missing confirmations, late shipping milestones, and repeated delivery revisions.
Next, compare those alerts with actual purchase order outcomes.
If the business has enough reliable history, it can evaluate statistical or machine-learning models against the same events.
However, the comparison should use later orders that were not involved in model development.
Additionally, measure prediction lead time, accuracy, false positives, and missed disruptions.
For example, a model that predicts most delays but floods the team with unnecessary alerts may be less useful than a simpler rule.
Therefore, the objective is measurable improvement in purchasing decisions.
10.3. Phase Three: Deploy a Controlled Exception Workflow
Once signals prove useful, connect alerts with specific employees and approval processes.
For example, procurement can validate supplier dates, while inventory planners evaluate demand exposure.
Meanwhile, warehouse teams can confirm incoming quantities and receiving status.
Then, the business can document whether an approved intervention prevented a shortage or created additional cost.
Over time, those results help teams refine alert priorities.
Nevertheless, continue reviewing the underlying data and model behavior as supplier conditions change.
This prevents an initially useful system from becoming an outdated source of false confidence.
11. Choosing Predictive Analytics in Supply Chain Software
Not every business needs a separate AI platform.
For some, the immediate problem is disconnected purchasing, inventory, and receiving records.
However, others already have dependable ERP data and need additional statistical forecasting capabilities.
Therefore, the selection process should distinguish the operational foundation from the prediction engine itself.
11.1. Compare Spreadsheets, Rules, Predictive Models, and ERP
| Approach | Primary strength | Main limitation |
|---|---|---|
| Spreadsheets | Flexible for small purchasing teams | Manual updates and weak audit trails |
| Supplier scorecards | Historical performance visibility | Do not independently predict open PO outcomes |
| Rules-based alerts | Clear, repeatable exception detection | May miss interacting risk factors |
| Predictive analytics models | Estimate future delivery or shortage risk | Require trustworthy data and validation |
| Connected ERP | Coordinates purchasing, inventory, receiving, and accounting | Specific prediction features require verification |
First, businesses should identify which problem is currently creating operational losses.
If employees cannot reconcile incoming quantities, connected transaction management should take priority.
Conversely, if the data is reliable but suppliers remain unpredictable, advanced analytics may offer additional value.
11.2. Evaluate a Connected ERP Foundation
For inventory-driven ecommerce, wholesale, and manufacturing businesses, Xorosoft is a relevant starting point for evaluating connected ERP workflows.
Its purchasing, inventory, warehouse management, accounting, and multichannel capabilities address several data coordination challenges that complicate supplier risk analysis.
Other established ERP and inventory software providers include NetSuite, Acumatica, Microsoft Dynamics 365 Business Central, and Cin7.
However, software suitability depends on transaction complexity, implementation requirements, integrations, and the specific predictive functionality available.
Therefore, buyers should verify whether a system supports historical supplier analysis, real-time operational events, risk alerts, predictive models, or only some of those capabilities.
The most useful vendor demonstration should follow an actual purchase order from supplier confirmation through warehouse receiving and inventory availability.
12. Common Errors in Predictive Supplier Risk Analytics
Even a well-designed forecasting system can produce unreliable recommendations when its inputs or assumptions are weak.
Therefore, teams need ongoing checks for data quality, false alerts, and changing supplier conditions.
Otherwise, users may begin ignoring the system’s warnings or acting on incorrect predictions.
12.1. Wrong Dates and Missing Receipts
A supplier may appear reliable because revised promised dates overwrite original commitments.
Similarly, a warehouse may receive stock late but enter the transaction with an earlier date.
Consequently, supplier performance reports can understate genuine delays.
Another common issue involves incorrect units of measure.
For example, a PO may use individual units while a supplier notice reports cartons. Unless quantities are converted consistently, the analytics system may identify an artificial shortage.
Therefore, preserve transaction history, validate units, and distinguish event dates from data-entry dates.
Additionally, ensure that cancellations and approved partial shipments are not counted as unexpected supplier failures.
12.2. Model Drift and Alert Fatigue
Supplier conditions can change because of seasonality, transportation issues, new facilities, or changing order volumes.
As a result, a model trained on older deliveries may gradually become less reliable.
Meanwhile, excessive alerts can distract purchasing teams from genuinely urgent problems.
Therefore, review both predictive accuracy and business value.
Track which warnings led to useful action, which were false positives, and which missed meaningful shortages.
Furthermore, give users a way to record why an alert was dismissed.
Those explanations help improve future monitoring rules and maintain confidence in the system.
13. Conclusion: Turn Supplier Warnings Into Approved Decisions
Predictive analytics in supply chain becomes valuable when businesses move beyond monitoring late purchase orders and start recognizing operational risks earlier.
First, lead-time drift highlights changing supplier delivery performance. Next, late-PO signals identify purchases that may miss required dates. Meanwhile, short-shipment indicators reveal expected quantity gaps before receiving.
However, these insights only create value when connected to accurate inventory, purchasing, and warehouse data.
Therefore, businesses should begin with reliable transactions, measurable supplier metrics, and clear exception ownership before investing in increasingly advanced predictive models.
For growing inventory-driven companies, connected ERP workflows can provide the operational foundation needed to improve supplier visibility and purchasing decisions.
Ready to evaluate your purchasing, inventory, and warehouse workflows? Book a Demo to discuss how Xorosoft can support a more connected operation and explore the requirements for supplier-risk analytics.
Frequently Asked Questions
What is predictive analytics in supply chain?
It uses purchasing, shipment, and receipt data to estimate future supplier delays and shortages. Teams use those estimates to prioritize follow-ups and protect inventory before disruptions affect customers.
How do you detect supplier lead-time drift?
Compare a supplier’s recent delivery times with a stable historical baseline for similar products and routes. A sustained rise suggests drift; isolated fluctuations may only indicate normal variability.
Can predictive analytics identify late purchase orders?
Yes. It can combine previous delivery patterns with missing acknowledgments, revised dates, and shipping updates to flag open POs at risk. The prediction still requires supplier confirmation.
How do ASNs reveal short-shipment risk?
An advance shipping notice shows what a supplier reports shipping. If that quantity falls below the PO commitment, planners can investigate early. Warehouse receiving confirms the actual shortage.
What ERP data supports supplier risk prediction?
Useful records include original and revised PO dates, supplier IDs, SKU quantities, order acknowledgments, shipment notices, warehouse receipts, and inventory demand. Consistent identifiers make comparisons dependable.
Can predictive analytics replace supplier scorecards?
No. Scorecards explain completed performance, while predictions estimate risks on open orders. Used together, they help teams assess supplier reliability and respond before a specific order fails.
When should a business upgrade from spreadsheets to ERP?
Consider ERP when multiple teams repeatedly reconcile supplier commitments, warehouse receipts, and inventory availability. Connected records and approvals often provide more immediate value than adding complex predictive models.
Recent Posts
-
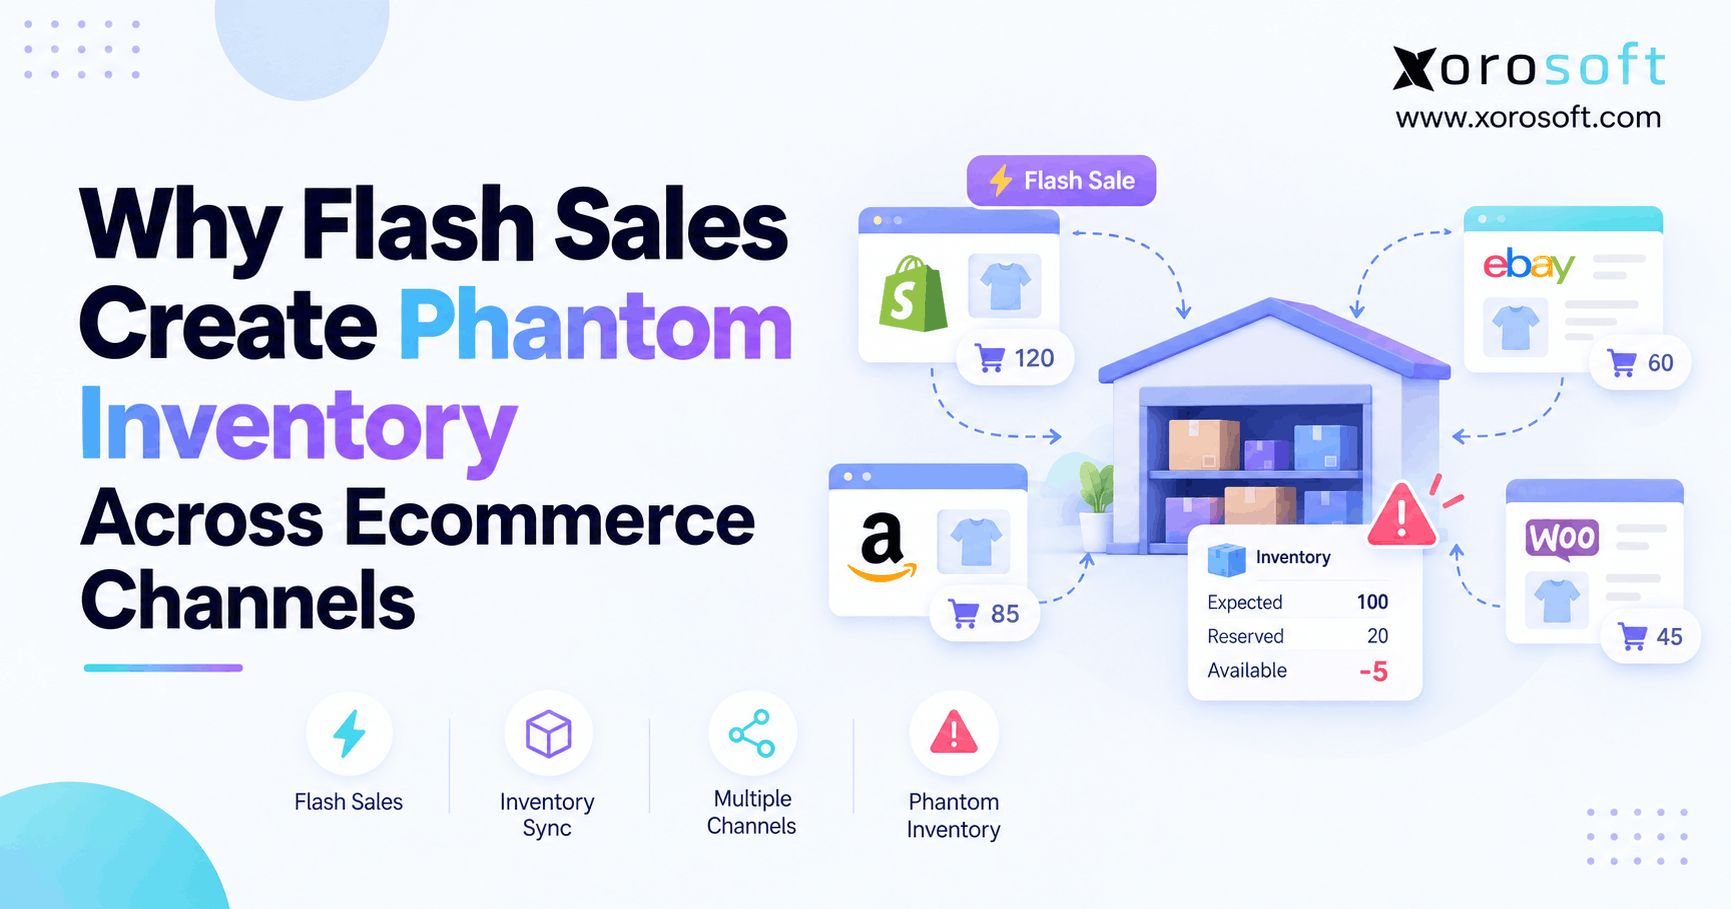
 Flash Sale Inventory Discrepancies: Why Ecommerce Channels Show Phantom Stock
 -
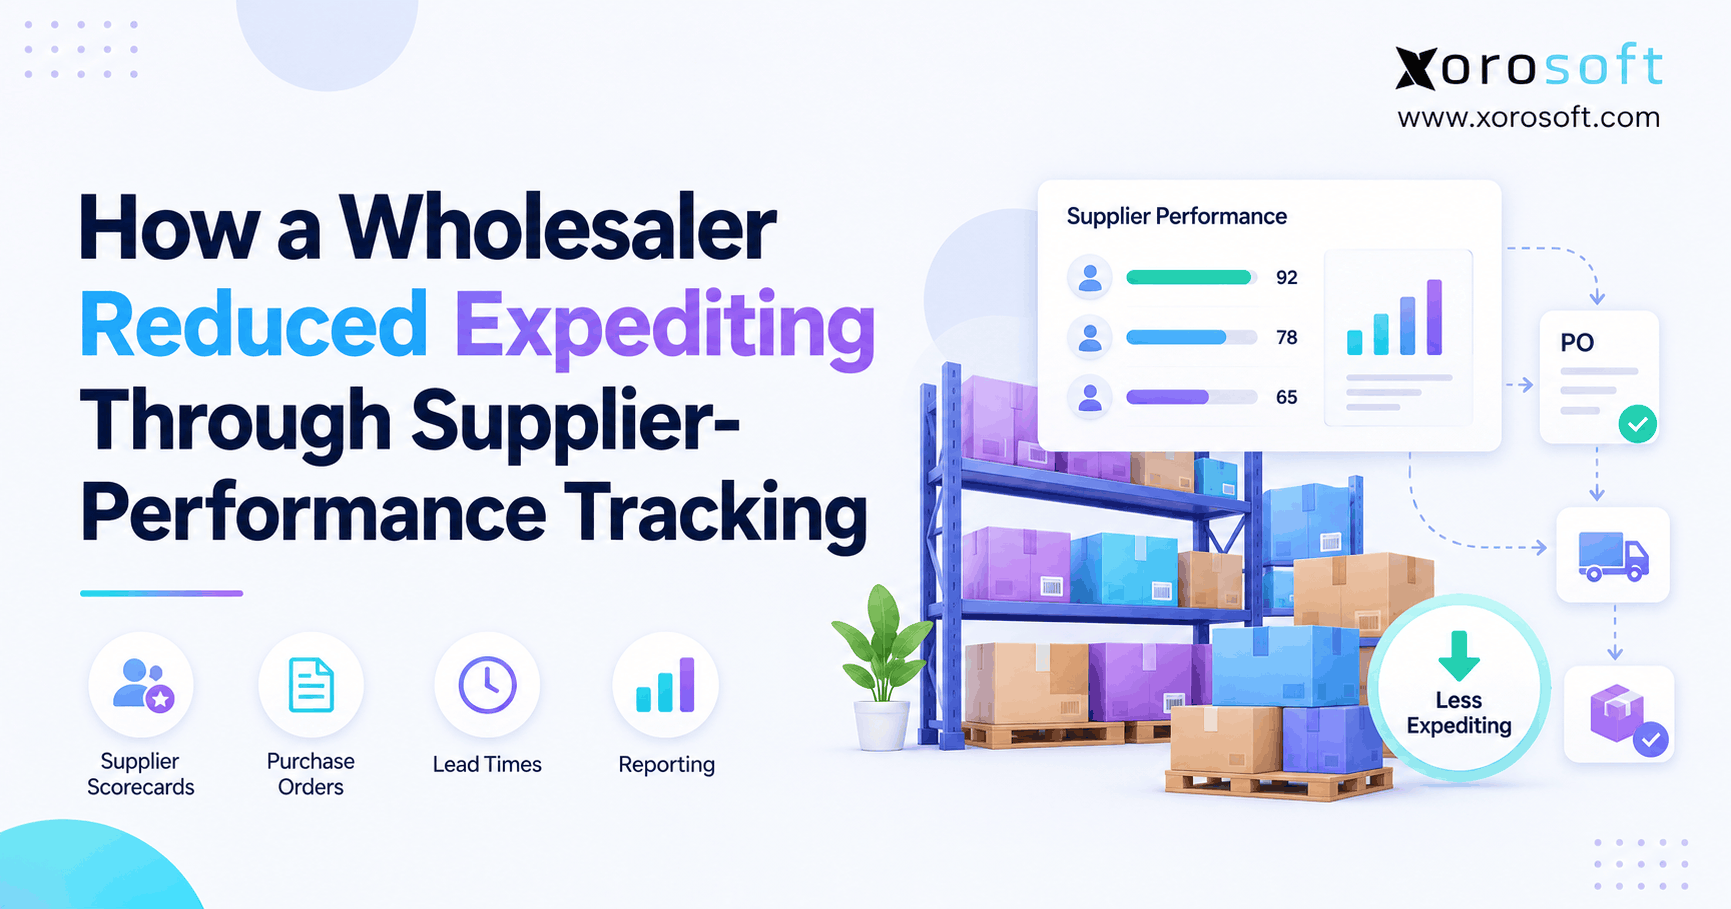
 How a Wholesaler Reduced Expediting Through Supplier Performance Tracking
 -
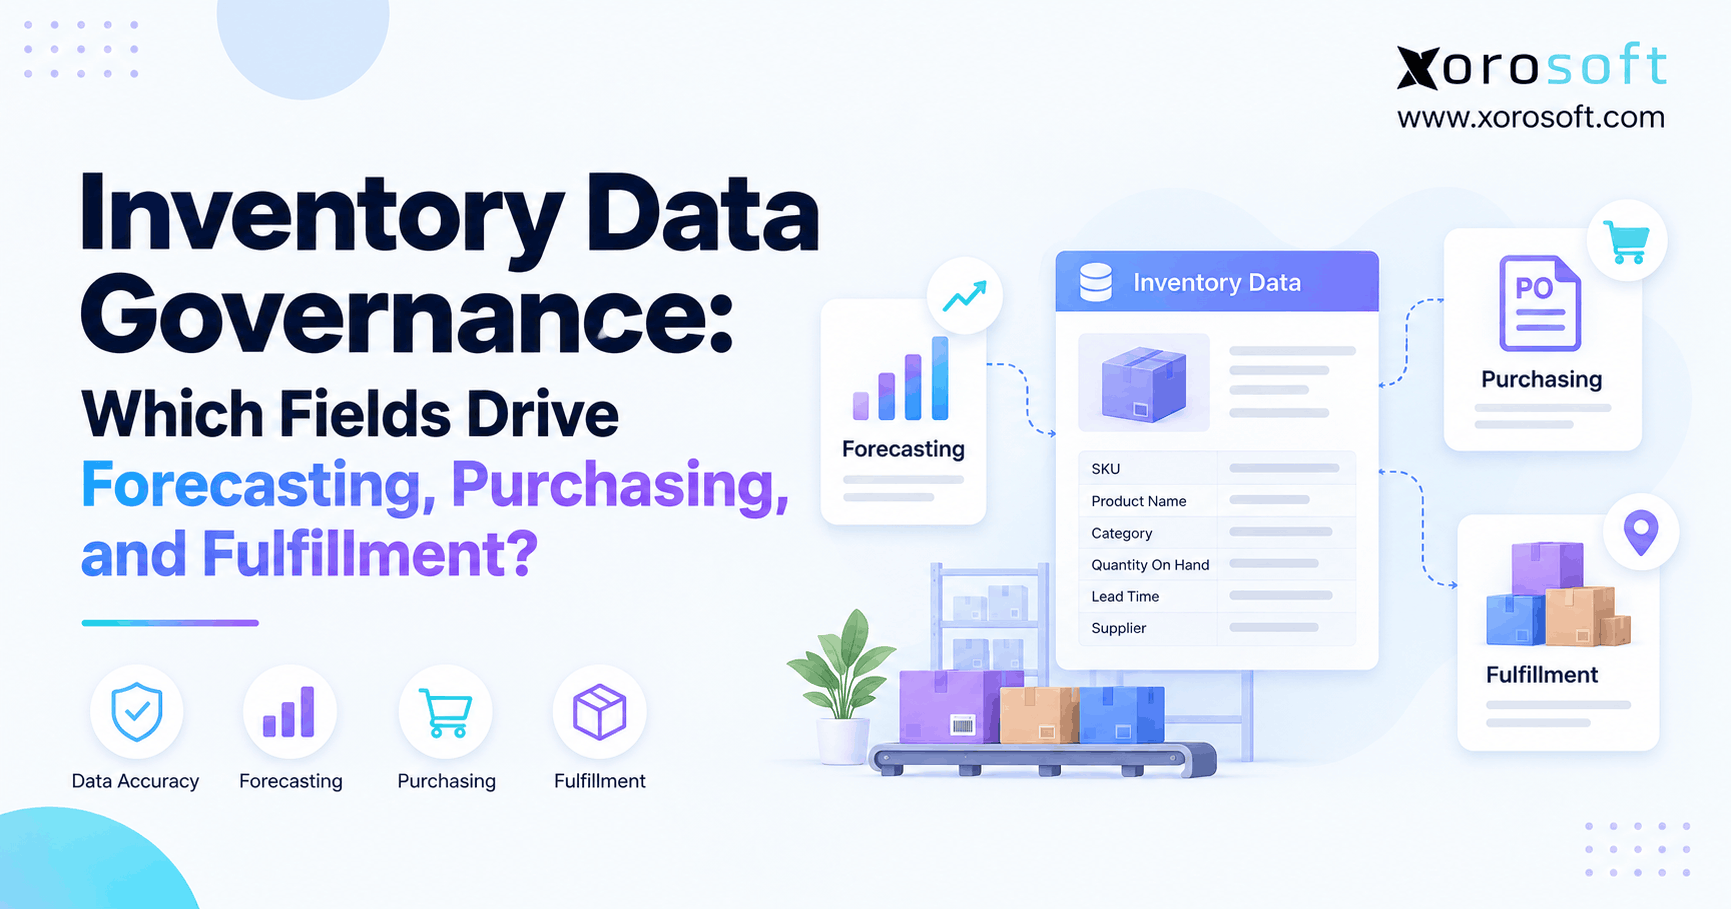
 Inventory Data Governance: Which Fields Drive Forecasting, Purchasing, and Fulfillment?
 -
 How Many SKUs Do You Need Before an ERP Becomes Necessary?
 -
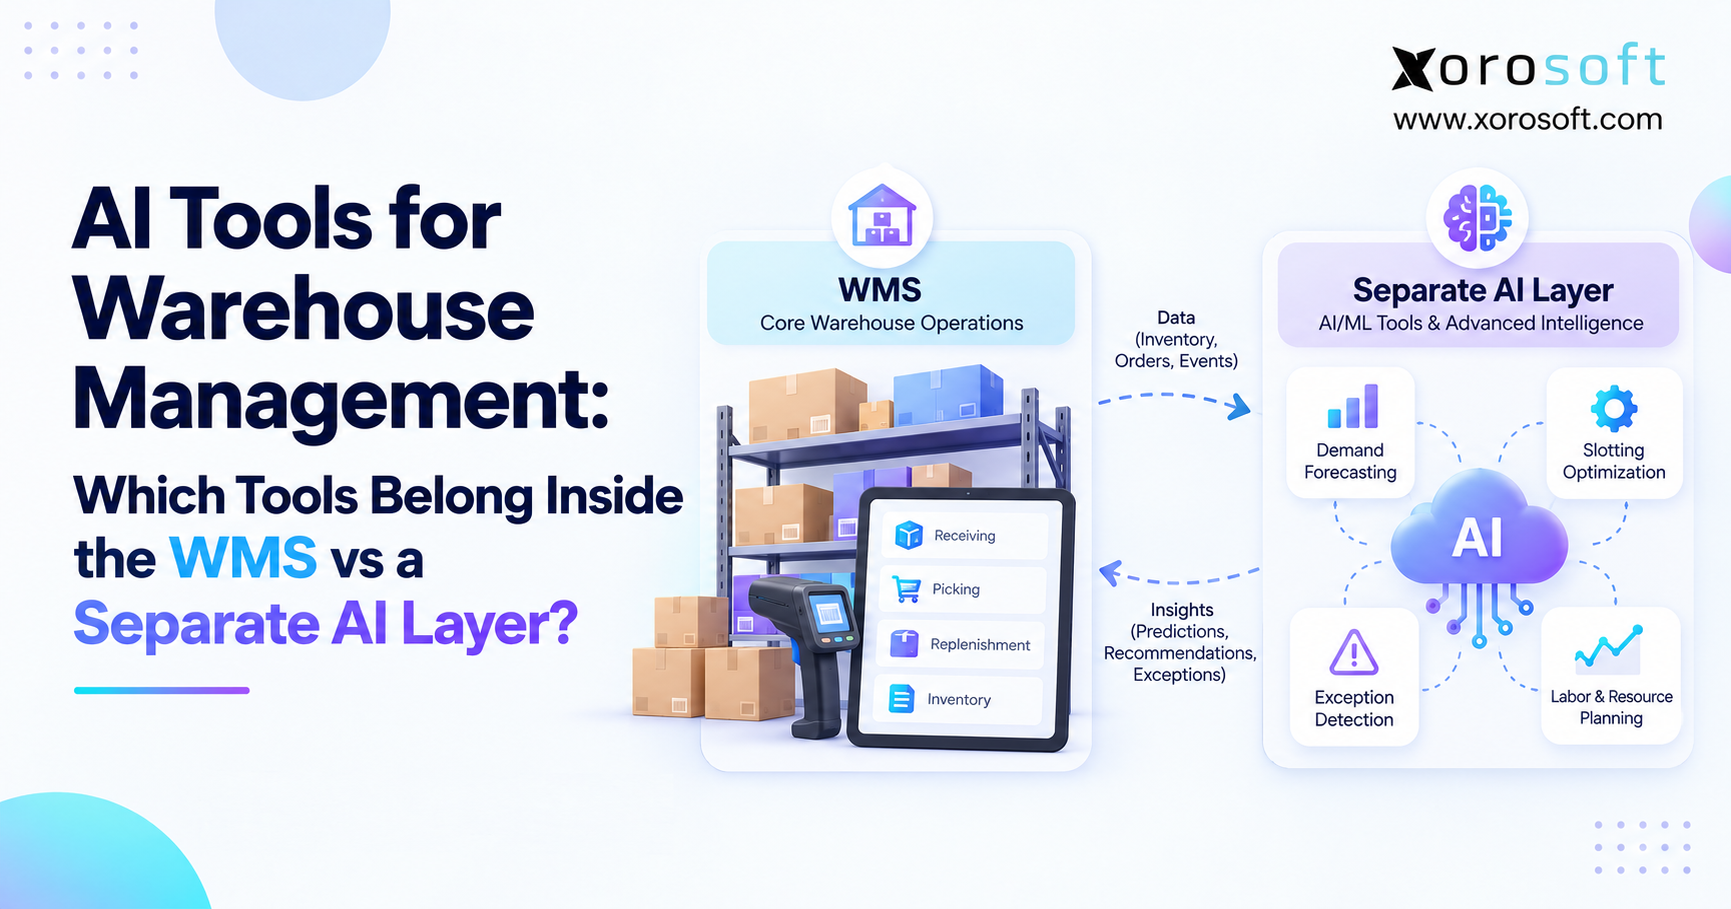
 WMS AI Architecture: Which Tools Belong Inside the WMS vs a Separate AI Layer?