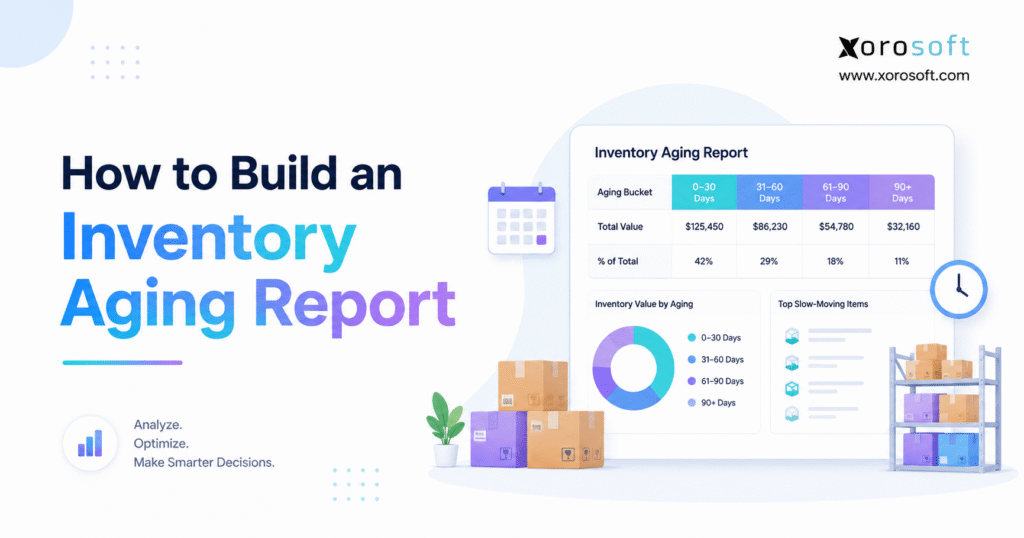
When managing warehouse stock, an Inventory Aging Report can be an essential tool for tracking and analysing inventory over time.
1. Aging Inventory Drains Cash Before It Looks Like a Crisis
Inventory problems rarely begin with a warehouse full of obviously unusable products. Instead, the risk usually develops one transaction at a time. A few products stop selling, buyers place another purchase order, and warehouse teams return older units to available inventory. Meanwhile, employees move stock between locations and make its original receipt history harder to trace.
Because the total inventory balance may still look reasonable, the underlying issue often remains hidden. However, total inventory value does not tell a business whether products arrived last week or remained unsold for more than a year.
An inventory aging report adds that missing time dimension. In practical terms, it separates recently received products from inventory that the business has held for months. As a result, managers can see where working capital becomes trapped before the problem creates a major clearance event or accounting adjustment.
Aging stock affects much more than warehouse capacity. For example, it increases storage requirements, complicates purchasing, creates markdown pressure, and reduces the cash available for healthier products. In addition, old inventory can distort forecasts because the business may continue replenishing an item even though customers no longer buy the existing units.
Therefore, inventory teams should review age alongside quantity, value, demand, warehouse location, and open purchase orders. Otherwise, buyers may continue making decisions with an incomplete picture of the inventory the company already owns.
1.1 Why Total Inventory Value Can Hide Old Stock
A company may hold a large amount of inventory and still lack a clear view of its quality. Although the accounting balance shows how much stock the business owns, it does not explain how long the company has held those products.
Similarly, overall inventory turnover may appear acceptable because fast-moving products offset weak SKUs. Nevertheless, a strong category can hide discontinued colors, unpopular sizes, excess components, or products stored in the wrong location.
For example, a footwear company may report healthy turnover at the style level. However, most sales may come from only three sizes, while the remaining variants continue aging in the warehouse.
Therefore, management needs a more detailed report. An inventory aging analysis can answer questions such as:
- How much inventory has remained in stock for more than 90 days?
- Which warehouse contains the highest value of aged stock?
- Which suppliers contribute to repeated overbuying?
- Are buyers placing new orders for products that are already old?
- Which items should teams transfer, promote, return, or discontinue?
- Which products may require a reserve or write-down review?
- Which categories repeatedly enter the oldest aging buckets?
Moreover, the report can reveal whether the company faces an isolated issue or a systematic problem. If the same product category becomes old every season, the root cause may involve forecasting, buying, supplier minimums, or assortment planning rather than one poor sales month.
1.2 Who Needs an Inventory Aging Report
A formal stock aging report helps businesses that manage physical products. More specifically, it becomes valuable when a company:
- Manages hundreds or thousands of SKUs.
- Operates multiple warehouses.
- Purchases seasonal inventory.
- Sells through Shopify, Amazon, wholesale, or EDI channels.
- Manufactures products from raw materials and components.
- Manages products with expiration dates.
- Holds high-value or bulky inventory.
- Experiences stockouts and overstock at the same time.
- Uses spreadsheets to connect inventory and accounting data.
- Struggles to reconcile inventory at month-end.
By contrast, a small business with one location, a limited product range, and rapid sell-through may use a simpler exception report. Even so, the company should formalize the process as inventory value, warehouse count, transaction volume, and operational complexity increase.
Ultimately, operational complexity matters more than revenue. A company with modest revenue but thousands of SKUs may need sophisticated inventory reporting. Meanwhile, a larger business with a narrow product catalog may manage with a simpler process.
s, the report should support decisions rather than simply describe the problem.
2.1 Core Inventory Aging Report Fields
At a minimum, include the following fields:
| Report field | Why it matters |
|---|---|
| SKU | Identifies the inventory item |
| Product description | Makes the report easier to understand |
| Product category | Supports category-level analysis |
| Brand | Reveals brand-specific exposure |
| Supplier | Supports purchasing and return decisions |
| Warehouse | Identifies location-level aging |
| Receipt date | Establishes the age starting point |
| Quantity on hand | Shows physical exposure |
| Age in days | Measures how long the business has held inventory |
| Unit cost | Supports inventory valuation |
| Extended value | Shows financial exposure |
| Aging bucket | Groups inventory into review periods |
| Last sale date | Adds demand context |
| Open purchase quantity | Reveals additional inbound risk |
| Recommended action | Converts findings into decisions |
| Action owner | Creates accountability |
| Target date | Supports execution |
In addition, some businesses should include lot number, expiration date, sales channel, buyer, customer commitment, quality status, and product lifecycle stage. These fields become especially useful when age alone does not explain whether the stock remains commercially valuable.
For example, a product may sit in inventory for more than 365 days because the company reserves it for an active service contract. Conversely, a fashion item may reach only 120 days of age yet have little demand because the selling season has ended.
Therefore, the report should include enough information to distinguish genuinely risky inventory from stock that serves a valid operational purpose.
2.2 Review Quantity and Inventory Value Together
Teams should always review quantity and value together.
For example, 1,000 old units of a low-cost accessory may represent less financial exposure than ten high-value furniture items. On the other hand, the low-cost accessory may still consume more space, handling time, and picking capacity.
Therefore, an aged inventory report should show:
- Units in each aging bucket.
- Value in each aging bucket.
- Percentage of SKU quantity by bucket.
- Percentage of SKU value by bucket.
- Percentage of total inventory over 90 days.
- Percentage of total inventory over 180 days.
- Percentage of total inventory over 365 days.
- Aging by warehouse, supplier, category, buyer, and brand.
Consequently, managers can prioritize products based on business impact rather than unit count alone.
Moreover, the business should consider inventory value relative to each location or category. For example, $100,000 of aged inventory may represent only 4% of one division’s stock but 35% of another division’s stock.
2.3 Inventory Aging Versus Other Inventory Metrics
Inventory aging relates to several other measures. However, each metric serves a different purpose.
| Metric | What it measures | Best use |
| Inventory aging | How long the company has held current inventory | SKU- and receipt-level action |
| Inventory turnover | How often the company sells and replaces average inventory | Overall inventory efficiency |
| Days inventory outstanding | Average number of days inventory remains on hand | Working-capital analysis |
| Sell-through rate | Percentage of received stock sold | Product and seasonal performance |
| Days since last sale | Time since the most recent sale | Demand exception review |
| Stock cover | How long inventory can support expected demand | Replenishment planning |
For instance, a product can be old but still operationally necessary. A service component may sell only a few times each year, yet customers may still depend on its availability.
Conversely, a newly received product can already move slowly when actual demand falls substantially below forecast. Therefore, teams should consider age together with expected demand and strategic importance.
Similarly, inventory turnover can look healthy while specific receipt layers remain old. As a result, aggregated ratios should complement SKU-level analysis rather than replace it.
3. Choose the Inventory Aging Method Before Building the Report
The methodology determines the reliability of the report. Therefore, the business should define which dates, inventory layers, transaction types, and cost values the report will use before anyone creates a spreadsheet or ERP report.
Otherwise, two teams may produce different answers from the same data.
For example, purchasing may calculate age from the original supplier receipt date, while warehouse operations may use the latest transfer date. Consequently, one report could show the same item as 240 days old while another shows only 15 days.
3.1 Select a Consistent Inventory Aging Date
Every calculation should use one reporting date, often called the “as of” date.
For financial review, the company may use the final day of each month. Meanwhile, purchasing, sales, and warehouse teams may also use a weekly operational version.
Regardless of frequency, all datasets must use the same cutoff. For example, teams should not combine a July 31 inventory balance with transactions posted through August 3. If the dates do not align, quantities, receipt layers, and inventory values may not reconcile.
Therefore, display the reporting date clearly at the top of every report. In addition, record the extraction time so users know exactly which transactions the report includes.
3.2 Choose the Date That Starts Inventory Age
For purchased goods, the supplier receipt date generally provides the most practical starting point. Nevertheless, the correct date depends on the inventory type and the company’s operating policy.
Accordingly, the aging policy should explain how teams handle each transaction type.
3.3 Use the Supplier Receipt Date for Purchased Inventory
Use the supplier receipt date for externally purchased finished goods, raw materials, packaging, and components.
However, the business should decide whether age begins when goods physically arrive, when ownership transfers, or when an employee posts the receipt in the system. Once management selects the rule, every team should apply it consistently.
For example, goods may arrive at the warehouse on July 1, but an employee may not post the receipt until July 4. If the business uses the posting date, the report will understate the physical age by three days.
Therefore, companies that experience frequent posting delays may prefer the physical receipt date, provided warehouse teams capture it reliably.
3.4 Use Manufacturing Completion Dates Carefully
Manufacturers may age finished goods from the production completion date. At the same time, the raw materials inside those products may have entered inventory much earlier.
Therefore, manufacturers often need separate inventory aging views for:
- Raw materials.
- Components.
- Work in process.
- Finished goods.
- Packaging.
- Spare parts.
- By-products.
- Quality-hold inventory.
This distinction helps management determine whether purchasing, production planning, or finished-goods demand created the problem.
For instance, an engineering change may create old raw materials. By contrast, weak customer demand or excessive production may create old finished goods.
3.5 Preserve the History of Customer Returns
A customer return should not automatically become new inventory. Instead, the report should preserve the original product history whenever possible.
Additionally, record:
- Original receipt date.
- Original sale date.
- Return date.
- Product condition.
- Inspection status.
- Resale status.
Returned products may require refurbishment, repackaging, or disposal. Therefore, warehouse teams should often keep them in a separate status until quality staff approve them for resale.
Moreover, repeated returns may indicate a quality or product-design problem. Consequently, the report should not treat all old returns as a sales issue.
3.6 Keep Original Age After Warehouse Transfers
A warehouse transfer should not normally reset inventory age.
For example, if a 200-day-old product moves from Warehouse A to Warehouse B, it remains 200 days old. Otherwise, the transfer makes aged inventory appear new and hides the original purchasing or demand problem.
Instead, keep both dates:
- Original external receipt date.
- Most recent warehouse transfer date.
This approach preserves the commercial age while still allowing the business to analyze location movements.
In addition, review frequent transfers separately. Although transfers can solve regional imbalances, repeated movements may indicate poor inventory allocation or forecasting.
3.7 Select the Inventory-Layer Logic
The company must also decide how to assign remaining on-hand inventory to historical receipt layers.
Without clear layer logic, the report may calculate an average age that hides the oldest stock.
3.8 Apply FIFO Inventory Aging
Under a FIFO-oriented method, the company assumes that it consumes the oldest inventory first. Therefore, the report allocates the remaining balance to unconsumed receipt layers.
This approach depends on reliable records for:
- Purchase receipts.
- Sales shipments.
- Customer returns.
- Adjustments.
- Warehouse transfers.
- Manufacturing consumption.
- Production receipts.
Missing records can distort the resulting inventory age.
For example, an unrecorded shipment can make the report show old units that the company already sold. Consequently, teams must reconcile the receipt layers with current inventory quantity.
3.9 Separate Weighted-Average Cost From Physical Age
Weighted-average costing combines inventory costs. However, average cost and physical age are not the same.
A business may use one weighted-average unit cost while still calculating physical age from individual receipt transactions. By contrast, one average receipt date can hide old physical inventory inside a blended number.
Therefore, companies that use weighted-average costing should answer two separate questions:
- What accounting cost does each unit carry?
- How old are the physical units that remain?
Although the business may calculate these figures through different methods, the report can still display both.
3.10 Separate Standard Cost From Transaction Age
When the business uses standard cost, the report should still calculate inventory age from transaction history. Meanwhile, the value column can use the applicable standard cost.
The report should clearly identify the chosen valuation basis. Otherwise, users may assume the report shows actual landed cost when it only shows standard cost.
Additionally, finance teams should review significant standard-cost variances separately. Otherwise, the report may understate or overstate the true financial exposure.
3.11 Establish Useful Inventory Aging Buckets
A common inventory aging schedule includes:
| Aging bucket | General interpretation | Typical response |
| 0–30 days | Recently received | Monitor normal demand |
| 31–60 days | Active inventory | Continue planned replenishment |
| 61–90 days | Early risk | Review sales and open orders |
| 91–180 days | Slow-moving inventory | Reduce purchasing or rebalance |
| 181–365 days | High aging risk | Promote, return, bundle, or reserve |
| More than 365 days | Potentially obsolete | Escalate for commercial and accounting review |
However, these thresholds do not suit every industry. A food distributor, apparel company, furniture retailer, and industrial parts manufacturer should not define old inventory in the same way.
Therefore, businesses should adjust the buckets according to shelf life, seasonality, lead time, replacement cycles, and customer-service requirements.
For example, a 120-day bucket may cover too much time for perishable goods. Conversely, it may provide too little time for custom furniture with long production and sales cycles.
4. How to Build an Inventory Aging Report Step by Step
The report-building process contains eight main stages:
- Define the report scope.
- Select the aging methodology.
- Export inventory transactions.
- Clean and classify the data.
- Calculate inventory age.
- Assign aging buckets.
- Calculate inventory value.
- Reconcile the results and assign actions.
Each stage matters. If the business skips data cleaning or reconciliation, even a well-designed report may produce misleading results.
4.1 Define the Stock Aging Report Scope
Before exporting data, document:
- Reporting date.
- Legal entities included.
- Warehouses included.
- Inventory ownership rules.
- Product types.
- Costing method.
- Currency.
- Aging buckets.
- Excluded inventory statuses.
- Treatment of customer returns.
- Treatment of warehouse transfers.
- Treatment of inventory adjustments.
- Treatment of manufacturing receipts.
- Treatment of consignment inventory.
In addition, decide whether the report will show available inventory, total owned inventory, or both. This distinction matters because reserved, quarantined, damaged, and in-transit inventory may still represent financial exposure even when customers cannot order it.
Moreover, the scope should identify whether the business will include inventory held by a third-party logistics provider or marketplace. Otherwise, the report may exclude financially owned stock simply because another company stores it.
4.2 Collect the Required Inventory Data
Most businesses need more than one data export.
The required datasets may include:
- Current on-hand inventory.
- Inventory transaction history.
- Purchase receipts.
- Production completion records.
- Customer returns.
- Warehouse transfers.
- Inventory adjustments.
- Item master data.
- Warehouse master data.
- Supplier master data.
- Current or historical unit costs.
- Open purchase orders.
- Sales history.
- Product category and brand information.
The on-hand file shows what remains. However, transaction history explains when the remaining inventory entered the business.
Therefore, an on-hand report by itself cannot produce a reliable age calculation.
Additionally, sales history helps explain whether old inventory moves slowly or has stopped selling entirely. Open purchase orders also matter because the business may have more stock scheduled to arrive.
4.3 Clean and Classify Inventory Transactions
Before calculating age, clean and normalize the source data.
Otherwise, duplicate receipts, inconsistent codes, and unclassified transfers can distort the result.
4.4 Remove Duplicate Inventory Records
First, check whether the same receipt appears in multiple exports. For instance, a purchase receipt may appear in both a purchasing report and an inventory transaction report.
If both records remain in the dataset, the report may overstate inventory quantity, value, or receipt layers.
Therefore, create a unique transaction key with fields such as:
- Receipt number.
- SKU.
- Warehouse.
- Transaction date.
- Quantity.
- Reference number.
Then, review duplicate keys before proceeding.
Additionally, confirm whether split receipts share the same reference number. Otherwise, the cleanup process may remove a valid partial receipt as a duplicate.
4.5 Standardize SKU and Warehouse Codes
Give each SKU one identifier. Similarly, assign one standard code to each warehouse.
For example:
WH1Warehouse 1Main WarehouseMain WH
These names may all refer to the same facility. However, inconsistent names may split one warehouse across several rows.
Consequently, management may underestimate the true value of aging inventory at that location.
Likewise, keep discontinued and replacement SKUs separate. Although two products may serve a similar commercial purpose, combining them can hide the age of the discontinued item.
4.6 Separate Receipt and Movement Types
Next, classify transactions into categories such as:
- Supplier receipt.
- Production receipt.
- Customer return.
- Warehouse transfer.
- Positive adjustment.
- Negative adjustment.
- Sales shipment.
- Manufacturing consumption.
- Stock status change.
This classification prevents the report from treating every positive movement as newly purchased inventory.
For example, a positive adjustment created during a cycle count may increase quantity. Nevertheless, it does not necessarily provide a valid new receipt date.
Therefore, place positive adjustments without reliable history in an exception category. The business can then reconstruct the original age, use the adjustment date under a documented rule, or report the quantity separately.
4.7 Calculate Inventory Age in Days
Use the following formula:
Inventory age in days = Reporting date − Relevant receipt or acquisition date
In Excel, use:
=MAX(0,$B$1-[@[Receipt Date]])In this example:
- Cell
B1contains the reporting date. - The receipt-date column contains the starting date.
MAXprevents future dates from producing a negative result.
However, teams should still investigate future dates. Preventing a negative number does not correct the underlying data issue.
Therefore, create an exception flag:
=IF([@[Receipt Date]]>$B$1,"Future Date","")Similarly, place missing receipt dates in an exception category rather than assigning them automatically to the oldest or newest bucket.
Otherwise, the report may hide the risk or exaggerate it.
4.8 Assign Inventory Aging Buckets
An Excel IFS formula can classify each record:
=IFS(
[@[Age in Days]]<=30,"0-30 Days",
[@[Age in Days]]<=60,"31-60 Days",
[@[Age in Days]]<=90,"61-90 Days",
[@[Age in Days]]<=180,"91-180 Days",
[@[Age in Days]]<=365,"181-365 Days",
TRUE,"365+ Days"
)
Alternatively, use a lookup table.
A lookup structure works especially well when:
- Thresholds differ by category.
- Business units use different buckets.
- Product shelf lives vary.
- Aging policies change frequently.
- Users need to review the rules without editing formulas.
As a result, the business can update category thresholds without rebuilding the entire spreadsheet.
Moreover, the lookup table can include a recommended action for each bucket. Therefore, the report can assign an initial review status automatically.
4.9 Calculate Aged Inventory Value
Use:
=[@[Quantity On Hand]]*[@[Unit Cost]]Before using the result, confirm the cost basis.
The report may use:
- Standard cost.
- Weighted-average cost.
- FIFO receipt cost.
- Landed cost.
- Replacement cost.
- Financial inventory cost.
Operational teams may prefer one valuation view, while finance may require another. Therefore, the methodology note should clearly state which cost the report uses.
In addition, companies that operate across currencies should specify the exchange rate and conversion date. Otherwise, warehouse or entity comparisons may become inconsistent.
4.10 Summarize Inventory Aging Results
After completing the calculations, use pivot tables, ERP reports, or dashboards to summarize inventory by:
- SKU.
- Warehouse.
- Product category.
- Brand.
- Supplier.
- Buyer.
- Sales channel.
- Inventory status.
- Aging bucket.
A management summary should present both value and percentage.
For example:
Warehouse West holds $185,000 of inventory over 180 days, representing 21% of its total inventory value.
This statement provides more context than a dollar figure alone.
Similarly, compare the report with the previous month. As a result, management can see whether aged inventory improves or continues to grow.
4.11 Reconcile the Inventory Aging Report
Do not use the report for major purchasing or accounting decisions until it reconciles.
Therefore, make quantity, value, and general-ledger checks part of the standard process.
4.12 Reconcile Inventory Quantity
First, compare the total quantity assigned to receipt layers with the relevant on-hand balance.
Differences may result from:
- Timing cutoffs.
- Negative inventory.
- Unposted transactions.
- Units in transit.
- Consignment inventory.
- Quarantined stock.
- Unit-of-measure conversions.
- Missing transfer records.
If the quantities do not match, investigate the difference before relying on the age distribution.
Otherwise, the report may assign too much or too little inventory to specific buckets.
4.13 Reconcile Inventory Value
Next, compare the total aged inventory value with the official inventory valuation report.
Potential differences include:
- Landed-cost postings.
- Currency changes.
- Cost adjustments.
- Standard-cost updates.
- Different reporting dates.
- Excluded inventory statuses.
- Historical receipt-cost changes.
In some cases, quantity may reconcile while value does not. Therefore, perform quantity and financial reconciliation separately.
Moreover, explain large differences by SKU or transaction type rather than leaving one balancing adjustment.
4.14 Reconcile Inventory With the General Ledger
Finance should also compare inventory valuation with the inventory control accounts in the general ledger.
Operational and financial reports may differ because of:
- Posting dates.
- Cost updates.
- Unposted receipts.
- Goods received but not invoiced.
- Inventory adjustments.
- Currency conversions.
- Landed-cost accruals.
Accordingly, the reconciliation should explain differences rather than force totals to match.
Once teams understand the differences, they can determine whether transaction processing, accounting, master data, or report logic caused them.
4.15 Create an Inventory Aging Exception Report
Finally, create a separate exception list for:
- Missing receipt dates.
- Future receipt dates.
- Negative quantities.
- Zero unit costs.
- Negative costs.
- Unknown warehouses.
- Duplicate receipts.
- Returned goods.
- Damaged inventory.
- Inventory with value but no quantity.
- Inventory with quantity but no value.
- Unclassified transaction types.
This exception report matters because data-quality problems can create false aging risks or hide genuine ones.
Furthermore, track exception counts over time. If the same errors continue every month, correct the upstream process rather than repeatedly fixing the report.
5. Inventory Aging Report Example
Assume the report date is July 31.
| SKU | Warehouse | Receipt date | Quantity | Unit cost | Age | Aging bucket | Value |
| SHOE-BLK-08 | East | July 15 | 50 | $42 | 16 | 0–30 days | $2,100 |
| SHOE-BLK-08 | East | May 20 | 30 | $41 | 72 | 61–90 days | $1,230 |
| CHAIR-OAK | West | February 1 | 8 | $280 | 180 | 91–180 days | $2,240 |
| JACKET-BLU-M | East | December 10 | 120 | $34 | 233 | 181–365 days | $4,080 |
| BALL-PRO | Central | June 5 | 200 | $8 | 56 | 31–60 days | $1,600 |
| PART-AX14 | Central | March 10, prior year | 25 | $95 | 508 | 365+ days | $2,375 |
5.1 How to Interpret the Aged Inventory Example
The blue jacket has the largest aged value at $4,080. Therefore, the business should review seasonality, demand in other locations, open purchase orders, and bundle opportunities before choosing a markdown.
Meanwhile, the industrial part is older. However, age alone does not prove obsolescence because the part may support customer equipment or warranty requirements.
The oak chair has only eight units. Nevertheless, it represents $2,240 and may consume significant warehouse space.
Consequently, the company should not prioritize action based only on unit quantity. Instead, it should consider value, space, demand, strategic importance, and recoverability.
In addition, the footwear SKU appears in two receipt layers. Although 50 units arrived recently, 30 units have already passed 60 days. Therefore, an average-age calculation could hide the older layer.
5.2 Convert Inventory Aging Buckets Into Actions
| Aging condition | Purchasing action | Sales action | Warehouse action | Finance action |
| 0–60 days | Continue approved plan | Normal selling | Standard storage | No exception |
| 61–90 days | Review open orders | Review demand trend | Confirm location | Monitor exposure |
| 91–180 days | Reduce replenishment | Promote or bundle | Consider transfer | Review recoverability |
| 181–365 days | Pause purchasing | Markdown or return | Consolidate stock | Assess reserve |
| 365+ days | Block reorder | Liquidate or repurpose | Segregate if needed | Review write-down |
Treat the action matrix as a starting point. In practice, the final decision should also consider product condition, customer commitments, margins, shelf life, supplier agreements, and replacement demand.
Moreover, assign each action to an owner and deadline. Otherwise, items may remain in the same bucket without resolution.
6. Use Inventory Aging Analysis to Improve Decisions
A report creates visibility. However, it only produces value when it changes purchasing, sales, warehouse, forecasting, or accounting decisions.
Therefore, connect the aging review with existing operational meetings rather than handling it as a separate reporting exercise.
6.1 Use Aged Inventory to Control Purchasing
A buyer should not approve another purchase order simply because a static minimum level has triggered replenishment.
Instead, the buyer should review:
- Current on-hand quantity.
- Value over 90 and 180 days.
- Open purchase orders.
- Recent sales.
- Forecast demand.
- Minimum order quantities.
- Supplier pack sizes.
- Lead time.
- Safety stock.
- Existing markdown plans.
For example, a SKU may trigger replenishment because available stock has fallen below its reorder point. However, the same SKU may still have a large quantity of reserved, damaged, or location-specific inventory.
Therefore, purchasing rules should consider the full inventory position rather than one available-balance field.
Additionally, approval workflows can require buyers to explain new orders for SKUs with substantial aged value. As a result, the business can prevent excess inventory before it arrives.
6.2 Transfer Old Inventory Between Warehouses
Inventory may move slowly in one region but sell actively in another.
Before transferring stock, compare:
- Demand by location.
- Expected selling price.
- Transfer cost.
- Warehouse capacity.
- Customer-service requirements.
- Inventory condition.
- Remaining shelf life.
- Expected margin.
If the transfer makes economic sense, the business can rebalance inventory rather than discounting it.
Even so, preserve the original age after the transfer. Otherwise, the movement hides the issue instead of resolving it.
Moreover, measure whether transferred inventory actually sells. If it continues aging at the destination, repeated transfers may only add cost.
6.3 Create Targeted Markdown and Bundle Plans
Discounting should not become the automatic response to every old product.
Instead, evaluate:
- Remaining gross margin.
- Carrying cost.
- Seasonality.
- Product lifecycle.
- Bundle opportunities.
- Supplier return rights.
- Brand-positioning impact.
- Expected full-price demand.
- Liquidation recovery value.
For example, a small discount applied early may preserve more value than a deep clearance after the season ends. Similarly, bundling an old accessory with a strong-selling product may move inventory without damaging the accessory’s standalone price.
However, track markdown performance. Otherwise, the business may discount products without knowing whether the promotion improved inventory recovery.
6.4 Improve Supplier Management
Aged inventory by supplier can reveal:
- Excessive minimum order quantities.
- Inflexible case packs.
- Long or unreliable lead times.
- Poor return terms.
- Repeated quality problems.
- Overly optimistic supplier forecasts.
- Products that buyers consistently overorder.
As a result, purchasing teams can use the report during supplier negotiations.
For instance, the company may request smaller order quantities, more flexible deliveries, improved return rights, or revised payment terms. In addition, suppliers may agree to exchange slow-moving products for faster-moving alternatives.
Therefore, supplier scorecards should include aging exposure where appropriate. This measure can show whether commercial terms contribute to excess inventory.
6.5 Use Stock Aging to Improve Forecasting
Old inventory often signals a forecasting problem.
Therefore, compare aged products with:
- Original forecasts.
- Actual demand.
- Promotion performance.
- Customer cancellations.
- Seasonal assumptions.
- Product substitutions.
- Pricing changes.
- Marketplace performance.
- Lost retail accounts.
- Product-launch expectations.
If the same category repeatedly enters old-stock buckets, the problem may be systematic rather than product-specific.
Consequently, the forecasting team should review demand assumptions, lead times, safety stock, order cycles, and forecast overrides.
Moreover, teams should measure forecast accuracy at the level where they make inventory decisions. A category forecast may look accurate even when individual SKUs carry significant overstock.
6.6 Review Inventory Reserves and Write-Downs
Age does not automatically determine financial value.
Finance should also consider:
- Expected selling price.
- Product condition.
- Remaining demand.
- Completion costs.
- Selling costs.
- Supplier return rights.
- Disposal costs.
- Alternative uses.
- Applicable accounting standards.
Therefore, an aging bucket should trigger review rather than an automatic journal entry.
For example, a two-year-old spare part may retain full recoverable value, while a six-month-old seasonal product may require a markdown.
Nevertheless, consistently old inventory should not remain at full value without documented support. Accordingly, finance should record the basis for significant reserve decisions.
6.7 Assign Owners and Deadlines
Each material aged item should have:
- An action owner.
- A selected disposition.
- A target date.
- An expected recovery value.
- A current status.
- A documented reason when no action occurs.
Without ownership, the same products will remain on the report month after month.
Accordingly, management should track both total aged inventory value and the value that teams resolve during each reporting period.
In addition, managers should escalate overdue actions. Otherwise, the report will show problems without changing behavior.
7. Excel Inventory Aging Reports Versus ERP Automation
7.1 When an Excel Inventory Aging Report Is Enough
A spreadsheet may suit the business when:
- The product catalog remains small.
- The business has one warehouse.
- Employees can trace receipt history easily.
- Inventory costing remains straightforward.
- Few users update the report.
- Teams run the report monthly.
- Transaction volume remains manageable.
- Inventory exposure remains limited.
In that environment, a controlled template may provide enough structure. However, the file should include locked formulas, documented methodology, version control, and a reconciliation checklist.
Additionally, assign one person to update the report. Otherwise, multiple versions may circulate with different results.
7.2 Where Spreadsheet-Based Aging Reports Break Down
Spreadsheets become difficult to manage when:
- Several warehouses maintain separate files.
- Shopify, Amazon, wholesale, and EDI orders affect the same stock.
- Transfers distort receipt dates.
- Teams store cost adjustments separately.
- Different employees use different formulas.
- Report preparation takes several days.
- Production creates additional inventory layers.
- Accounting and operations produce different totals.
- Historical reports cannot be reproduced.
- Buyers need daily visibility.
As complexity increases, the spreadsheet often becomes a data-assembly process rather than an analytical tool.
Therefore, the business may spend more time collecting and correcting information than using the report to make decisions.
Moreover, manual reports often depend on one employee. If that person becomes unavailable, the business may struggle to reproduce the analysis.
7.3 What an ERP Inventory Aging Report Should Provide
An automated inventory aging report should connect current inventory with receipt history, purchasing, warehouse activity, sales, costing, forecasting, manufacturing, and accounting.
A cloud ERP for inventory-driven businesses such as Xorosoft can provide a connected data foundation when the report depends on several operating functions.
In addition, a suitable system should allow users to:
- Select an “as of” date.
- Configure aging buckets.
- Filter by warehouse.
- Filter by supplier and category.
- View quantity and value.
- Drill into receipt transactions.
- Review open purchase orders.
- Export detailed records.
- Schedule recurring reports.
- Preserve historical audit information.
- Reconcile inventory with accounting.
However, automation does not remove the need for a clear policy. The business must still define receipt logic, transfer treatment, cost basis, age buckets, and ownership.
Furthermore, users should test the standard report before implementation. Otherwise, they may discover too late that the system’s aging logic differs from their operational requirements.
7.4 Excel, Inventory Software, or ERP?
| Requirement | Excel | Inventory software | ERP |
| Small product catalog | Strong fit | Strong fit | May be unnecessary |
| Multi-warehouse visibility | Manual | Varies | Strong |
| Purchasing automation | Limited | Moderate | Strong |
| Accounting integration | Manual | Often limited | Integrated |
| Manufacturing support | Limited | Varies | Available in suitable systems |
| Audit trail | Limited | Moderate | Strong |
| Initial implementation | Low | Medium | Higher |
| Long-term scalability | Limited | Moderate | High |
Ultimately, operational complexity matters more than company size.
For example, a $5 million company with several warehouses, manufacturing, and multichannel sales may need an ERP. By contrast, a larger business with a narrow catalog and simple fulfillment may remain comfortable with a lighter system.
8. Multi-Warehouse and Ecommerce Inventory Aging
Aging becomes more complicated when inventory sits across warehouses, stores, fulfillment partners, marketplaces, and wholesale allocations.
Therefore, treat location and ownership as separate reporting dimensions.
In addition, distinguish available stock from reserved, damaged, in-transit, or marketplace-controlled inventory.
8.1 Multi-Warehouse Inventory Aging
A multi-warehouse report should preserve the original receipt age while adding the current location.
The business should be able to answer:
- Which location has the highest aged inventory value?
- Does the same SKU sell well in one warehouse but age in another?
- Can teams transfer stock to a higher-demand region?
- Does the warehouse hold allocated but unavailable units?
- Are buyers directing purchase orders to locations that already carry excess?
- Which facility holds the highest value over 180 days?
A warehouse management system with real-time inventory visibility can support this analysis by connecting receipts, transfers, counts, allocations, picks, and warehouse balances.
Moreover, warehouse-level aging can reveal process problems. For example, older units may remain behind newer units because putaway and picking rules do not follow FIFO or FEFO practices.
Consequently, the business may need a warehouse-process change rather than a sales promotion.
8.2 Shopify Inventory Aging
Shopify merchants often need to combine storefront inventory with purchasing, returns, wholesale orders, marketplace activity, warehouse movements, and accounting.
Although Shopify provides useful inventory and location data, merchants may need a connected operational platform to build a complete receipt-layer aging model.
The Xorosoft ERP integration for Shopify can serve as the operating system behind Shopify when ecommerce inventory must remain connected with purchasing, accounting, warehouse management, forecasting, and multichannel sales.
As a result, the business can review aging in the context of inbound supply, channel demand, available inventory, and financial value.
Moreover, Shopify merchants should review variants separately. Otherwise, strong sales for one size or color may hide old inventory in another variant.
8.3 Wholesale Inventory Aging
Wholesale companies must also consider:
- Customer-specific commitments.
- EDI orders.
- Backorders.
- Reserved inventory.
- Supplier minimums.
- Customer-specific products.
- Large product catalogs.
- Long lead times.
An integrated inventory and accounting ERP such as Xorosoft can centralize purchasing, customer allocations, EDI activity, warehouse operations, and financial reporting.
However, wholesalers should distinguish genuinely old inventory from products held for contractual or strategic customer requirements.
Therefore, add customer commitments and expected order dates where relevant.
8.4 Amazon and Marketplace Inventory
Marketplace inventory may sit in external fulfillment networks.
Therefore, the aging analysis should separate:
- Owned inventory.
- Available inventory.
- Reserved inventory.
- Damaged inventory.
- Inbound inventory.
- Customer returns.
- Unsellable inventory.
In addition, include stock that the company still owns financially even when another business stores it.
Otherwise, the report may exclude a large portion of the inventory balance.
9. Inventory Aging Use Cases by Industry
Different industries require different aging definitions. Therefore, businesses should avoid using the same thresholds and actions across every product category.
9.1 Apparel Inventory Aging
Apparel companies should analyze inventory at the variant level.
A style may perform well overall while specific sizes or colors remain unsold. Moreover, seasonal collections require shorter aging periods than evergreen basics.
Important dimensions include:
- Style.
- Color.
- Size.
- Season.
- Collection.
- Warehouse.
- Sales channel.
- Return status.
Businesses evaluating ERP solutions for inventory-driven industries can review how Xorosoft supports apparel inventory, ecommerce, purchasing, warehouse, and accounting processes.
Additionally, apparel teams should track markdown stage and season exit date. Otherwise, the report may identify old products without showing how urgently teams need to act.
9.2 Furniture Stock Aging
Furniture companies should prioritize:
- Inventory value.
- Warehouse space.
- Product condition.
- Regional demand.
- Supplier lead time.
- Floor-model status.
- Damage status.
- Delivery restrictions.
A small number of aged products may create substantial working-capital and storage pressure.
Therefore, furniture businesses should review both unit age and cubic storage impact.
Moreover, damaged packaging or floor-model use can reduce recoverable value even when the product itself remains sellable.
9.3 Sporting Goods Inventory Aging
Sporting-goods demand can depend on weather, geography, sports seasons, product launches, and team schedules.
For example, a product may become old in one region while remaining highly relevant in another. As a result, location-level aging and transfer analysis become particularly important.
Additionally, teams should consider season-end dates. Otherwise, a product may appear acceptable based on age alone even though the active selling season will end soon.
9.4 Food and Beverage Inventory Aging
Food businesses must combine inventory age with:
- Expiration dates.
- Lot numbers.
- Remaining shelf life.
- Quality status.
- FEFO rules.
- Regulatory requirements.
- Temperature controls.
Inventory age and expiration risk relate to each other, but they do not mean the same thing.
For instance, recently received stock may still have a short remaining shelf life. Conversely, an older shelf-stable product may remain commercially acceptable.
Therefore, food and beverage businesses should use both receipt age and remaining shelf life.
Moreover, they may define aging buckets as percentages of remaining shelf life rather than fixed day ranges.
9.5 Manufacturing Inventory Aging
Manufacturers should create separate views for:
- Raw materials.
- Components.
- Work in process.
- Finished goods.
- Packaging.
- Spare parts.
- Quality-hold inventory.
- Obsolete BOM components.
Xorosoft supports inventory-driven manufacturing workflows involving bills of materials, purchasing, production planning, warehouse activity, and reporting.
Nevertheless, manufacturers should also identify why inventory became old. A design change, reduced production demand, incorrect material planning, excessive supplier minimums, or discontinued finished goods may create the problem.
Therefore, compare aged components with active bills of materials and future production requirements.
10. Common Inventory Aging Report Mistakes
10.1 Aging Inventory From the Wrong Date
The latest movement date does not always represent the receipt date.
For example, transfers, bin movements, cycle-count adjustments, and status changes should not make old inventory appear new.
Therefore, classify each transaction type before calculating age.
10.2 Resetting Inventory Age After Transfers
Warehouse movement should preserve the original receipt age.
Otherwise, inventory can move repeatedly and appear younger than it actually is.
In addition, show the transfer date separately so managers can review location movement without changing age.
10.3 Treating Customer Returns as New Inventory
Returned products may have quality, packaging, or resale restrictions.
Consequently, teams should not treat them like newly purchased products until inspection confirms their condition.
Moreover, review return age and original product age together.
10.4 Reporting Quantity Without Inventory Value
Quantity-only analysis can direct attention toward the wrong products.
Therefore, every meaningful report should include both quantity and financial value.
Similarly, space-intensive businesses may also include cubic volume or pallet positions.
10.5 Using the Same Aging Buckets for Every Category
A single structure may be easy to administer. However, it can misrepresent operational risk.
Perishable food, seasonal apparel, furniture, industrial parts, and automotive components all have different useful lifecycles.
Therefore, category-specific thresholds may provide a more accurate view.
10.6 Ignoring Open Purchase Orders
An old SKU may have more inventory scheduled to arrive.
Therefore, show open purchase quantity and expected delivery dates. Otherwise, the business may focus on clearing old stock while new units continue entering the warehouse.
In addition, buyers should review whether they can delay, reduce, or cancel open orders.
10.7 Skipping Inventory Reconciliation
An aging report that does not reconcile with on-hand quantity and inventory valuation should not function as a financial control.
Instead, treat it as an analytical draft until teams explain the differences.
Otherwise, users may make purchasing or accounting decisions with incomplete data.
10.8 Producing the Report Without Actions
The report must lead to purchasing changes, transfers, promotions, supplier discussions, reserve reviews, or product decisions.
Otherwise, it becomes another spreadsheet that management reviews but does not use.
Therefore, assign every material aged item to an owner with a clear action and due date.
11. Inventory Aging Report FAQs
11.1 What is an inventory aging report?
An inventory aging report divides current inventory according to how long the business has held it. Usually, it shows quantity and value across periods such as 0–30, 31–60, 61–90, 91–180, and more than 180 days. As a result, teams can identify slow-moving, excess, and potentially obsolete products.
11.2 Why does inventory aging matter?
Inventory aging identifies working capital tied up in products that do not sell as planned. Therefore, it helps teams control purchasing, move stock between warehouses, create promotions, negotiate supplier returns, and review potential obsolescence before losses increase.
11.3 How do you calculate inventory age?
Subtract the relevant receipt or acquisition date from the reporting date. However, the correct starting date depends on whether the business purchased, manufactured, returned, or transferred the inventory.
11.4 Which date should start the inventory aging calculation?
Purchased products usually use the supplier receipt date. Meanwhile, finished goods may use production completion. Warehouse transfers should generally preserve the original age, whereas returned goods may require separate treatment.
11.5 What are standard inventory aging buckets?
Common periods include 0–30, 31–60, 61–90, 91–180, 181–365, and more than 365 days. Nevertheless, businesses should adjust these periods based on shelf life, seasonality, lead time, product value, and lifecycle.
11.6 What is a 30-60-90-day inventory aging report?
This report groups stock based on whether the company has held it for up to 30 days, 31–60 days, 61–90 days, or longer. However, most businesses need additional periods for inventory older than 90 days.
11.7 How do you create an inventory aging report in Excel?
First, export on-hand inventory and transaction history. Next, add receipt date, reporting date, age, aging bucket, quantity, unit cost, and value columns. Finally, use formulas and pivot tables to summarize the results.
11.8 What fields should an inventory aging report include?
At a minimum, include SKU, product description, warehouse, receipt date, age, quantity, unit cost, inventory value, and aging bucket. In addition, supplier, last sale date, open purchase quantity, action owner, and target date improve decision-making.
11.9 How does FIFO affect inventory aging?
FIFO assumes the business consumes the oldest inventory first. Therefore, the report assigns the remaining on-hand balance to unconsumed receipt layers. Accurate receipts, shipments, returns, adjustments, and transfers support a reliable result.
11.10 Can weighted-average inventory be aged?
Yes. Weighted-average costing determines financial cost, while receipt-level transaction history can determine physical inventory age. Therefore, teams should treat cost and age as separate dimensions.
11.11 Should warehouse transfers reset inventory age?
No. A warehouse transfer should usually preserve the original receipt age. Otherwise, old inventory may appear newly received after it moves to another location.
11.12 How should customer returns be aged?
Preserve the original inventory history whenever possible. Meanwhile, record the return date, condition, and inspection status separately. As a result, the business can distinguish product age from return-processing time.
11.13 How should manufacturers calculate inventory age?
Manufacturers should usually create separate views for raw materials, work in process, and finished goods. For example, raw materials may age from supplier receipt, while finished goods may age from production completion.
11.14 How often should inventory aging be reviewed?
Most inventory-driven businesses should review aging monthly. However, high-volume ecommerce, food, apparel, or seasonal operations may benefit from weekly monitoring. Finance can still use the month-end version for valuation and control purposes.
11.15 What percentage of aged inventory is acceptable?
No universal percentage applies to every business. Instead, the target depends on industry, product lifecycle, margins, lead times, service requirements, and accounting policy. Therefore, businesses should establish category-specific thresholds.
11.16 What is the difference between aged and slow-moving inventory?
Aged inventory has remained in stock for a defined period. By contrast, slow-moving inventory sells at a lower rate than expected. A product can be old but strategically necessary, or recently received but already underperforming.
11.17 What is dead stock?
Dead stock refers to inventory with little realistic demand or operational use. However, age alone does not classify an item as dead. Sales history, service requirements, product lifecycle, and recoverable value also matter.
11.18 How does aging analysis improve purchasing?
It shows buyers which products accumulate before they approve additional orders. Consequently, buyers can reduce reorder quantities, revise minimum levels, cancel unnecessary orders, and challenge forecasts that repeatedly create excess stock.
11.19 How does inventory aging support forecasting?
Aging analysis reveals products where demand did not match the forecast. Therefore, planners can compare old inventory with seasonality, promotions, customer losses, pricing changes, substitutions, and forecast overrides.
11.20 Can Shopify create an inventory aging report?
Shopify provides useful inventory and location data. However, a complete receipt-layer aging report may require additional exports, a reporting application, or an ERP that connects Shopify with purchasing, warehouse, and accounting data.
11.21 Can QuickBooks create an inventory aging report?
The available reporting depends on the QuickBooks version and connected applications. Nevertheless, businesses with several warehouses, complex costing, ecommerce channels, or manufacturing may need a more specialized inventory platform.
11.22 Can an ERP automate inventory aging?
Yes. A suitable ERP can combine on-hand balances, receipts, warehouse locations, costs, purchasing, sales, manufacturing, and accounting. Even so, the business must still define its aging methodology and action rules.
11.23 How do you report inventory aging across warehouses?
Preserve the original receipt date and add the current warehouse as a separate dimension. Then, compare value and quantity by location. As a result, the company can identify transfer opportunities without resetting inventory age.
11.24 When should a business write down aged inventory?
Age should trigger a financial review rather than an automatic write-down. Therefore, finance should consider expected selling price, product condition, completion costs, selling costs, alternative uses, and applicable accounting rules.
11.25 Who should own the aged inventory review?
The review should involve several departments. Purchasing manages replenishment, sales or merchandising manages demand actions, warehouse teams validate inventory, and finance reviews valuation. However, one senior owner should coordinate actions and track results.
12. Turn Inventory Aging Data Into a Monthly Operating Discipline
Building the first inventory aging report creates visibility. However, repeating the process with consistent rules and clear ownership creates long-term value.
A practical monthly workflow should include:
1. Finance establishes the reporting cutoff.
2. Warehouse teams validate quantities and locations.
3. Purchasing reviews open commitments.
4. Sales or merchandising assigns commercial actions.
5. Operations evaluates warehouse transfers.
6. Finance reviews valuation and reserve exposure.
7. Management tracks newly aged and resolved inventory.
In addition, the report should become part of purchasing approvals, forecasting reviews, warehouse planning, and month-end controls. It should not remain an isolated spreadsheet that teams create only after inventory becomes visibly excessive.
Before the next review cycle:
- Define the aging methodology.
- Select category-specific buckets.
- Confirm receipt and transfer rules.
- Reconcile quantities.
- Reconcile inventory value.
- Add open purchase orders.
- Assign action owners.
- Track expected recovery value.
- Review unresolved products monthly.
- Evaluate whether reporting automation makes sense.
Moreover, management should compare current results with the previous month. As a result, the team can distinguish inventory that employees actively resolve from inventory that continues to deteriorate.
When inventory aging analysis depends on repeated exports, manual corrections, disconnected warehouse files, and separate accounting reconciliation, the reporting problem may reflect a wider systems issue.
Therefore, businesses can use a Free ERP Readiness Assessment, Watch a Demo, or Book a Personalized Demo to review inventory reporting, purchasing, forecasting, warehouse management, ecommerce, manufacturing, and accounting requirements.
Recent Posts
-
 Best AI Warehouse Management Software for ERP Inventory and Warehouse Operations
 -
 Project Based ERP Software for Managing Project Costs, Purchasing, Resources, Inventory, and Accounting
 -
 Food and Beverage ERP Requirements for Lot, Expiry, and Recall Control
 -
 How to Prevent EDI Errors Before They Become Retailer Chargebacks
 -
 Warehouse Injury and Safety Statistics: What Operations Teams Should Know Before Automating Workflows