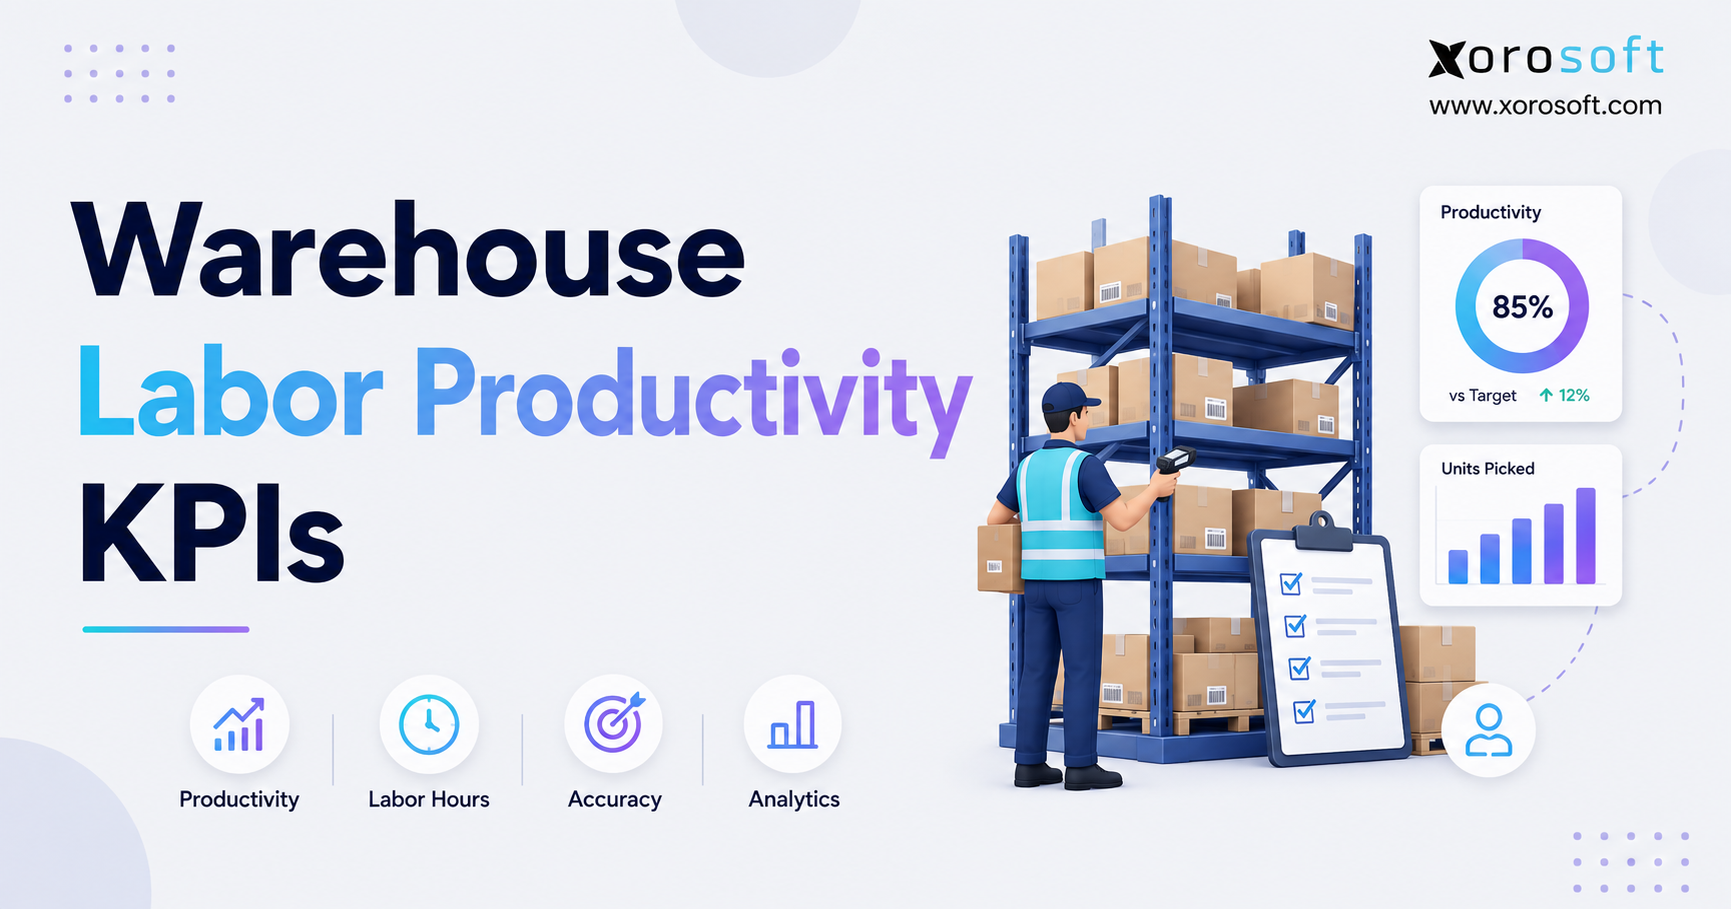
Understanding warehouse labor productivity KPIs is essential for tracking and improving efficiency in any warehouse operation.
1. Warehouse Labor Productivity KPIs Reveal More Than Speed
Warehouse labor costs are easy to see on a payroll report, but productivity is much harder to judge accurately. Managers may know how many employees worked a shift, how many orders shipped, and how much overtime the operation used. Those numbers still do not explain whether the warehouse converted labor into output efficiently.
A picking team might process fewer orders because the shift handled large multi-line orders. Another team might appear faster because workers handled simple single-item orders from high-velocity locations. Inventory shortages, replenishment delays, equipment problems, congestion, poor slotting, or excessive walking can also reduce output without reflecting employee effort.
For that reason, warehouse labor productivity KPIs need to measure more than speed. Strong labor measurement combines throughput, cost, utilization, accuracy, and workload complexity. These metrics help management understand not only how much work employees complete, but also why performance changes.
1.1 Why One Warehouse Productivity Metric Cannot Tell the Whole Story
A warehouse that tracks only units per hour can easily reach the wrong conclusion. For example, employees may increase their pick rate while mis-picks also rise. The warehouse then consumes additional labor through customer service, returns, repacking, inventory corrections, and reshipping.
Cost creates another layer. Order volume can rise while labor cost per order also increases. In that situation, higher throughput does not necessarily mean the operation has become more efficient.
Managers therefore need a balanced set of warehouse labor productivity KPIs that connects output with quality and cost. When those measures move together, leadership gets a much clearer picture of operational health.
1.2 Why Consistent Definitions Matter
Companies also need to define labor hours consistently. One warehouse may count only direct picking and packing time, while another includes meetings, equipment checks, training, cleanup, and waiting. Both approaches can work, but inconsistent definitions make comparisons unreliable.
A useful measurement framework should answer six questions: How much output did the warehouse produce? How many labor hours did it use? What did those hours cost? How much paid time supported productive work? Did employees maintain accuracy? What operational conditions affected the result?
Once managers can answer those questions consistently, labor data becomes a decision-making tool rather than another spreadsheet.
2. What Warehouse Labor Productivity KPIs Should Measure
Warehouse labor productivity KPIs show how effectively a warehouse converts workforce time into operational output. Depending on the process, that output may include units, order lines, picks, cartons, pallets, receipts, or completed orders.
At the simplest level, the calculation looks like this:
Labor Productivity = Warehouse Output ÷ Labor Hours
If employees process 5,000 order lines during 100 labor hours, the warehouse produces 50 lines per labor hour.
The formula looks straightforward, but the interpretation requires context. Order profile, product size, warehouse layout, equipment, picking methodology, travel distance, automation, and inventory availability can all influence the result.
2.1 Productivity, Efficiency, and Utilization Measure Different Things
Productivity measures output relative to labor input. Efficiency compares actual performance with an expected level of performance. Utilization shows how much available labor capacity employees spend on active work.
Imagine that a picker achieves strong output whenever work reaches the queue but spends an hour waiting for replenishment. That employee may show high task productivity but lower utilization. Increasing the employee’s target would not solve the problem. Management needs to improve replenishment.
This distinction helps warehouse leaders diagnose the cause behind a metric instead of reacting to the number itself.
2.2 Quality Must Sit Beside Warehouse Labor Efficiency Metrics
Speed alone can create misleading productivity gains. If employees rush and accuracy declines, the business may increase total labor consumption even though the picking dashboard looks better.
Warehouse leaders should therefore review throughput alongside picking accuracy, packing accuracy, inventory discrepancies, damages, and rework. Together, these measures show whether employees produce useful output or simply move problems to another department.
2.3 Cost Connects Warehouse Labor KPIs With Financial Performance
Operations teams often focus on units and orders, while finance focuses on payroll and fulfillment cost. Labor cost per order or unit connects those perspectives.
If the warehouse ships more volume but labor cost rises faster than output, management needs to understand why. Overtime, poor scheduling, changes in order complexity, inefficient processes, higher wages, or additional manual work may explain the gap.
That makes labor cost one of the most important companions to operational productivity metrics.
3. Core Warehouse Labor Productivity KPIs and Their Formulas
The best warehouse labor productivity KPIs depend on the process, but most operations benefit from a core group of throughput, cost, time, and quality metrics.
3.1 Units per Labor Hour
Units per labor hour measures how many units employees process for each labor hour.
Formula: Units per Labor Hour = Total Units Processed ÷ Total Labor Hours
If a team processes 12,000 units during 200 labor hours, the result equals 60 units per labor hour.
This metric works best when products require reasonably similar handling effort. A warehouse should avoid comparing lightweight accessories with bulky furniture unless management adjusts for the difference in work.
3.2 Lines per Labor Hour
Lines per labor hour often provides a better view of workload for ecommerce and wholesale operations.
Formula: Lines per Labor Hour = Total Order Lines ÷ Labor Hours
Suppose employees process 6,000 order lines during 120 labor hours. The team achieves 50 lines per labor hour.
Because a ten-line order requires more picking activity than a single-line order, line-based metrics frequently provide more useful insight than order counts alone.
3.3 Orders per Labor Hour
Orders per labor hour measures completed orders against the workforce time used to process them.
Formula: Orders per Labor Hour = Orders Completed ÷ Labor Hours
This metric works particularly well when order profiles stay relatively consistent. When order size varies significantly, warehouse managers should use order lines or units alongside it.
3.4 Picks per Labor Hour
Picks per labor hour focuses specifically on picking output.
Formula: Picks per Labor Hour = Completed Picks ÷ Picking Labor Hours
Managers should review this KPI with travel time, replenishment availability, picking method, and accuracy. A high pick rate does not create value if it leads to more mis-picks or unsafe movement.
3.5 Labor Cost per Order
Labor cost per order connects warehouse execution directly with fulfillment economics.
Formula: Labor Cost per Order = Total Warehouse Labor Cost ÷ Orders Shipped
If warehouse labor costs $24,000 while the business ships 8,000 orders, labor cost equals $3 per order.
Management should track the trend rather than judge a single period. Seasonal peaks, wage changes, overtime, or changes in the order mix can shift the metric.
3.6 Labor Cost per Unit
Businesses with reasonably comparable products can also track labor cost at the unit level.
Formula: Labor Cost per Unit = Total Warehouse Labor Cost ÷ Units Processed
This KPI becomes especially useful when leadership wants to determine whether increased volume creates genuine operating leverage.
3.7 Productive Time Percentage
Productive time percentage shows how much paid labor time employees spend performing defined productive warehouse activities.
Formula: Productive Time % = Productive Hours ÷ Paid Hours × 100
A low percentage does not automatically indicate weak employee performance. Stockouts, waiting for assignments, equipment shortages, replenishment delays, or system problems can reduce productive time.
Managers should classify those causes before deciding how to respond.
3.8 Indirect Labor Percentage
Warehouses also need to understand indirect labor.
Formula: Indirect Labor % = Indirect Hours ÷ Total Labor Hours × 100
Training, meetings, cleanup, equipment inspections, administrative tasks, and other support activities may all fall into this category.
Some indirect work is necessary. The goal is to understand how much the operation consumes and whether recurring activities point to avoidable inefficiency.
3.9 Warehouse Labor Utilization
Labor utilization shows how much available workforce capacity supports active work.
Formula: Labor Utilization % = Active Work Time ÷ Available Labor Time × 100
Low utilization may reveal excess staffing, uneven workloads, poor task assignment, system delays, or inventory availability problems. Rather than pushing employees to work faster, management should first identify what prevents them from working.
3.10 Overtime Rate
Overtime provides an important signal about planning and capacity.
Formula: Overtime Rate = Overtime Hours ÷ Total Labor Hours × 100
A persistent increase may point to inaccurate labor forecasting, staffing shortages, absenteeism, training gaps, inefficient workflows, or unexpected demand.
Temporary overtime during a seasonal spike does not necessarily indicate a problem. Long-term trends deserve more attention.
3.11 Picking Accuracy
Picking accuracy protects the warehouse from pursuing speed at the expense of quality.
Formula: Picking Accuracy = Correct Picks ÷ Total Picks × 100
Managers should analyze accuracy alongside throughput. If picks per labor hour improve while accuracy declines, the business may absorb additional cost through returns, customer service, reshipping, and inventory correction.
3.12 Rework Rate
Rework represents work that the warehouse must repeat because something went wrong earlier.
Formula: Rework Rate = Transactions Requiring Rework ÷ Total Transactions × 100
High rework consumes labor without creating new customer value. Reducing it often improves total warehouse productivity more effectively than pushing employees to increase raw speed.
3.13 Performance to Standard
More advanced operations may compare actual task time with expected time.
Formula: Performance to Standard = Standard Time ÷ Actual Time × 100
This method becomes useful when tasks differ significantly by location, travel distance, equipment, or handling complexity. Companies should review standards regularly so the benchmark continues to reflect real operating conditions.
Together, these warehouse labor productivity KPIs give management a much fuller view of output, cost, capacity, and quality.
4. How to Set Warehouse Labor Productivity Benchmarks That Reflect Real Work
Warehouse leaders often ask for an industry benchmark for picks per hour or lines per hour. Unfortunately, a single number rarely provides a fair comparison.
A warehouse selling apparel handles different work than a furniture distributor. A highly automated fulfillment center operates differently from a manual warehouse. Even two sites within the same company can produce different productivity rates because their layouts, SKU profiles, order patterns, and picking methods differ.
4.1 Start With an Internal Warehouse Labor Productivity Baseline
Before comparing the operation with outside benchmarks, measure several weeks or months of stable internal performance.
Capture volume, labor hours, overtime, accuracy, order profile, and process conditions. Separate picking from receiving and packing. When possible, segment small-item zones from bulky or specialized areas.
An internal baseline gives managers a realistic starting point. They can then measure whether slotting changes, process improvements, new technology, or training produce actual gains.
4.2 Compare Similar Warehouse Productivity Metrics With Similar Work
Fair benchmarking requires comparable conditions. Managers should account for SKU velocity, product dimensions, order size, picking strategy, equipment, warehouse layout, and travel requirements.
Instead of asking why one shift processed more orders than another, compare workload-adjusted performance. A shift that handled fewer but more complex orders may have delivered stronger productivity than the raw order count suggests.
4.3 Use Targets to Investigate Variance, Not Punish It
A productivity target should trigger a question when results change. It should not automatically trigger blame.
If a team’s lines per hour falls, investigate inventory availability, replenishment, equipment, travel, workload, congestion, system responsiveness, and staffing conditions. This approach turns warehouse labor productivity KPIs into operational diagnostics.
Managers gain more value when targets guide root-cause analysis instead of becoming arbitrary quotas.
5. Warehouse Labor Productivity KPIs Across Receiving, Picking, Packing, and Shipping
Warehouse departments perform fundamentally different types of work. Each one needs a productivity metric that reflects its actual activity.
5.1 Receiving Labor Productivity KPIs
Receiving teams can track purchase-order lines, cartons, pallets, or units received per labor hour. Choose the unit that best represents workload.
Speed must remain connected to accuracy. A receiving team that works quickly but records incorrect quantities or locations creates problems for every downstream process.
Dock-to-stock time adds another useful perspective because it measures how long inventory takes to become available for use after arrival.
5.2 Putaway and Replenishment Productivity Metrics
Putaway teams may measure pallets, cases, units, or completed tasks per labor hour. Travel distance and storage type can significantly influence expected performance.
Replenishment requires a slightly different lens. High task output provides little value if pick faces repeatedly run empty. Combine replenishment productivity with pick-face availability, stockout events, and picker waiting time.
5.3 Picking Warehouse Labor Productivity KPIs
Picking usually deserves the most detailed labor analysis because many warehouses devote a large share of direct labor to the process.
Useful metrics include picks per labor hour, lines per hour, units per hour, travel time, picking accuracy, and rework.
Managers should also segment results by picking methodology. Discrete, batch, wave, cluster, and zone picking create different patterns of work. Comparing them without context can distort conclusions.
5.4 Packing and Shipping Labor Efficiency Metrics
Packing teams can track orders or cartons packed per labor hour. However, packaging complexity matters. Fragile products, custom labels, kitting, inserts, documentation, or gift requirements can increase task time.
Shipping productivity should connect throughput with carrier cutoffs and on-time shipment performance. Processing orders quickly does not help if shipments still miss their departure window.
6. Common Mistakes That Distort Warehouse Labor Productivity KPIs
Measurement problems often come from process design rather than the formula itself.
Managers sometimes focus on employee speed while overlooking the conditions that shape that speed. Poor slotting increases walking. Inaccurate inventory creates search time. Late replenishment causes waiting. Weak task prioritization sends workers across unnecessary distances.
Those factors directly affect productivity.
6.1 Measuring Speed Without Warehouse Accuracy
The fastest warehouse is not necessarily the most productive warehouse.
When employees rush, mis-picks, damages, and packing errors may rise. The business then spends additional labor correcting the mistakes.
Managers should pair throughput with accuracy and rework so the KPI rewards useful output instead of movement alone.
6.2 Using Different KPI Definitions Across Locations
Two facilities cannot compare productivity reliably when they calculate labor hours differently.
Management should create one written definition for each major metric. That definition should explain which hours, tasks, employees, and transactions count toward the formula.
Consistency turns multi-site reporting into a meaningful management tool.
6.3 Treating Waiting Time as an Employee Problem
A worker may appear unproductive because the system failed to provide work.
Inventory shortages, printer failures, equipment delays, congestion, replenishment problems, or missing assignments can all produce idle time.
Strong labor analysis identifies the root cause. Once managers understand where waiting originates, they can improve the process rather than simply increasing targets.
6.4 Setting Targets That Encourage Unsafe Work
Sustainable productivity does not require employees to move at an unsafe pace.
Warehouses should design workflows that reduce unnecessary lifting, walking, searching, reaching, and repeated handling. Better ergonomics and process design can improve both safety and productivity.
The best operational gains come from removing wasted work, not forcing people to perform bad processes faster.
7. Improving Warehouse Labor Productivity Without Simply Adding Pressure
Improvement starts with understanding where labor time goes.
Warehouses often gain more from reducing travel, waiting, duplicate handling, and rework than from raising individual performance targets.
7.1 Improve Warehouse Slotting and Travel Paths
Slotting should reflect demand, product size, weight, replenishment frequency, and handling requirements.
Place high-velocity products where workers can reach them efficiently without creating congestion. Review pick paths regularly because product demand changes over time.
Reducing unnecessary travel can increase warehouse output without asking employees to work at a faster physical pace.
7.2 Strengthen Replenishment Before Picking Suffers
Pickers cannot maintain productivity when forward locations run empty.
Use demand patterns, open orders, and inventory availability to replenish locations before shortages interrupt picking. Measure picker waiting time alongside replenishment performance to identify recurring gaps.
7.3 Improve Task Assignment
Manual task allocation becomes harder as warehouse complexity grows.
Supervisors need to consider location, urgency, employee availability, equipment, order priority, and workload. Better task sequencing reduces unnecessary movement and helps teams use labor capacity more effectively.
7.4 Use Warehouse Labor Productivity KPIs for Labor Forecasting
Historical productivity provides a useful foundation for staffing.
Suppose the warehouse expects 18,000 order lines and consistently processes around 45 lines per productive labor hour. Management can estimate direct labor requirements, then account for indirect time, breaks, meetings, and operational variation.
This creates a stronger staffing model than relying on intuition alone.
7.5 Reduce Rework Before Increasing Throughput Targets
Every corrected pick, repacked carton, relabeled shipment, and inventory adjustment consumes labor.
Managers should identify where rework starts and remove the source. Improving process accuracy frequently delivers a larger net productivity gain than simply increasing the expected pick rate.
8. When Warehouse Labor Productivity KPIs Need WMS, ERP, and Connected Data
Small warehouses can often track basic metrics through spreadsheets. As order volume, facilities, sales channels, and task complexity increase, manual reporting becomes harder to maintain.
At that point, companies need transaction-level data rather than reports that employees reconstruct after the work happens.
8.1 How WMS Data Improves Warehouse Labor Measurement
A warehouse management system records receiving, putaway, replenishment, picking, packing, shipping, locations, inventory movements, and barcode activity.
Businesses evaluating this level of execution visibility can review XoroWMS as one example of a warehouse platform that connects inventory and warehouse processes.
With transaction data available in real time, managers can analyze warehouse labor productivity KPIs with much more context than a manually maintained worksheet provides.
8.2 Why ERP Context Matters for Warehouse Productivity
Warehouse labor does not operate independently from the rest of the company.
Purchasing affects inventory availability. Inventory accuracy influences picking. Order profiles affect workload. Accounting determines the true labor cost associated with fulfillment.
XoroERP provides an example of how warehouse activity can connect with inventory, purchasing, accounting, manufacturing, and reporting.
For companies that need a broader operating platform, XoroONE combines multiple inventory-driven business processes within a connected environment.
Xorosoft’s broader business solutions also demonstrate how warehouse execution fits into purchasing, sales, inventory, financial management, and ecommerce operations.
8.3 Integrations Reduce Manual Warehouse Data Reconciliation
Modern operations rarely depend on one channel.
Orders may arrive through ecommerce stores, marketplaces, B2B customers, EDI connections, and other systems. When these applications operate separately, warehouse teams spend more time reconciling information.
The available Xorosoft integrations illustrate how connected order and inventory data can reduce the fragmentation that makes labor reporting difficult.
Shopify merchants can also review the Xorosoft ERP app on Shopify as an example of connecting ecommerce activity with wider ERP and fulfillment workflows.
8.4 AI Access Changes How Teams Use Operational Data
As ERP data becomes more connected, companies can also use AI to query and work with operational information.
The Xorosoft MCP Server shows one approach to connecting business systems with AI tools while maintaining structured operational data underneath.
AI does not eliminate the need for reliable warehouse labor productivity KPIs. Instead, better data makes those KPIs easier to analyze, explain, and act on.
8.5 Choose Warehouse Technology Around the Operating Requirement
A warehouse may need deeper WMS functionality, specialized labor management, broader ERP integration, or a combination of systems.
Companies comparing enterprise options should define their requirements before evaluating vendors. Resources such as the Xorosoft vs NetSuite comparison can help teams examine differences within a requirements-based software selection process.
Technology should support the process. It cannot compensate for unclear metrics or poorly designed workflows.
9. Applying Warehouse Labor Productivity KPIs Across Different Industries
The same formula does not create the same interpretation across every industry.
Product characteristics, order structures, compliance requirements, and handling methods influence labor requirements. Companies should therefore build productivity standards around how their warehouse actually operates.
9.1 Apparel and Fashion Warehouse Labor Metrics
Apparel warehouses often manage large numbers of variants across sizes, colors, and styles.
Lines per labor hour, units per hour, picking accuracy, returns-processing time, and labor cost per order can provide useful insight. Inventory-location accuracy also matters because searching for missing variants quickly consumes labor time.
9.2 Wholesale Distribution Labor KPIs
Wholesale warehouses often handle larger and more complex orders than direct-to-consumer operations.
Case quantities, pallets, customer-specific requirements, EDI orders, allocations, and multiple warehouses can all affect workload.
Companies should measure lines, cases, or pallets per labor hour while also tracking order accuracy, fulfillment cost, and on-time shipping.
9.3 Furniture and Bulky-Goods Warehousing
Furniture warehouses need metrics that account for product size, equipment, two-person handling, loading requirements, and damage prevention.
Simple picks-per-hour comparisons rarely capture those differences. Task-level measurements and labor cost per shipment may provide better insight.
9.4 Food and Beverage Warehouse Productivity
Food and beverage operations often manage lots, expiry dates, FEFO or FIFO rules, temperature zones, and case handling.
The extra operational requirements affect labor time. Managers need to include those constraints when they establish benchmarks.
9.5 Manufacturing Warehouse Labor KPIs
Manufacturing operations coordinate raw materials, components, production staging, replenishment, work orders, and finished goods.
Warehouse labor productivity KPIs should therefore connect material movement with production requirements rather than focusing only on outbound orders.
Companies can review Xorosoft’s industry-specific operating models to see how warehouse and inventory requirements differ across apparel, furniture, wholesale, food, sporting goods, manufacturing, and other inventory-driven sectors.
For practical implementation context, Xorosoft customer case studies can also help teams examine how growing businesses handle operational complexity beyond feature lists.
10. Building a Warehouse Labor Productivity KPI Dashboard Managers Will Actually Use
A useful dashboard should help managers decide where to act. It should not display every available metric simply because the system can calculate it.
10.1 Daily Warehouse Labor Productivity KPIs
Supervisors need execution-focused information.
Daily reporting should typically emphasize lines or units per labor hour, picking accuracy, backlog, productive time, replenishment status, staffing, and overtime risk.
Managers should display workload context beside productivity. A lower output rate may make perfect sense when the shift handles unusually complex orders or an unfamiliar zone.
10.2 Weekly Warehouse Labor Efficiency Review
Weekly reviews should focus more heavily on trends.
Compare planned labor with actual hours, labor cost per order, productivity by function, indirect labor, overtime, accuracy, and rework. Look for repeated patterns rather than isolated exceptions.
If management recently changed slotting, picking logic, training, or staffing, review several related metrics together before judging the result.
10.3 Monthly Warehouse Productivity and Financial Review
Monthly analysis should connect operational performance with business outcomes.
Leadership can review labor cost, fulfillment cost, service levels, inventory accuracy, capacity, headcount, overtime, and volume growth together.
This broader perspective reveals whether productivity improvements actually support profitable growth.
10.4 Give Every KPI a Clear Owner
Every important KPI needs a consistent formula, a data source, a reporting frequency, an owner, and a management action.
If nobody knows what to do when a metric moves, the dashboard creates visibility without accountability.
A smaller set of trusted warehouse labor productivity KPIs usually creates more value than dozens of measures that teams rarely use.
11. Frequently Asked Questions About Warehouse Labor Productivity KPIs
11.1 What Are Warehouse Labor Productivity KPIs?
Warehouse labor productivity KPIs measure how effectively workforce time produces warehouse output. Common examples include units per labor hour, lines per labor hour, picks per hour, labor cost per order, utilization, overtime, accuracy, rework, and performance to standard.
11.2 How Do You Calculate Warehouse Labor Productivity?
Choose a meaningful output such as units, lines, orders, pallets, or picks and divide it by the labor hours required. For example, a team that processes 5,000 lines during 100 labor hours produces 50 lines per labor hour.
11.3 What Is the Best Warehouse Labor Productivity KPI?
No single KPI works best for every operation. The right metric depends on the process. Picking may use lines per hour, putaway may use pallets per hour, while finance may focus on labor cost per order.
11.4 What Is a Good Warehouse Productivity Rate?
A good rate depends on order profile, product size, warehouse layout, automation, picking method, travel distance, and service requirements. Companies generally gain more value from a reliable internal baseline than from a generic industry number.
11.5 How Do You Calculate Units per Labor Hour?
Divide total units processed by total labor hours. If a warehouse processes 9,000 units during 150 labor hours, the team achieves 60 units per labor hour.
11.6 What Is Lines per Labor Hour?
Lines per labor hour measures the number of order lines employees process for every labor hour. It often provides better workload insight than orders per hour when customer orders contain different numbers of items.
11.7 What Is Picks per Labor Hour?
Picks per labor hour compares completed picks with the picking labor hours used. Managers should review it alongside travel time, replenishment availability, product characteristics, and picking accuracy.
11.8 How Do You Calculate Labor Cost per Order?
Divide total warehouse labor cost by the number of orders shipped during the same period. For example, $20,000 of labor divided by 10,000 orders produces a labor cost of $2 per order.
11.9 What Is Warehouse Labor Utilization?
Labor utilization shows the share of available workforce time employees spend completing active work. Low utilization may indicate waiting, uneven workloads, poor task assignment, inventory shortages, or excess staffing.
11.10 What Is Productive Time Percentage?
Productive time percentage compares time spent completing defined warehouse tasks with total paid or available labor hours. Companies need a consistent definition so different shifts and facilities calculate the metric in the same way.
11.11 What Is Indirect Warehouse Labor?
Indirect labor includes necessary activities that do not map directly to a primary transaction. Meetings, training, cleanup, equipment checks, supervision, and some administrative tasks commonly fall into this category.
11.12 What Causes Warehouse Idle Time?
Stockouts, replenishment delays, missing assignments, equipment problems, congestion, system issues, uneven workload, and staffing mismatches can all create idle time. Managers should identify the cause before attributing the result to employee performance.
11.13 What Is Performance to Standard?
Performance to standard compares the expected time for a warehouse task with the actual time employees use. The measure works best when management creates realistic standards that reflect task complexity and operating conditions.
11.14 What Are Engineered Labor Standards?
Engineered labor standards estimate reasonable task times using defined work methods and operating conditions. More advanced models can incorporate travel, equipment, locations, handling requirements, and allowances.
11.15 How Do You Measure Warehouse Picking Productivity?
Measure picks, lines, or units completed per picking labor hour. Combine the result with accuracy, rework, travel time, and replenishment availability so the KPI reflects overall performance rather than speed alone.
11.16 How Do You Measure Receiving Productivity?
Receiving teams can track purchase-order lines, cartons, pallets, or units per labor hour. Management should also monitor receiving accuracy and dock-to-stock time.
11.17 How Do You Measure Packing Productivity?
Track orders, cartons, or units packed per labor hour. Adjust expectations for packaging complexity, fragile items, inserts, documentation, kitting, or special customer requirements.
11.18 How Should Warehouse Managers Compare Different Shifts?
Compare similar workloads and account for SKU mix, order complexity, zone, equipment, travel requirements, automation, and staffing experience. Raw order counts rarely provide enough context.
11.19 How Often Should Companies Review Warehouse Labor KPIs?
Supervisors may review operational KPIs during each shift or daily. Managers can review labor cost and process trends weekly, while leadership can connect warehouse productivity with financial outcomes monthly.
11.20 How Many Warehouse Labor KPIs Should a Dashboard Include?
There is no mandatory number. Start with a focused group covering throughput, cost, utilization, quality, and capacity. Add new metrics only when they answer a specific operational question.
11.21 How Can Warehouses Reduce Overtime?
Improve workload forecasting, scheduling, replenishment, slotting, cross-training, and task allocation. Managers should also examine productivity and absenteeism before assuming that headcount alone causes overtime.
11.22 How Does a WMS Improve Labor Productivity?
A WMS helps coordinate receiving, putaway, replenishment, picking, packing, and shipping while recording transactions as employees complete them. Better inventory visibility and task direction can reduce search time, waiting, and manual coordination.
11.23 What Is the Difference Between a WMS and an LMS?
A WMS focuses primarily on warehouse execution and inventory. An LMS focuses more deeply on workforce planning, time, standards, utilization, and performance analysis. Larger operations may use both capabilities together.
11.24 Can ERP Software Support Warehouse Labor Productivity KPIs?
Yes. ERP platforms with warehouse functionality can connect fulfillment activity with inventory, orders, purchasing, accounting, manufacturing, and financial reporting. That connection helps management evaluate productivity in a broader business context.
11.25 When Should a Warehouse Stop Using Spreadsheet Labor Tracking?
Companies should consider more connected systems when reporting consumes significant manual time, different locations calculate KPIs differently, managers cannot see performance quickly, or labor information no longer connects reliably with orders and inventory.
12. How to Use Warehouse Labor Productivity KPIs for Continuous Improvement
Warehouse labor productivity KPIs create value when they help managers understand what prevents the operation from performing better.
Start with a focused group of metrics covering throughput, labor cost, productive time, overtime, utilization, and accuracy. Define each calculation consistently, segment different types of work, and establish realistic internal baselines before setting aggressive targets.
When performance changes, investigate the process before blaming the workforce. Poor slotting, long travel paths, inaccurate inventory, delayed replenishment, weak task assignment, system limitations, and rework can all consume labor. Eliminating those constraints usually creates more sustainable gains than simply asking employees to move faster.
As operations grow, connected data becomes increasingly important. Xorosoft can bring warehouse management, inventory, purchasing, accounting, manufacturing, forecasting, ecommerce, and reporting into one operational environment, allowing warehouse metrics to support wider business decisions.
The next step is straightforward: map the warehouse processes, decide which warehouse labor productivity KPIs matter most, document their formulas, identify where the data comes from, and determine where manual reporting prevents timely action.
If disconnected systems make that visibility difficult, contact Xorosoft to discuss your warehouse, ERP, and operational requirements in the context of your actual workflows.
Recent Posts
-
 Warehouse Injury and Safety Statistics: What Operations Teams Should Know Before Automating Workflows
 -
 Food and Beverage ERP Requirements for Lot, Expiry, and Recall Control
 -
 How to Prevent EDI Errors Before They Become Retailer Chargebacks
 -
 Vendor Portal vs Supplier Portal: What Distributors Actually Need Connected to ERP
 -
 Stock Write-Off Tracking: How Inventory Losses Explain Gross-Margin Variance