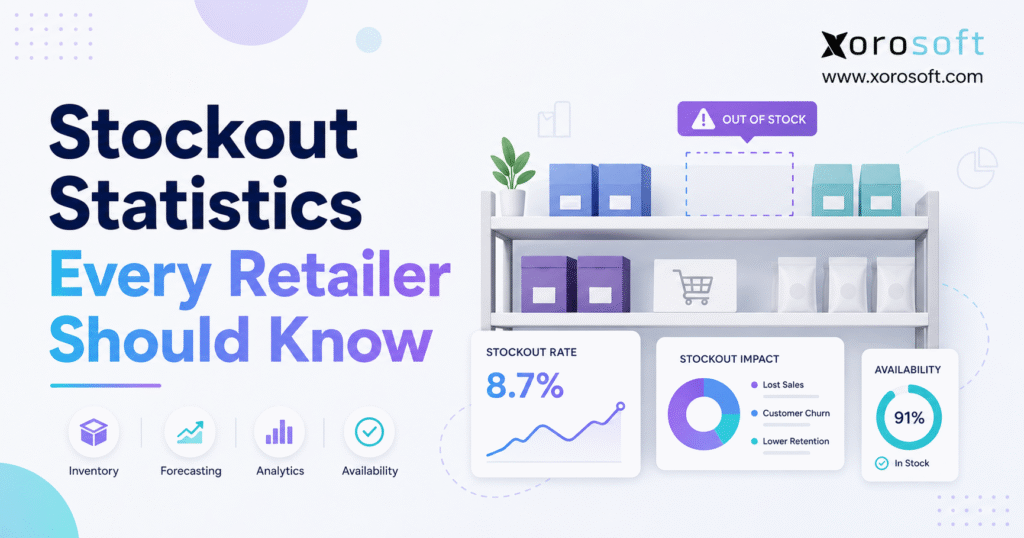
When considering the challenges businesses face today, reviewing stockout statistics provides essential insight into inventory management issues.
1. Why Stockout Statistics Matter for Retail Profitability
1.1 A Stockout Is a Demand-Fulfillment Failure
A stockout occurs when customer demand exists but the retailer cannot supply the required item at the expected place and time. The company may have no inventory at all, or inventory may sit in the wrong warehouse, remain unprocessed at receiving, carry the wrong quality status, or appear in the system without being physically available.
An on-hand balance does not always equal sellable inventory. Retailers must account for reservations, damage, inspection holds, transfers, backorders, production commitments, and channel allocations. A product can look available in an aggregate report while remaining unavailable to the customer.
1.2 What the Latest Stockout Statistics Show
IHL Group’s 2026 research findings place global inventory distortion—the combined cost of out-of-stocks and overstocks—at $1.7 trillion, equal to 6.2% of global retail sales. The same research attributes 65.6% of that distortion to out-of-stocks and 34.4% to overstocks. IHL also identifies empty shelves as a $690.9 billion component of the total problem. These figures describe a global analyst estimate, not a benchmark that any one retailer should apply directly to its P&L.
Food retail data shows how stockout rates can move over time. Purdue University reported that U.S. consumers experienced a 9.5% food out-of-stock rate in 2024, down from 12.3% in 2023 and 19.3% in 2022. Purdue based the findings on a survey of 1,200 U.S. consumers, so the figures represent reported food-shopping experiences rather than a universal transaction-level retail rate.
1.3 Why Stockout Statistics Need Context
A single percentage rarely tells the full story. Grocery, furniture, apparel, and manufacturing operations face different replenishment cycles and availability risks. Retailers should read retail stockout statistics alongside the category, geography, channel, measurement period, and research method, including whether the data comes from surveys, transactions, audits, or modeled estimates.
2. How to Read Stockout Statistics and Rate Benchmarks Correctly
2.1 Stockout Rates Can Measure Events, Items, Time, or Demand
Some businesses count every stockout event. Others measure the percentage of active SKUs that became unavailable, the share of selling time lost, or the amount of demand they could not fulfill. Each approach answers a different question.
An event-based rate helps teams track operational frequency. A time-based rate shows how long products remained unavailable. A demand-based rate connects more directly with sales impact. However, a retailer should not compare these rates as though they measure the same thing.
2.2 Physical and Ecommerce Stockouts Behave Differently
In a store, the product may sit in the back room while the shelf remains empty. Online, the website may hide an item because the available-to-promise quantity reached zero, even though units exist elsewhere. The opposite also happens: delayed inventory synchronization can keep a product available online after the business has already committed the last unit.
Consequently, ecommerce operators should track oversells, cancellations, unavailable product-page views, and failed fulfillment promises in addition to the standard stockout rate. Physical retailers should add on-shelf availability, shelf-replenishment time, and store-level inventory accuracy.
2.3 Why Stockout Statistics Depend on Scope
Before using published out-of-stock statistics, ask when researchers collected the data, which markets they covered, which categories they included, and how they treated substitutions or backorders. Also separate the publication date from the data-collection period. A report released in 2026 may analyze transactions from an earlier year.
This discipline prevents teams from turning an interesting industry figure into an unrealistic internal target. External data should start a discussion; internal data should drive the operating plan.
3. What Stockout Statistics Reveal About Financial Loss
3.1 Lost Revenue Is Only the Visible Cost
The easiest stockout cost to see is the abandoned sale. Yet retailers often lose value even when the shopper buys something else. A substitute may carry a lower margin, require a discount, or weaken a preferred brand’s position. The company may retain the order but lose profitability.
Operational recovery adds another layer. Teams may expedite purchase orders, pay premium freight, split shipments across warehouses, rework orders, or assign customer-service staff to manage delays. Finance then sees higher fulfillment costs, more credits, and less predictable margin.
3.2 Stockouts Can Reduce the Value of the Entire Basket
Many purchases contain linked items. When a key component is unavailable, customers may remove accessories, refills, or complementary products from the cart. Grocery shoppers may change an entire meal plan, sporting-goods customers may drop related apparel, and manufacturing buyers may delay the full order because one part is missing.
Therefore, the financial effect may exceed the selling price of the unavailable SKU. Retailers should examine basket abandonment, order-value changes, substitutions, and repeat-purchase behavior during stockout periods.
3.3 A Practical Stockout Cost Model
A simple starting formula is:
Estimated Lost Revenue = Unfulfilled Demand × Average Selling Price
A better profitability measure uses contribution margin:
Estimated Lost Margin = Unfulfilled Demand × Unit Contribution Margin
The most useful model also includes recovery costs and retained demand:
Adjusted Stockout Cost = Lost Margin + Expediting + Service Cost + Expected Retention Loss – Margin Retained Through Substitution or Backorders
Suppose a retailer estimates that a stockout suppressed demand by 300 units. The item sells for $50 and contributes $18 per unit. If customers substituted 100 units and the retailer retained $1,500 of contribution margin from those alternatives, the preliminary lost-margin estimate becomes $3,900 before adding freight, service, and retention effects.
This calculation remains an estimate, but it forces the business to distinguish revenue from margin and permanently lost demand from delayed or transferred demand.
4. What Stockout Statistics Reveal About Customer Behavior
4.1 Customers Often Switch Brands Before They Abandon the Retailer
NielsenIQ reported that 70% of shoppers may buy a different brand when their usual choice is out of stock, while 30% may visit another store. In the same 2022 analysis, NIQ reported roughly 4% shelf out-of-stock rates across France, Spain, and the U.K. for an average of four days, illustrating how a relatively small availability gap can affect both revenue and loyalty.
A brand switch may look harmless to the retailer because the transaction still occurs. However, the preferred supplier loses the sale, the substitute may have a different margin, and the shopper learns that the original choice is replaceable. Repeated shortages can permanently change purchasing habits.
4.2 Ecommerce Makes Retailer Switching Faster
An online shopper does not need to drive to another store. A second tab, marketplace search, or shopping agent can locate an alternative within seconds. As a result, an inaccurate availability promise creates two problems: the retailer loses the order, and it may lose trust in future stock messages.
Retailers should therefore measure customer behavior after the product returns. Back-in-stock conversion, repeat visits, notification sign-ups, and cancellation rates help reveal whether demand waited, moved elsewhere, or disappeared.
4.3 Urgency and Substitutability Shape the Outcome
Essential items, replacement parts, and time-sensitive purchases usually create less tolerance for delay. Highly differentiated products may encourage the shopper to wait, while commodity products make substitution easier. Price, brand attachment, delivery speed, and competitor availability also influence the decision.
That is why customer-response stockout statistics should not sit in isolation. Retailers need category-level analysis to understand which shortages create mild inconvenience and which ones cause immediate customer loss.
5. Why Retail Stockouts Continue to Happen
5.1 Why Stockout Statistics Understate Demand That Never Became a Sale
Most forecasts begin with sales history, but sales stop showing true demand once inventory becomes unavailable. If a store sells out at noon, the dataset cannot directly show afternoon demand.
Researchers call this censored demand. The 2026 FreshRetailNet-50K preprint contains 50,000 hourly store-product time series from 898 stores across 18 cities and covers 863 perishable SKUs. Its experiment improved prediction accuracy by 2.73% and reduced systematic demand underestimation from 7.37% to near zero after reconstructing demand hidden by stockouts. Because the paper remains a preprint under review and focuses on fresh retail, its results should guide thinking rather than serve as a universal performance promise.
Retailers should flag unavailable periods instead of treating zero sales as zero demand. Comparable stores, product-page traffic, waitlists, and back-in-stock registrations can help estimate the missing signal.
5.2 Inventory Records Can Show Stock That Does Not Exist
Phantom inventory occurs when the system quantity exceeds the usable physical quantity. Receiving errors, theft, damage, misplaced units, unrecorded transfers, incorrect returns, and production-consumption mistakes can all create it.
A 2025 grocery-retail study analyzed roughly 24,000 SKUs across 11 stores. The researchers found that inventory audits produced an 11% store-wide sales lift, with the benefit concentrated on products where system inventory exceeded actual inventory. The finding reframes counting as a revenue-support activity rather than only a control cost.
Increasing safety stock will not solve a shortage the system cannot see. Teams must correct the record and the transaction that caused the gap.
5.3 Supplier Lead Times Drift Away From Planning Assumptions
Many purchasing models use one lead-time value, although production constraints, port delays, incomplete shipments, and quality holds change the actual cycle. An outdated assumption can let inventory run out before replenishment arrives.
Retailers should track average lead time, variability, supplier fill rate, overdue lines, and purchase-approval delays. They should also review whether lead times differ by season, product family, order quantity, or transportation method.
5.4 Warehouse Delays Make Inventory Unavailable
Products can sit inside a facility without becoming available for sale. Pallets may wait at the dock, exceptions may remain unresolved, or stock may sit in the wrong bin.
Dock-to-stock time, location accuracy, pick exceptions, count variance, and transfer completion rates reveal these warehouse-driven stockouts earlier. These measurements help managers distinguish a purchasing shortage from inventory that warehouse teams have not made available.
5.5 Disconnected Channels Compete for the Same Units
Shopify, Amazon, wholesale, EDI, retail stores, and customer-service orders may draw from one inventory pool. When each channel updates on a different schedule, several systems can promise the last available unit.
Open sales orders, carts, work orders, transfers, and wholesale allocations may all consume availability. Retailers need available-to-promise logic that separates on-hand stock from committed, blocked, incoming, and sellable quantities.
5.6 Promotions Can Overwhelm an Otherwise Reasonable Plan
Promotions change demand timing and product mix. A discount can accelerate sales, shift demand from another SKU, or create channel-specific spikes. Marketing may also extend a campaign after purchasing finalized the original buy.
Therefore, promotional planning should connect campaign dates, expected uplift, supplier capacity, inbound inventory, and location-level allocation. Without that coordination, a successful campaign can create a highly visible stockout and teach new customers to buy elsewhere.
6. Stockout Statistics by Channel and Business Model
6.1 Physical Retail Needs On-Shelf Availability, Not Just Store Inventory
Store inventory can look healthy while the shelf remains empty. Staff may not receive a replenishment task, back-room stock may sit in the wrong location, or the planogram may not match current demand. For physical retail, on-shelf availability and shelf-refill time often reveal more than a daily store balance.
Retailers should also identify whether the shortage occurred at opening, during a peak period, or throughout the day. Hourly patterns help managers separate replenishment labor problems from a genuine store-level inventory shortage.
6.2 Ecommerce Stockouts Depend on Accurate, Fast Inventory Synchronization
Ecommerce businesses must decide what quantity each channel can sell and how quickly orders, returns, transfers, and cancellations update availability. A storefront can prevent overselling only when it receives accurate operational data.
For Shopify merchants, the Xorosoft ERP app supports real-time inventory sync, orders, products, variants, multiple locations, stock reservations, payments, refunds, and fulfillment-related workflows. The listing also states that the app works with Amazon, 3PLs, EDI providers, and other operational services.
The integration itself does not replace sound allocation rules. However, it can reduce the delay between operational inventory changes and what the customer sees online.
6.3 Wholesale Stockouts Often Start With Allocation Conflicts
Wholesale orders can consume large quantities at once, and customer-specific commitments may compete with ecommerce demand. EDI orders can also arrive outside a buyer’s normal review cycle. If the business lacks centralized reservations, one team may promise stock that another team already committed.
Line fill rate, allocation exceptions, overdue orders, and customer-priority rules help wholesalers distinguish true shortages from preventable commitment conflicts.
6.4 Manufacturing Stockouts Can Stop Production Before Finished Goods Run Out
Manufacturers can stock out at the raw-material, component, packaging, or finished-goods level. A low-cost component may stop an entire production run, while a substitute material may require quality or engineering approval.
For this reason, manufacturing availability depends on bills of materials, work orders, material requirements, supplier dates, and production capacity. Finished-goods forecasts alone cannot protect customer service.
7. How to Calculate Your Own Stockout Statistics and Lost Demand
7.1 Choose a Stockout Formula That Matches the Decision
An event-based stockout rate uses:
Stockout Events ÷ Total Demand Opportunities × 100
A SKU-based rate uses:
SKUs With at Least One Stockout ÷ Active SKUs × 100
A time-based rate uses:
Unavailable Selling Time ÷ Total Scheduled Selling Time × 100
A demand-based rate uses:
Unfulfilled Units ÷ Estimated Total Demand × 100
Each formula supports a different decision. Executives may prefer demand or margin impact, while warehouse teams need event and duration data. Merchandising teams may focus on affected SKUs and variants.
7.2 Measure Stockout Statistics With Fill Rate and Inventory Accuracy
A low stockout rate can still hide poor service if the business excludes cancelled orders or unavailable periods from demand. Conversely, one short event on a low-volume SKU may have little financial impact.
Retailers should pair stockout rate benchmarks with unit fill rate, order fill rate, backorder rate, available-to-promise accuracy, inventory-record accuracy, days of supply, forecast error, and supplier lead-time variance. Together, these measures show whether the problem comes from demand planning, purchasing, warehouse execution, or channel promises.
7.3 Estimate Hidden Demand Consistently
No method can recover every lost sale perfectly. However, retailers can create a repeatable estimate. Compare the affected period with similar weekdays, locations, seasons, or product groups. Add digital signals such as product-page traffic, failed add-to-cart attempts, waitlist registrations, and search activity. Then adjust for substitution and delayed purchases.
The method should remain documented and consistent. Changing assumptions each month makes the result impossible to trend. Finance, merchandising, and operations should agree on the model so that the stockout cost does not become a departmental debate.
7.4 Assign Ownership and Review the Data at the Right Cadence
Daily reviews work well for high-velocity ecommerce and grocery products. Weekly reviews may suit broader assortments, while monthly management reporting can focus on recurring root causes, lost margin, and supplier performance.
Ownership should follow the cause. Planners manage forecast and replenishment settings. Buyers manage supplier dates and order execution. Warehouse leaders manage inventory accuracy and processing delays. Ecommerce teams manage channel rules. A shared exception report keeps every team focused on the same event.
8. How to Reduce Retail Stockouts Without Creating Overstock
8.1 Correct the Demand Signal Before Increasing Inventory
The first response to a shortage should not always be “buy more.” A forecast that ignores hidden demand, promotions, or channel growth can produce the wrong reorder quantity, while inaccurate records can create excess stock in the wrong place.
Retailers should segment SKUs by velocity, margin, variability, lead time, and importance. High-impact products deserve stronger service targets; slow, seasonal, or perishable items need tighter controls.
8.2 Use Reorder Points That Reflect Current Lead Times
A basic reorder point follows:
Reorder Point = Expected Demand During Lead Time + Safety Stock
The formula only works when the inputs remain current. Retailers should update expected demand, supplier lead time, and safety stock as performance changes. A supplier with unpredictable delivery dates requires a different policy from a reliable local vendor.
Service levels should also vary. A critical replacement part and a low-margin decorative item do not deserve the same availability target. Product segmentation protects revenue while controlling working capital.
8.3 Improve Warehouse Accuracy at the Point of Activity
Cycle counting works best when teams prioritize high-velocity, high-value, frequently adjusted, and historically inaccurate SKUs. Barcode validation should support receiving, putaway, picking, transfers, packing, shipping, returns, and counts.
XoroWMS supports real-time inventory tracking, barcode scanning, RFID, cycle counting, stock alerts, and multi-warehouse management. Xorosoft’s official WMS materials also connect scanning with receiving, putaway, picking, packing, shipping, transfers, and replenishment.
The value comes from recording movement when it occurs, reducing the need for large corrective counts later.
8.4 Connect Purchasing, Inventory, Warehousing, and Accounting
Disconnected applications create timing gaps. The purchasing spreadsheet may show a supplier order that the warehouse has not received. Shopify may sell against stock that an offline order already reserved. Accounting may not see the inventory adjustment until month-end.
A connected cloud ERP such as XoroONE brings inventory, warehouse management, manufacturing, accounting, and ecommerce operations into one platform. Its inventory capabilities connect purchasing, warehousing, manufacturing, fulfillment, ecommerce, and accounting around a shared operational record.
No ERP can remove every demand shock or supplier delay. However, a shared record can expose exceptions earlier and reduce reconciliation.
8.5 Strengthen Supplier and Purchasing Discipline
Buyers need more than an open purchase-order report. They should see supplier confirmations, requested dates, expected dates, partial receipts, overdue lines, quality holds, and lead-time trends. They also need a clear approval process so that recommended orders do not sit in email or spreadsheets.
Purchasing policies should define when teams expedite, substitute suppliers, split orders, or move stock between facilities. These decisions work best when the business compares the shortage cost with the cost of intervention.
9. Industry-Specific Stockout Statistics Retailers Should Track
9.1 Apparel Stockouts Hide Inside Size and Color Variants
An apparel style may appear well stocked in total while the most important sizes remain unavailable. Retailers should track sell-through, weeks of supply, and stockout duration at the variant and location level. Seasonal calendars and long production lead times make late replenishment particularly difficult.
Returns also distort availability. Units may re-enter the system before inspection confirms that they are sellable, so retailers need clear return and quality-status workflows.
9.2 Furniture and Sporting Goods Need Location-Level Planning
Furniture inventory consumes space and may sit far from the customer. A company can own the product but still fail the delivery promise because the right distribution center lacks stock. Sporting-goods demand can change quickly around weather, teams, tournaments, and seasonal activities.
Both sectors benefit from regional demand planning, transfer visibility, supplier lead-time monitoring, and accurate delivery capacity.
9.3 Food Retailers Must Balance Availability With Shelf Life
Food and beverage businesses cannot solve every shortage with more safety stock. Expiration dates, lot status, storage conditions, and spoilage risk determine whether physical inventory remains usable.
The Purdue trend—19.3% reported food stockouts in 2022, 12.3% in 2023, and 9.5% in 2024—shows improvement, but it also demonstrates why food availability needs its own context.
9.4 Wholesale and Manufacturing Need Shared Material Commitments
Wholesale businesses manage customer-specific pricing, allocations, EDI, and large order quantities. Manufacturers add bills of materials, work orders, and component availability. In both models, aggregate inventory can hide commitments that make stock unavailable for the next order.
Xorosoft’s industry solutions cover apparel, home and kitchen, manufacturing, wholesale distribution, food and beverage, sporting goods, and other inventory-driven sectors. The page emphasizes variant management, multi-location inventory, production planning, BOMs, lots, expiries, and multichannel fulfillment across those industries.
10. When Stockout Statistics Signal the Need for ERP
10.1 Small Retailers May Need Better Process, Not More Software
A business with one location, a small catalog, one channel, and simple purchasing may manage stockouts through disciplined counting, reorder rules, and supplier tracking. ERP introduces implementation work, data migration, training, and process change. It should solve a real complexity problem.
Before replacing software, the company should define item ownership, correct unit-of-measure errors, clean supplier data, set reorder policies, and enforce transaction discipline. New technology cannot compensate for unclear operating rules.
10.2 Growing Retailers Outgrow Their Stack in Predictable Ways
The warning signs usually appear across departments. Purchasing relies on spreadsheets. Warehouse staff use a separate application. Shopify, Amazon, and wholesale orders update inventory at different times. Finance spends days reconciling sales, inventory valuation, and landed cost. Leaders cannot explain why the same SKUs keep stocking out.
At that point, the business needs more than an inventory counter. It needs a connected process for planning, buying, receiving, storing, allocating, fulfilling, and accounting for products.
10.3 Evaluate ERP Around the Stockout Root Cause
XoroERP connects manufacturing activity with inventory and accounting, while its procurement capabilities link purchasing with inventory, warehousing, reporting, and finance. Those connections matter when shortages originate across several departments rather than in one inventory screen.
Retailers should still compare platforms against their real workflows. The Xorosoft vs NetSuite comparison can support that evaluation, but buyers should validate integrations, implementation scope, reporting, warehouse depth, manufacturing needs, internal resources, and total ownership cost for themselves.
10.4 ERP Implementation Should Start With Availability Decisions
A stockout-reduction project should define how the company calculates available-to-promise inventory, reserves stock, prioritizes channels, sets reorder points, measures supplier performance, and handles exceptions. Those decisions belong to the operating model, not only the software configuration.
The best implementation creates one agreed inventory language across sales, purchasing, warehouse, manufacturing, and finance. Without that alignment, teams can recreate disconnected thinking inside a new platform.
11. Stockout Statistics FAQs
11.1 What Is a Stockout in Retail?
A stockout occurs when demand exists but the retailer cannot supply usable inventory at the required location, channel, or time. Inventory may equal zero or remain reserved, damaged, misplaced, blocked, or stored somewhere that cannot fulfill the order.
11.2 What Is the Average Retail Stockout Rate?
No universal average applies. Retail stockout data varies by category, country, channel, method, and period. Grocery survey results should not benchmark apparel, furniture, wholesale, or manufacturing without adjustment. Compare external research with a consistently measured internal rate.
11.3 What Is a Good Stockout Rate?
A good rate supports the service target without producing excessive inventory. Critical, fast-moving, or high-margin products often require higher availability than slow, seasonal, or perishable items. The target should reflect demand variability, lead time, substitution, margin, and holding risk.
11.4 How Common Are Retail Stockouts?
Stockouts remain common, but frequency varies. Purdue reported a 9.5% U.S. food out-of-stock rate in 2024, while NIQ reported roughly 4% in selected Western European FMCG markets in 2022. Neither figure applies universally.
11.5 How Much Do Stockouts Cost Retailers?
IHL’s 2026 research estimates global inventory distortion at $1.7 trillion and attributes 65.6% to out-of-stocks. Retailers should calculate their own lost margin, expediting, split-shipment, service, cancellation, and retention costs rather than applying the global estimate directly.
11.6 What Percentage of Sales Do Retailers Lose to Stockouts?
There is no dependable universal percentage. Loss depends on whether shoppers substitute, delay, backorder, or buy elsewhere. Estimate demand during unavailable periods, subtract demand retained through alternatives, and calculate the margin and operating cost associated with the remaining gap.
11.7 What Do Shoppers Do When an Item Is Out of Stock?
Shoppers may choose another product or brand, visit another retailer, delay the purchase, accept a backorder, or abandon the basket. NIQ reported that 70% may switch brands and 30% may visit another store when their regular choice is unavailable.
11.8 How Do Stockouts Affect Customer Loyalty?
One shortage may create inconvenience, while repeated shortages change habits. Customers may check competitors first or stop trusting availability messages. Even when substitution preserves the sale, it can weaken loyalty to the intended brand.
11.9 What Causes Most Retail Stockouts?
Common causes include inaccurate forecasts, hidden demand, phantom inventory, supplier delays, weak reorder settings, receiving bottlenecks, warehouse errors, poor allocation, and delayed channel synchronization. Recurring shortages often involve several causes at once.
11.10 What Is Phantom Inventory?
Phantom inventory exists when the system shows more usable stock than the business can locate or sell. Damage, theft, receiving mistakes, incorrect returns, and unrecorded transfers can create it. Because the system sees stock, replenishment may start too late.
11.11 How Does Inventory Inaccuracy Create Stockouts?
When recorded inventory exceeds physical stock, replenishment sees less urgency and channels may promise missing units. A study of roughly 24,000 SKUs across 11 stores found an 11% sales lift after audits, concentrated on items with overstated system inventory.
11.12 How Do Promotions Cause Stockouts?
Promotions can accelerate demand, shift sales between products, and create location- or channel-specific spikes. Without a shared plan across marketing, purchasing, suppliers, and warehousing, campaigns can consume inventory faster than replenishment responds.
11.13 How Do Supplier Lead Times Affect Stockouts?
Reorder points depend on demand before replenishment arrives. When actual lead time exceeds the planning assumption, inventory can reach zero early. Track average lead time and variability, then update safety stock and reorder timing from recent supplier performance.
11.14 How Is Stockout Rate Calculated?
One method divides stockout events by demand opportunities and multiplies by 100. Retailers can also measure affected SKUs, unavailable selling time, or unfulfilled units as a share of estimated demand. Keep the formula consistent across reporting periods.
11.15 What Is the Difference Between Stockout Rate and Fill Rate?
Stockout rate measures how often inventory failed to meet demand. Fill rate measures the share fulfilled immediately. The metrics may use different denominators—orders, lines, units, SKUs, or time—so teams should define them clearly.
11.16 How Do Retailers Estimate Lost Sales From Stockouts?
Compare expected demand with fulfilled demand during the unavailable period using forecasts, similar stores, comparable days, web traffic, waitlists, and substitution data. Separate permanently lost sales from delayed purchases, backorders, and retained substitutes.
11.17 Can Safety Stock Prevent Every Stockout?
No. Safety stock protects against defined demand and lead-time uncertainty, but it cannot eliminate severe disruption, bad records, warehouse errors, or unexpected demand. Excessive buffers also create cash, storage, markdown, and obsolescence risks.
11.18 Can Forecasting Eliminate Stockouts?
Forecasting reduces risk but cannot remove every shortage. Stockouts can censor the sales history used to build forecasts. Retailers also need accurate inventory, supplier controls, purchasing discipline, warehouse execution, and clear channel allocation.
11.19 How Does Real-Time Inventory Reduce Stockouts?
Real-time inventory shortens the delay between receipts, reservations, transfers, sales, returns, and channel availability. Faster information supports earlier replenishment and allocation, but it cannot fix incorrect transactions. Warehouse and order processes must capture activity accurately.
11.20 How Does a WMS Help Prevent Stockouts?
A WMS improves receiving, putaway, bin control, picking, transfers, counting, replenishment, and shipping. These controls reduce stock that exists physically but cannot be located or promised, while exposing delays and location exceptions earlier.
11.21 How Does ERP Help Reduce Stockouts?
ERP connects inventory with purchasing, orders, accounting, forecasting, warehousing, and manufacturing. Teams can interpret on-hand, reserved, inbound, and available quantities consistently. ERP cannot guarantee availability, but it can reduce reconciliation gaps.
11.22 When Should a Retailer Replace Spreadsheets With ERP?
Evaluate ERP when multiple warehouses, channels, buyers, entities, or production processes make manual reconciliation unreliable. Frequent discrepancies, delayed reporting, repeated overselling, separate WMS and accounting systems, EDI requirements, and poor commitment visibility also indicate growing complexity.
11.23 Are Ecommerce Stockouts Worse Than Store Stockouts?
Neither channel is always worse. Ecommerce makes competitor switching faster and exposes inaccurate promises through cancellations. Stores lose sales when products remain in the back room or wrong location. Omnichannel retailers face both risks.
11.24 How Can Retailers Reduce Stockouts Without Creating Overstock?
Segment products, correct censored demand, update lead times, use dynamic reorder points, count high-risk stock, monitor suppliers, and coordinate channel reservations. The objective is the right service level for each SKU, location, and customer promise—not maximum inventory.
11.25 Which Stockout Statistics Should Executives Review?
Executives should review lost margin, demand-based stockout rate, fill rate, inventory-record accuracy, lead-time variance, forecast error, cancellations, and stockout duration for priority products. They should also track recurring causes and preventable shortages.
12. Turning Stockout Data Into Better Product Availability
The most valuable stockout statistics do not sit in a presentation once a quarter. They connect an unavailable item to a specific demand signal, inventory record, supplier commitment, warehouse event, channel promise, and financial outcome. That connection turns the discussion from “we need more stock” into a more useful question: “Which operating decision failed, and how do we prevent the same failure?”
Start by agreeing on one stockout definition and one demand-estimation method. Then measure the rate by SKU, location, and channel, while tracking margin impact and repeat causes. Correct inventory accuracy before increasing buffers, update supplier lead times, and make channel reservations visible. Finally, evaluate whether the current software stack gives every team the same operational record.
For inventory-driven businesses that have outgrown spreadsheets and disconnected applications, Xorosoft can connect inventory, purchasing, warehousing, manufacturing, accounting, forecasting, and ecommerce operations. Explore the relevant platform through XoroONE, XoroERP, and XoroWMS.
To review your current stockout workflow against your SKU structure, warehouses, Shopify operations, purchasing process, EDI requirements, or manufacturing needs, book a personalized Xorosoft demo.
Recent Posts
-
 ERP Landed Cost Module vs Spreadsheet Calculations for Importers
 -
 How to Build an Open-to-Buy Plan for an Omnichannel Brand
 -
 Cold Storage WMS for Food and Beverage Distribution
 -
 ERP Buying Statistics 2026: Evaluation, Implementation, and Adoption Risks
 -
 How a Distributor Reduced B2B Order Exceptions Without Restricting Sales