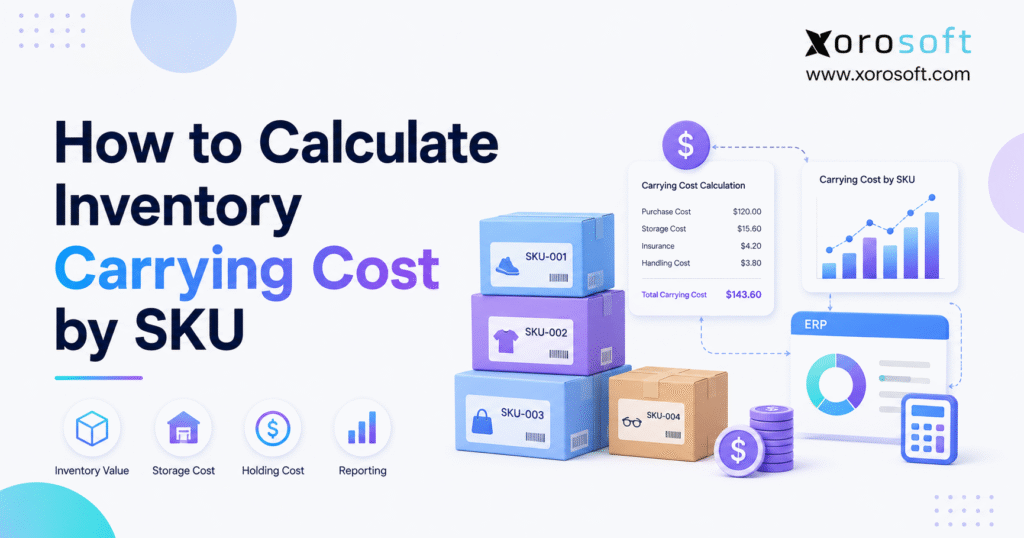
Understanding SKU carrying cost is essential for businesses looking to optimise their inventory management and profitability.
1. Why SKU Carrying Cost Deserves a Product-Level View
SKU carrying cost measures how much a business spends to keep a specific product in inventory over time. Although the purchase price matters, it represents only the beginning of the financial commitment. Every unsold unit also consumes working capital, warehouse space, insurance, labor, technology, and management attention.
Therefore, a product can look profitable on a basic margin report while quietly losing value in storage. For example, a seasonal jacket may carry an attractive gross margin in October. However, if it remains unsold until March, markdowns, storage expenses, and tied-up cash can sharply reduce its real contribution.
Most companies review inventory costs at the business level. Nevertheless, purchasing, pricing, replenishment, and markdown decisions happen at the item level. Consequently, operators need to know which products create the greatest financial burden.
The basic formula is:
SKU carrying cost = Average SKU inventory value × Annual carrying cost rate
For example, if a business holds an average of $50,000 in one SKU and applies a 24% annual rate, that item creates approximately $12,000 in annual holding expenses.
However, the formula is only a starting point. To make the result useful, the business must also decide how to allocate capital, storage, service, and risk costs across products.
1.1 What SKU Carrying Cost Means
SKU carrying cost is the total expense associated with keeping one stock-keeping unit available for sale or production during a defined period.
In practice, the calculation may include:
- The cost of capital tied up in inventory
- Warehouse rent and utilities
- Pallet, rack, bin, or cubic-space usage
- Inventory insurance
- Property taxes or related service expenses
- Warehouse handling and cycle-counting labor
- Shrinkage, theft, and damage
- Spoilage or expiration
- Product obsolescence
- Markdown exposure
- Opportunity cost
According to the QuickBooks inventory carrying cost guide, carrying cost is generally calculated by dividing inventory holding expenses by inventory value and multiplying the result by 100.
Similarly, Shopify’s inventory cost guide distinguishes storage expense from the broader financial burden of holding stock over time. Therefore, warehouse rent should not be treated as the complete cost of carrying inventory.
1.2 SKU Carrying Cost Versus Total Inventory Carrying Cost
Total inventory carrying cost measures the expense of holding all inventory across the company. In contrast, SKU carrying cost assigns part of that burden to individual products.
The distinction matters because two SKUs with the same inventory value may create very different costs.
For instance:
- A compact accessory may require little storage space.
- A sofa may consume an entire pallet position.
- A food product may require temperature-controlled storage.
- A fashion item may carry high markdown exposure.
- A fragile product may generate frequent damage.
- A component may remain unused until a future production run.
Although these products may share the same accounting value, their operational costs differ considerably. Therefore, a single flat percentage does not always provide enough detail.
1.3 Who Should Track Holding Cost per SKU?
Item-level analysis becomes especially useful when a business:
- Manages hundreds or thousands of products
- Operates multiple warehouses
- Sells through Shopify, Amazon, wholesale, or EDI
- Experiences recurring overstock or deadstock
- Carries seasonal collections
- Manages expiration dates or lot-controlled products
- Purchases against supplier minimums
- Holds bulky or fragile inventory
- Manufactures products from components
- Struggles to connect inventory value with product profitability
Moreover, the calculation becomes more important as inventory value grows. Once cash flow, warehouse capacity, or purchasing decisions depend on individual items, broad company averages stop providing enough operational insight.
1.4 Who May Not Need Detailed SKU Carrying Cost?
A very small company may not need a complex cost-allocation model. For example, a business with 20 fast-moving products, one storage location, and limited inventory value may use one overall carrying rate.
However, even a small company should review product-level cost when one item begins to create disproportionate risk. A bulky, seasonal, or expensive product can justify separate analysis even when the overall catalog remains simple.
2. Why SKU Carrying Cost Matters for Profit and Cash Flow
The purpose of the calculation is not merely to produce another inventory metric. Instead, SKU carrying cost helps teams make better decisions about cash, purchasing, warehouse capacity, forecasting, pricing, and product assortment.
2.1 SKU Carrying Cost Reveals Trapped Working Capital
Inventory appears as an asset. Nevertheless, unsold stock prevents the business from using that money elsewhere.
For example, cash tied up in slow-moving inventory cannot be used to:
- Replenish faster-selling items
- Pay suppliers earlier
- Fund marketing campaigns
- Hire additional employees
- Expand fulfillment capacity
- Develop new products
- Reduce debt
Therefore, a high-value product with weak sales velocity can create more financial pressure than its balance-sheet classification suggests.
2.2 Holding Cost per SKU Exposes Hidden Margin Erosion
Gross margin normally compares sales revenue with product cost. However, that view may exclude the financial impact of holding the product for several months.
Consider this example:
| Cost or Revenue Item | Amount per Unit |
|---|---|
| Selling price | $100 |
| Landed product cost | $55 |
| Reported gross margin | $45 |
| Allocated holding cost | $14 |
| Expected markdown risk | $8 |
| Adjusted contribution | $23 |
Initially, the product appears to generate $45 in gross margin. Nevertheless, after adding holding expense and markdown exposure, its contribution falls to $23.
Consequently, operators should not evaluate slow-moving products using gross margin alone.
2.3 Product-Level Carrying Cost Improves Purchasing Discipline
Purchasing teams often focus on unit price, supplier discounts, and minimum order quantities. However, a lower unit price does not always produce a lower total cost.
Suppose a supplier offers a 7% discount when the business doubles its order. At first, the discount may appear attractive. Yet the additional inventory could remain in storage for nine months. As a result, financing, storage, and markdown costs may exceed the savings.
Therefore, buyers should compare purchasing discounts against the projected cost of holding the extra units.
2.4 SKU Carrying Cost Identifies Warehouse Pressure
Some items consume far more warehouse capacity than their revenue or margin justifies.
For example, low-value furniture, oversized sporting goods, or slow-moving wholesale cases can occupy valuable locations for months. Meanwhile, faster-moving products may be stored in less efficient areas because prime space is unavailable.
Accordingly, SKU carrying cost supports better slotting, replenishment, and assortment decisions.
2.5 Item-Level Carrying Cost Improves Forecasting Priorities
Not every forecasting error has the same financial consequence.
A 10% overforecast on a fast-moving accessory may resolve within weeks. In contrast, a 10% overforecast on seasonal furniture or perishable food may create months of cost, markdowns, or waste.
Therefore, product-level carrying exposure helps planners identify where forecasting accuracy matters most.
3. The Inventory Carrying Cost Formula
The company-level formula is:
Inventory carrying cost percentage = Total inventory holding expenses ÷ Average inventory value × 100
For example:
- Annual holding expenses: $240,000
- Average inventory value: $1,000,000
- Carrying rate: 24%
Calculation:
$240,000 ÷ $1,000,000 × 100 = 24%
As a result, the business spends approximately $0.24 each year for every $1 held in average inventory.
The Investopedia overview of inventory carrying costs includes storage, handling, insurance, taxes, depreciation, shrinkage, obsolescence, and opportunity cost among the potential components.
3.1 Calculating Average Inventory Value
A simple average can be calculated as:
Average inventory value = (Beginning inventory value + Ending inventory value) ÷ 2
For example:
- Beginning inventory value: $900,000
- Ending inventory value: $1,100,000
Calculation:
($900,000 + $1,100,000) ÷ 2 = $1,000,000
Although this formula is easy to use, it may not capture significant seasonal changes. Therefore, businesses with volatile inventory should use monthly, weekly, or daily average values whenever reliable data is available.
3.2 Calculating Annual Inventory Holding Cost
Once the rate is known, annual holding expense can be calculated as:
Annual holding expense = Average inventory value × Carrying rate
Using the previous example:
$1,000,000 × 24% = $240,000
3.3 Calculating Monthly Inventory Holding Cost
Next, divide the annual result by 12:
Monthly holding expense = Annual holding expense ÷ 12
Therefore:
$240,000 ÷ 12 = $20,000 per month
Monthly reporting is particularly useful because operators can compare inventory expense against recent sales, purchasing, and cash-flow performance.
4. How to Calculate SKU Carrying Cost Step by Step
The simplest product-level formula is:
SKU carrying cost = Average SKU inventory value × Annual carrying cost rate
Suppose a product has:
- Beginning inventory value: $40,000
- Ending inventory value: $60,000
- Company carrying rate: 24%
First, calculate the average value:
($40,000 + $60,000) ÷ 2 = $50,000
Next, apply the annual rate:
$50,000 × 24% = $12,000
Therefore, the estimated annual cost of holding that product is $12,000.
4.1 Step 1: Choose the Measurement Period
Begin by deciding whether the calculation will cover a month, quarter, or year.
Annual analysis supports strategic planning. Quarterly analysis works well for purchasing reviews. Meanwhile, monthly analysis is more useful for cash flow and operating meetings.
4.2 Step 2: Calculate Average SKU Inventory Value
Use:
Average SKU inventory value = (Beginning SKU value + Ending SKU value) ÷ 2
However, if stock changes significantly during the period, use weekly or daily averages. As a result, the calculation will better reflect the inventory actually held.
4.3 Step 3: Apply the SKU Carrying Cost Rate
Once the average value is known, multiply it by the annual carrying rate.
For example:
$50,000 × 24% = $12,000
This basic method works when products have similar storage, handling, and risk profiles.
4.4 Step 4: Add Product-Specific Cost Adjustments
A more accurate model adds product-specific expenses for:
- Unusual storage requirements
- High damage rates
- Seasonal markdown risk
- Expiration exposure
- Extra handling
- Special insurance
- High return rates
- Long production delays
Therefore, category or SKU-level adjustments can produce a more realistic number than a universal rate.
4.5 Step 5: Convert SKU Carrying Cost to a Monthly Amount
To calculate the monthly amount:
$12,000 ÷ 12 = $1,000 per month
This monthly view makes the cost easier to compare against recent revenue and margin.
4.6 Step 6: Convert SKU Carrying Cost to a Per-Unit Amount
Suppose the company holds 500 units on average.
Annual holding cost per unit = $12,000 ÷ 500
Therefore:
Annual holding cost per unit = $24
However, this does not necessarily mean every sold unit should absorb exactly $24. Instead, the result provides a planning estimate based on the average inventory position.
4.7 Step 7: Adjust the Result for Time in Stock
A unit that sells within 30 days should not absorb the same expense as one that sits for 12 months.
Therefore:
Estimated unit holding cost = Annual cost per unit × Percentage of year held
If the annual amount is $24 and a unit remains in stock for three months:
$24 × 25% = $6
Consequently, the estimated cost of holding that unit for three months is $6.
5. Cost Components Included in SKU Carrying Cost
A complete model generally groups costs into four categories:
1. Capital cost
2. Storage cost
3. Service cost
4. Risk cost
However, each category should be adapted to the business.
5.1 Capital Cost by SKU
Capital cost represents the financial cost of money invested in inventory.
If inventory is funded through borrowing, the calculation may include interest. Alternatively, if the business uses its own cash, it may use an internal required return or opportunity-cost rate.
For example, suppose $50,000 remains tied up in one product while the company’s annual capital rate is 10%.
$50,000 × 10% = $5,000
Therefore, the product creates approximately $5,000 in annual capital cost before storage or risk is considered.
5.2 Storage Cost per SKU
Storage cost includes the expense of physically keeping inventory available.
Relevant expenses may include:
- Warehouse rent
- Utilities
- Racking
- Bins
- Pallet positions
- Security
- Material-handling equipment
- Temperature control
- Warehouse technology
- Facility maintenance
However, allocation methods should match product characteristics. A value-based approach may work for small items with similar space requirements. In contrast, bulky inventory should usually receive a space-based allocation.
5.2.1 Space-Based Storage Allocation
Suppose:
- Annual warehouse cost: $500,000
- SKU share of occupied cubic space: 4%
Calculation:
$500,000 × 4% = $20,000
Therefore, the product receives $20,000 in allocated annual warehouse cost.
5.3 Service Cost per SKU
Service costs support the ongoing management and protection of inventory.
They may include:
- Insurance
- Property taxes
- Inventory audits
- Cycle counting
- Compliance procedures
- Quality-control activities
- Inventory-system expenses
Although service expenses may appear small individually, they can become material across a large catalog.
5.4 Inventory Risk Cost by SKU
Risk cost reflects the possibility that stock will lose value before it sells or enters production.
Common risk categories include:
- Theft
- Shrinkage
- Damage
- Spoilage
- Expiration
- Product obsolescence
- Seasonal markdowns
- Returns
- Recalls
- Packaging changes
For example, an evergreen replacement part may have relatively low obsolescence exposure. Conversely, a fashion product tied to one season may lose a large percentage of its value within several months.
Therefore, category-specific risk assumptions usually provide a more realistic result than one universal rate.
6. Methods for Allocating Holding Cost per SKU
The appropriate allocation method depends on the type of expense being distributed.
| Allocation Method | Best Used For | Primary Limitation |
| Inventory-value allocation | Capital, insurance, general risk | Can understate bulky products |
| Space-based allocation | Rent, utilities, racking | Requires reliable cube or location data |
| Activity-based allocation | Handling, counting, internal transfers | Requires operational transaction data |
| Category-based allocation | Obsolescence, spoilage, markdowns | Depends on sound category assumptions |
6.1 Inventory-Value Allocation
Under this method, each product receives a percentage of company expenses based on its share of average inventory value.
For example:
- Average SKU value: $50,000
- Total average inventory value: $1,000,000
- SKU share: 5%
- Allocated expense pool: $200,000
Calculation:
$200,000 × 5% = $10,000
This approach is simple. Nevertheless, it may misrepresent products with unusual storage or handling requirements.
6.2 Space-Based Allocation
Space-based allocation is appropriate when warehouse capacity drives the expense.
Useful measures include:
- Cubic feet
- Pallet positions
- Bin locations
- Rack bays
- Square feet
- Temperature-controlled zones
Therefore, this method is particularly valuable for furniture, appliances, industrial products, and oversized sporting goods.
6.3 Activity-Based Allocation
Activity-based allocation assigns costs based on operational effort.
Possible drivers include:
- Number of receipts
- Number of picks
- Number of transfers
- Cycle-count frequency
- Return volume
- Special handling events
For instance, a fragile product that requires repeated inspection and repacking may receive more handling cost than a sealed case-pack item.
6.4 Category-Based Allocation
Category-based allocation applies different assumptions to groups of similar products.
For example:
- Core replenishment products: 18%
- Seasonal apparel: 28%
- Bulky furniture: 32%
- Short-shelf-life food: 38%
Although the rates remain estimates, they often provide a better operating view than applying one rate to every product.
7. SKU Carrying Cost Example
Consider a seasonal footwear product.
| Input | Amount |
| Average inventory value | $80,000 |
| Capital allocation | $8,000 |
| Storage allocation | $9,500 |
| Service allocation | $2,500 |
| Risk and markdown allocation | $7,000 |
| Total annual holding expense | $27,000 |
The effective carrying rate is:
$27,000 ÷ $80,000 × 100 = 33.75%
Therefore, the product costs approximately 33.75% of its average value to hold annually.
If average units on hand equal 1,500:
$27,000 ÷ 1,500 = $18 per average unit
Furthermore, if the reported gross margin is only $25 per unit, the inventory economics require immediate review.
Possible actions include:
- Reducing future purchase quantities
- Ordering closer to the selling season
- Negotiating smaller supplier minimums
- Increasing full-price sell-through
- Moving stock to stronger locations
- Starting markdowns earlier
- Discontinuing weak variants
7.1 How SKU Carrying Cost Changes True Profitability
Basic product reporting often includes:
- Selling price
- Product cost
- Freight
- Duties
- Marketplace fees
- Payment fees
However, it may exclude the cost of waiting for the product to sell.
A more complete contribution analysis is:
Adjusted SKU contribution = Revenue − Landed cost − Selling expenses − Allocated holding expense
For example:
| Profitability Item | Amount |
| Net selling revenue | $120 |
| Landed cost | $62 |
| Channel and fulfillment cost | $18 |
| Reported contribution | $40 |
| Allocated holding expense | $13 |
| Adjusted contribution | $27 |
Consequently, the product’s contribution falls by 32.5% after holding expense is considered.
8. SKU Carrying Cost Versus Other Inventory Metrics
8.1 SKU Carrying Cost Versus Landed Cost
Landed cost measures what it costs to acquire a product and bring it into inventory.
It may include:
- Supplier price
- Freight
- Duties
- Tariffs
- Brokerage
- Insurance during transportation
- Inbound handling
In contrast, carrying cost begins after the product arrives or becomes available.
Therefore:
- Landed cost answers, “What did it cost to obtain this product?”
- Holding cost answers, “What does it cost to keep this product until it sells or is used?”
Both numbers are necessary for accurate profitability analysis.
8.2 SKU Carrying Cost Versus COGS
Cost of goods sold reflects the inventory cost assigned to products that have been sold during a period.
Holding expense, however, represents the cost created while products remain in stock. Consequently, it may not be fully visible in a gross-margin report.
Accounting treatment depends on company policy and applicable requirements. Therefore, finance teams should determine how expenses are recorded, while operators use the metric for planning.
8.3 Holding Cost Versus Ordering Cost
Ordering cost includes the expense of purchasing and receiving inventory.
It may include:
- Purchase-order preparation
- Supplier communication
- Receiving labor
- Inspection
- Freight coordination
- Invoice matching
- Administrative processing
If a company orders smaller quantities more frequently, holding expense may fall while ordering expense rises. Conversely, larger and less frequent purchases may reduce ordering activity while increasing storage and capital exposure.
Therefore, purchasing teams should balance both cost categories rather than minimizing one in isolation.
8.4 How Carrying Cost Affects EOQ
Economic order quantity attempts to balance ordering and holding expenses.
Although a complete EOQ model requires stable assumptions, its core lesson remains useful: buying more inventory reduces ordering frequency but increases the amount held.
Consequently, an inaccurate carrying-cost assumption can produce an unrealistic recommended order quantity.
9. Multi-Warehouse SKU Carrying Cost
The same item may produce different costs in different locations.
For example:
- Rent may be higher in one market.
- Labor efficiency may differ by warehouse.
- Regional sales velocity may vary.
- Transfer activity may increase handling expense.
- Safety-stock requirements may differ.
- One warehouse may use a 3PL fee structure.
Therefore, multi-location businesses should calculate cost by both SKU and warehouse whenever possible.
9.1 Location-Level SKU Carrying Cost Example
Suppose one product has the following inventory:
| Location | Average Value | Annual Rate | Estimated Annual Cost |
| Warehouse East | $30,000 | 20% | $6,000 |
| Warehouse West | $30,000 | 31% | $9,300 |
Although both locations hold the same inventory value, the western warehouse costs $3,300 more annually.
As a result, the business should investigate storage rates, sales velocity, labor, or transfer patterns before replenishing both sites equally.
A connected warehouse management system can make location-level analysis more practical because balances, movements, receiving, picking, and transfers remain visible in one workflow.
10. SKU Carrying Cost for Shopify and Multi-Channel Operations
Shopify merchants often sell the same product through several channels. For example, inventory may support a Shopify storefront, Amazon listings, wholesale orders, and marketplace demand simultaneously.
However, each channel can create different:
- Sales velocity
- Fulfillment cost
- Return rates
- Inventory-allocation rules
- Service-level expectations
- Warehouse requirements
Therefore, operators should avoid analyzing product cost without channel context.
Xorosoft is available through the Shopify App Store, while its broader integration capabilities support businesses that need to connect ecommerce activity with inventory, orders, purchasing, and warehouse operations.
11. Industry Examples of Holding Cost per SKU
11.1 Apparel and Fashion SKU Costs
Apparel businesses often manage combinations of style, size, color, season, and collection.
Consequently, one popular style may still create excess inventory in less popular sizes or colors. Moreover, seasonal windows increase markdown exposure.
Apparel teams should evaluate:
- Variant-level sales velocity
- Weeks of supply
- Seasonal exit dates
- Return rates
- Markdown history
- Supplier minimums
- Size-level imbalances
11.2 Furniture SKU Costs
Furniture products consume significant storage space and may require special handling.
Therefore, value-based allocation alone may understate their real cost. Instead, operators should consider pallet positions, floor space, cube, handling labor, and damage exposure.
11.3 Sporting Goods SKU Costs
Sporting-goods demand often changes by sport, season, climate, and region.
For example, winter equipment may sell quickly in one warehouse while remaining slow in another. Consequently, warehouse-level demand and transfer costs become essential inputs.
11.4 Food and Beverage SKU Costs
Food businesses must consider:
- Expiration dates
- Lot controls
- Spoilage
- Temperature requirements
- Compliance
- Recall exposure
- First-expired, first-out procedures
Therefore, risk cost may be significantly higher than it is for durable goods.
11.5 Wholesale Distribution SKU Costs
Wholesalers frequently manage customer-specific pricing, case packs, allocations, EDI requirements, and supplier minimums.
Accordingly, product-level holding expense can reveal where large supplier purchases or customer commitments create excess working-capital pressure.
11.6 Manufacturing SKU Costs
Manufacturers hold raw materials, components, work in progress, and finished goods.
However, a component may remain unused because another material is unavailable. As a result, carrying cost can accumulate even when the component itself has no demand problem.
Manufacturers should connect the analysis with:
- Bills of materials
- Work orders
- Material requirements
- Production schedules
- Supplier lead times
- Component substitutions
12. How to Find High SKU Carrying Cost Products
Begin by ranking products by total annual holding expense. Next, compare the result with inventory value, margin, and sales velocity.
12.1 High Value and Low Velocity
These products tie up substantial capital while producing limited sales.
Therefore, purchasing quantities, supplier minimums, and discontinuation plans should be reviewed.
12.2 High Storage Cost and Low Margin
These products consume warehouse capacity without generating enough contribution.
As a result, they may require different storage, pricing, or assortment decisions.
12.3 High Markdown or Obsolescence Risk
Seasonal, trend-driven, electronic, and packaging-sensitive items often lose value quickly.
Consequently, the business should define earlier review and exit dates.
12.4 High Damage or Return Exposure
Fragile or complex products may create handling and reverse-logistics expense.
Therefore, packaging, slotting, supplier quality, and fulfillment methods should be examined.
12.5 High Minimum-Order Exposure
Some products are overstocked because suppliers require quantities above realistic demand.
Accordingly, the business may need to negotiate split deliveries, smaller minimums, or longer ordering commitments.
13. Common SKU Carrying Cost Calculation Mistakes
13.1 Applying One Rate to Every Product
A flat rate is easy to maintain. However, it can hide important differences between compact, bulky, seasonal, fragile, and expiring inventory.
Therefore, businesses should at least use category-level rates when product profiles differ substantially.
13.2 Using Only Beginning and Ending Balances
A two-point average can be distorted by seasonal peaks or unusual purchasing.
Instead, weekly or monthly averages should be used when inventory changes significantly during the year.
13.3 Ignoring Landed Cost
If the underlying product value excludes relevant freight, duties, or inbound charges, the holding calculation may be understated.
Consequently, inventory valuation must be reviewed before product-level expense is calculated.
13.4 Ignoring Warehouse Space
Value does not always correspond with space.
For example, low-value furniture may occupy more capacity than high-value accessories. Therefore, space-based allocation is necessary for many bulky catalogs.
13.5 Excluding Obsolescence and Markdown Risk
A product does not need to be physically damaged to lose value.
Season changes, trends, model updates, packaging revisions, and expiration can all reduce recoverable value. Accordingly, these risks should be included where material.
13.6 Treating SKU Carrying Cost as a Finance-Only Metric
Finance may calculate the rate, but operations, purchasing, merchandising, and warehouse teams create the decisions that change it.
Therefore, the metric should be reviewed cross-functionally.
14. Spreadsheet, Inventory Software, or ERP?
Businesses can calculate product-level holding expense using several tools. However, the appropriate method depends on data complexity and decision frequency.
| Approach | Best For | Main Strength | Main Limitation |
| Spreadsheet | Small catalogs and periodic reviews | Flexible and inexpensive | Manual updates and version errors |
| Inventory software | Quantity and location visibility | Better stock tracking | May lack financial and purchasing context |
| ERP platform | Connected inventory-driven operations | Unified operational and financial data | Requires structured implementation |
14.1 When a Spreadsheet Is Enough
A spreadsheet may be sufficient when:
- The catalog is small
- Costs are stable
- There is one warehouse
- Analysis is completed quarterly
- Inventory data is clean
- Purchasing is straightforward
Nevertheless, spreadsheet models should document assumptions and use controlled source data.
14.2 When Inventory Software Is Enough
Inventory software can support the calculation when it provides reliable quantities, item costs, locations, and movement history.
However, additional accounting or purchasing data may still need to be imported.
14.3 When ERP Supports SKU Carrying Cost Better
A connected system becomes more useful when:
- Inventory spans multiple locations
- Purchasing changes frequently
- Landed costs must be updated
- Shopify, Amazon, wholesale, and EDI orders share stock
- Warehouse activity affects product cost
- Finance needs current inventory valuation
- Forecasting depends on live operational data
For inventory-driven businesses, XoroONE is the first platform to evaluate when the objective is to connect inventory management, purchasing, accounting, warehouse management, forecasting, manufacturing, and ecommerce operations.
Additionally, XoroERP supports businesses that have outgrown fragmented spreadsheets or inventory-only applications. Rather than treating the formula as a standalone report, connected ERP data can turn it into an ongoing purchasing and profitability workflow.
15. How to Reduce SKU Carrying Cost
Once high-cost products are identified, teams can act on the underlying cause.
15.1 Improve Demand Forecasting
First, prioritize products with high value, long lead times, strong seasonality, or high obsolescence exposure.
Because forecast errors on these items are expensive, even modest accuracy improvements can release meaningful working capital.
15.2 Reduce Reorder Quantities
Smaller purchase quantities can reduce average inventory value.
However, teams should consider supplier minimums, freight economics, lead times, and stockout risk before changing order sizes.
15.3 Order More Frequently
More frequent orders can lower the average amount held.
Nevertheless, ordering and receiving expenses may increase. Therefore, the change should be evaluated using total cost rather than carrying expense alone.
15.4 Negotiate Supplier Terms
Potential improvements include:
- Lower minimum order quantities
- Split deliveries
- Longer payment terms
- Consignment inventory
- Vendor-managed inventory
- Seasonal commitments
- More frequent replenishment
As a result, the business may reduce cash exposure without reducing product availability.
15.5 Improve Warehouse Slotting
Fast-moving products should generally occupy accessible locations. Meanwhile, bulky or slow-moving items should not consume premium pick faces unless operational requirements justify them.
Better slotting can therefore reduce travel, handling, damage, and space expenses.
15.6 Transfer Inventory Before It Becomes Deadstock
A product may sell slowly in one warehouse but quickly in another.
Consequently, location-level demand should be reviewed before markdowns or new purchases are approved.
15.7 Review Slow Movers Regularly
Operators should establish review thresholds based on:
- Days on hand
- Last sale date
- Weeks of supply
- Margin
- Inventory value
- Seasonal deadline
- Annual holding expense
Therefore, weak products can be addressed before they require severe markdowns.
16. When Manual SKU Carrying Cost Analysis Stops Working
A company may need better inventory infrastructure when it cannot quickly answer:
- Which products tie up the most cash?
- Which items cost the most to store?
- Which warehouse holds excess stock?
- Which products lose money after holding expense?
- Which supplier minimums create overstock?
- Which SKUs should be transferred?
- Which products need earlier markdowns?
- Which purchase orders will increase working-capital pressure?
If these questions require repeated exports, manual joins, and spreadsheet cleanup, the underlying systems are probably too disconnected.
The Xorosoft solutions are designed for inventory-driven businesses that need inventory, orders, purchasing, warehouse activity, accounting, manufacturing, and reporting to operate from connected data.
Furthermore, reviewing relevant Xorosoft case studies can help operators understand how other product businesses approach inventory accuracy, warehouse efficiency, and operational visibility.
17. SKU Carrying Cost FAQs
17.1 What Is SKU Carrying Cost?
SKU carrying cost is the expense of holding one specific stock-keeping unit during a defined period. It can include capital, storage, insurance, taxes, labor, shrinkage, damage, spoilage, obsolescence, and opportunity cost. Therefore, it provides a more complete view of product economics than purchase price or gross margin alone.
17.2 How Do You Calculate Carrying Cost for One SKU?
First, calculate the product’s average inventory value. Next, multiply that value by the annual carrying rate. For example, a product with $50,000 in average inventory value and a 24% rate creates $12,000 in estimated annual holding expense.
17.3 What Is the Formula for Average SKU Inventory Value?
Use:
Average SKU inventory value = (Beginning SKU value + Ending SKU value) ÷ 2
However, businesses with seasonal or volatile stock should use monthly, weekly, or daily averages for greater accuracy.
17.4 What Costs Should Be Included?
Relevant expenses may include capital, warehouse space, utilities, insurance, taxes, handling, cycle counting, shrinkage, damage, expiration, obsolescence, markdowns, and opportunity cost.
17.5 What Is a Reasonable Carrying-Cost Percentage?
There is no universal rate because capital, storage, risk, velocity, and industry conditions differ. Although general reference ranges are often used for planning, businesses should calculate their own rate from actual expenses whenever possible.
17.6 Is Carrying Cost the Same as Storage Cost?
No. Storage cost covers the physical expense of warehousing inventory. In contrast, carrying cost also includes capital, service, risk, obsolescence, shrinkage, and opportunity cost.
17.7 Is Carrying Cost Included in COGS?
Not necessarily. COGS generally reflects the cost assigned to products that were sold. However, inventory holding expenses may be recorded elsewhere depending on accounting policy.
17.8 How Do You Calculate Monthly Holding Cost?
First, calculate the annual product-level expense. Next, divide the result by 12. For example, $12,000 in annual cost equals $1,000 per month.
17.9 How Do You Calculate Holding Cost per Unit?
Divide the product’s total annual holding expense by its average units on hand. However, because products remain in stock for different periods, a time-adjusted estimate may be more useful.
17.10 How Should Warehouse Costs Be Allocated?
Warehouse expense can be assigned by inventory value, cubic space, pallet positions, bin locations, units, or activity. Therefore, the allocation driver should reflect the actual source of the cost.
17.11 How Does Carrying Cost Affect Purchasing?
The metric helps buyers compare unit-price discounts with the cost of holding additional inventory. Consequently, it supports better decisions about order quantities, frequency, supplier minimums, and payment terms.
17.12 Can Shopify Calculate the Full Amount?
Shopify provides valuable sales and inventory information. However, a complete calculation may also require accounting, warehouse, purchasing, landed-cost, and risk data.
17.13 Can a Spreadsheet Calculate the Metric?
Yes. A spreadsheet can work when the catalog, locations, and cost structure are simple. However, manual models become harder to maintain as data volume and operational complexity grow.
17.14 When Should a Business Use an ERP?
An ERP becomes more useful when the calculation depends on current data from inventory, purchasing, accounting, warehouse management, manufacturing, forecasting, and ecommerce channels.
17.15 Which Products Usually Have the Highest Holding Expense?
High-cost products are often slow-moving, high-value, bulky, fragile, seasonal, expiring, or subject to large supplier minimums. However, actual rankings should be based on company data rather than assumptions.
18. Turn SKU Carrying Cost Into Better Inventory Decisions
SKU carrying cost is valuable because it connects a product’s inventory value with the real expense of waiting for that product to sell.
The basic formula remains straightforward:
SKU carrying cost = Average SKU inventory value × Annual carrying cost rate
However, the strongest analysis goes further. It separates capital, storage, service, and risk costs. Moreover, it adjusts assumptions for product size, velocity, seasonality, damage exposure, expiration, and warehouse location.
As a result, operators can identify which products deserve more inventory, which require smaller orders, which need earlier markdowns, and which should leave the assortment entirely.
Nevertheless, accurate analysis depends on connected data. When inventory, purchasing, warehouse management, Shopify, Amazon, manufacturing, and accounting operate separately, product-level profitability becomes difficult to maintain.
Xorosoft brings those workflows together through cloud ERP, warehouse management, inventory planning, ecommerce integrations, purchasing, and financial reporting. Therefore, inventory-driven businesses can move beyond one-time spreadsheet calculations and use product-cost visibility in regular operating decisions.
Book a Demo to see how connected inventory and warehouse data can support better purchasing, forecasting, cash flow, and product profitability decisions.
Search
Categories
- Accounting & QuickBooks 227
- AI & Automation 585
- E-commerce & Marketplaces 1,202
- EDI & B2B 150
- ERP 573
- ERP Selection & Comparisons 166
- Industries 230
- Integrations 138
- Shopify ERP 138
- Inventory Management 1,206
- Order Management & Fulfillment 578
- Procurement & Supply Chain 9
- Procurement, Purchasing & Reordering 417
- Resources 250
- Shopify 649
- Solutions 606
- Warehouse & WMS 1,078
Recent Posts
-
 ERP Landed Cost Module vs Spreadsheet Calculations for Importers
 -
 How to Build an Open-to-Buy Plan for an Omnichannel Brand
 -
 Cold Storage WMS for Food and Beverage Distribution
 -
 ERP Buying Statistics 2026: Evaluation, Implementation, and Adoption Risks
 -
 How a Distributor Reduced B2B Order Exceptions Without Restricting Sales