If you’re looking for the latest ecommerce returns statistics, you’re in the right place.
1. Ecommerce Returns Statistics for 2026 Point to a Growing Operations Challenge
1.1 Ecommerce Returns Statistics Show Why Returns Now Affect More Than Customer Service
Returns have become one of ecommerce’s most expensive operational contradictions. Customers want a convenient buying experience and an equally convenient way to send products back. Retailers, meanwhile, need to protect margins, recover inventory quickly, control fraud, and keep warehouse and accounting records accurate.
That tension makes ecommerce returns statistics particularly important in 2026. A return no longer represents only a customer-service event. It can influence conversion before a customer buys, transportation costs after fulfillment, warehouse capacity when inventory comes back, available-to-sell stock, accounting entries, replenishment decisions, and customer lifetime value.
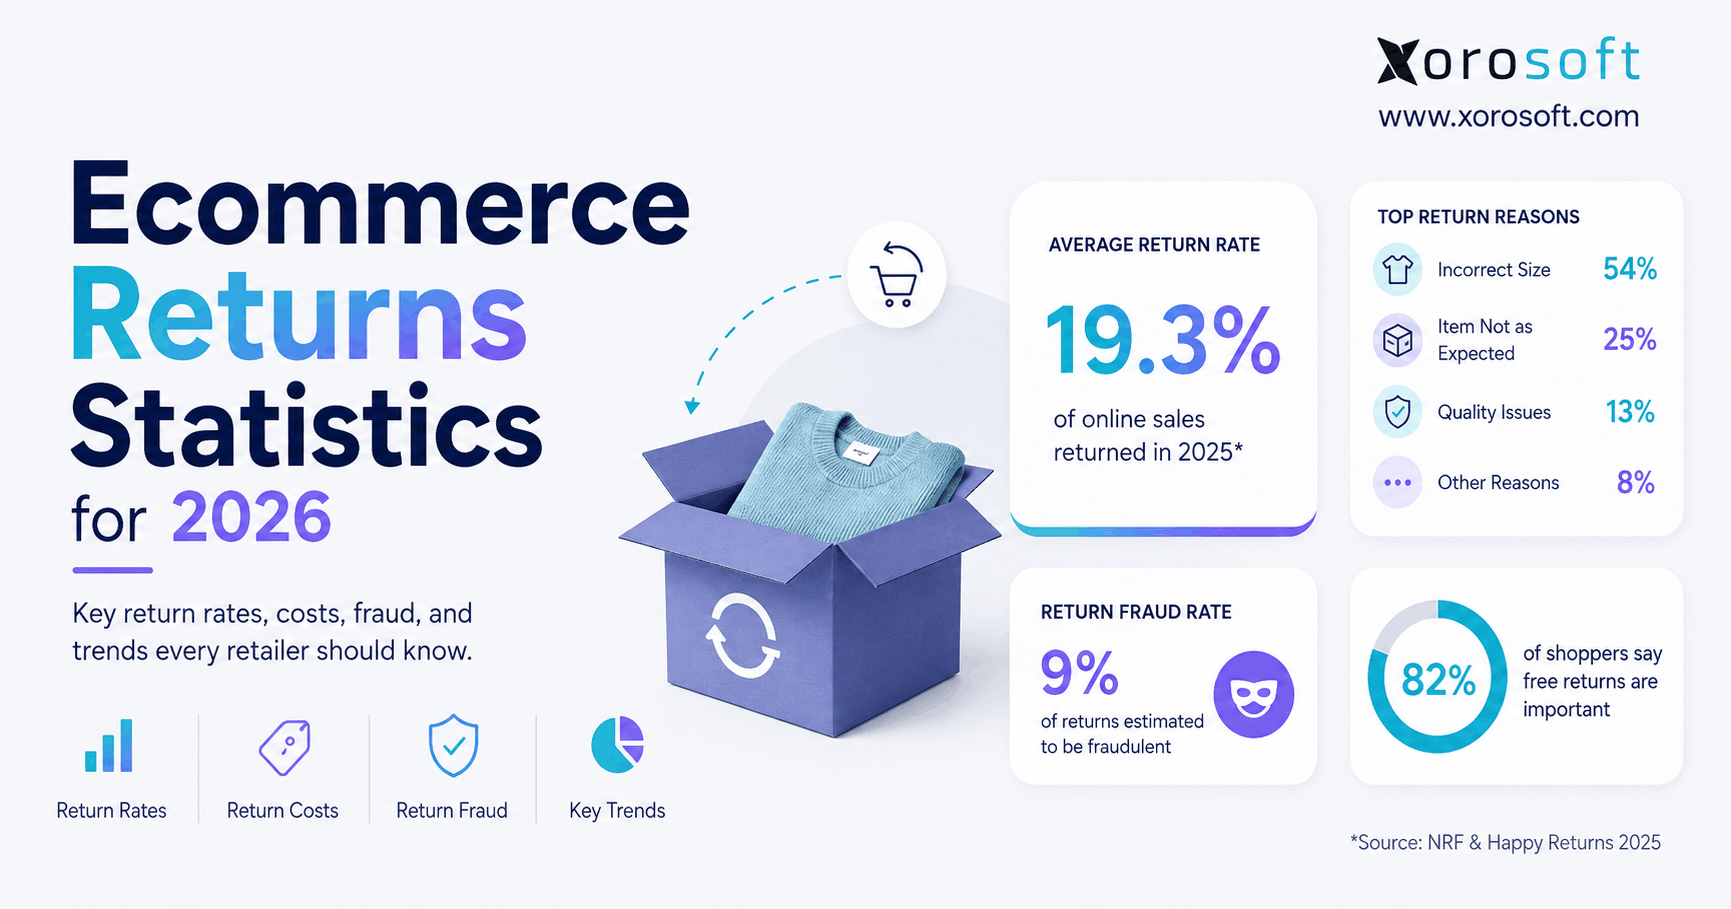
As of August 2026, the market does not yet have a finalized NRF full-year ecommerce return rate for 2026. The latest annual NRF and Happy Returns benchmark estimates that consumers returned 19.3% of online sales in 2025, compared with 15.8% across retail overall. NRF also projected total U.S. retail returns at approximately $849.9 billion.
The distinction matters. A credible 2026 article should not take a 2025 annual return benchmark, change the year in the headline, and present it as new data.
Instead, businesses should combine the latest annual benchmark with newer 2026 consumer, merchant, logistics, and returns-management research.
1.2 New 2026 Ecommerce Returns Data Shows How Consumer Expectations Are Changing
Several large studies add current context.
DHL surveyed 29,000 online shoppers and 5,800 ecommerce businesses across 29 countries. Its 2026 research found that seven in ten shoppers may abandon a cart when they cannot access their preferred delivery and return options. More than six in ten returns now occur through out-of-home locations such as parcel shops and lockers.
FedEx also found that return policies increasingly influence purchasing decisions. Nearly two-thirds of surveyed consumers said a retailer’s return policy affects whether they buy, while usage of no-box, no-label returns among people who make returns climbed from 31% to 41%.
ICSC found additional evidence that policy design matters. Its 2026 research showed that 67% of online shoppers become less likely to purchase when retailers charge return fees.
Loop, meanwhile, analyzed 23.4 million returns from more than 4,000 Shopify merchants. Its 2026 benchmark found widespread use of exchanges and selective return fees.
Taken together, these ecommerce returns statistics show that retailers must think about returns as both a commercial and operational process.
1.3 The Real Ecommerce Returns Problem Starts After the Refund
The headline return rate tells only part of the story.
Once a customer sends a product back, someone must receive it, inspect it, determine its condition, decide whether to restock it, update inventory, process the financial impact, and potentially adjust purchasing or forecasting.
For ecommerce operators, the more useful question is therefore not simply, “How many products come back?”
A better question is: Which returns can we prevent, what does each return cost, and how quickly can we recover value from the inventory that comes back?
2. Average Ecommerce Return Rate and the Benchmark Retailers Should Use
2.1 What Ecommerce Returns Statistics Say About the Average Online Return Rate
The strongest current U.S. annual benchmark comes from NRF and Happy Returns. Their latest research estimates that consumers returned 19.3% of online sales in 2025.
That means ecommerce faces materially more return pressure than retail overall, where NRF reported a 15.8% return rate.
Businesses should treat the 19.3% figure as a broad benchmark rather than a target. Product category, price point, customer mix, geography, selling channel, return policy, fulfillment quality, and product complexity can move an individual retailer far above or below that number.
A fashion merchant with frequent fit-related returns should not compare itself directly with a consumables business. Likewise, a furniture retailer that handles fewer but extremely expensive returns should track a different set of operational metrics.
2.2 How to Calculate an Ecommerce Return Rate
The most common unit-based formula is straightforward:
Ecommerce Return Rate = Returned Units ÷ Units Sold × 100
If a retailer sells 20,000 units and customers return 3,400, the return rate equals 17%.
The arithmetic is simple. Useful analysis requires more detail.
Companies should calculate return rates by SKU, category, size, supplier, channel, location, return reason, and customer cohort where transaction volume supports meaningful comparison.
A retailer with a 17% company-wide rate might have most products running below 10% while one high-volume product exceeds 40%. The overall number hides the real issue.
2.3 Online Returns Statistics vs. Overall Retail Returns
NRF’s latest benchmark places online returns at 19.3% and overall retail returns at 15.8%. That creates a difference of 3.5 percentage points.
The 15.8% figure represents retail overall rather than a pure in-store-only rate. Even so, the difference reflects a structural challenge in ecommerce.
Customers buying online cannot physically inspect, wear, test, or compare products before placing an order. Online shopping therefore transfers some purchase uncertainty from the pre-sale experience into the post-sale returns process.
2.4 What Is a Good Ecommerce Return Rate?
No universal number defines a good ecommerce return rate.
A useful benchmark compares similar businesses with similar products, price points, selling channels, geographic markets, and return policies.
Operators should also avoid pursuing a low return rate at any cost. A restrictive policy may reduce returns while simultaneously hurting conversion, repeat purchases, and customer trust.
The right objective combines manageable returns with healthy margins, strong retained revenue, accurate inventory, and a customer experience that supports long-term growth.
3. Ecommerce Returns Statistics by Product Category
3.1 Apparel and Fashion Ecommerce Return Rates
Fashion continues to experience some of the highest return pressure in ecommerce because customers cannot fully judge size, fit, fabric, color, or comfort before receiving the product.
Radial and Two Boxes surveyed retailers for their State of Retail Returns research. Among apparel and footwear companies, 56% reported return rates of 30% or higher.
That statistic does not mean the average apparel return rate equals 30%. Instead, it shows that more than half of the surveyed brands in those categories operated at or above that level.
DHL research also found that incorrect sizing remains a major return driver. The company reported that 54% of shoppers who returned products cited incorrect sizing, while product quality and unmet expectations also played significant roles.
3.2 Footwear Return Rates and Fit-Driven Ecommerce Returns
Footwear creates many of the same challenges as apparel.
Brand-specific sizing, width, comfort, materials, and intended use can all affect whether a customer keeps a product. Two shoppers who normally wear the same numerical size may have completely different experiences with the same shoe.
For that reason, footwear merchants should analyze returns by model, size, width, and return reason.
A generic category benchmark can provide context, but internal product-level data usually identifies the real opportunity.
3.3 Electronics Returns Require More Than a Percentage
Electronics returns frequently involve compatibility problems, setup difficulty, defects, unmet performance expectations, or buyer remorse.
The downstream process can also cost more than a standard apparel return. Employees may need to test the product, verify accessories, wipe stored information, restore packaging, and determine whether the item still qualifies for full-price resale.
For electronics sellers, the return rate alone cannot explain profitability. Recovery value, inspection cost, and time-to-resale also matter.
3.4 Furniture and Home Goods Create Expensive Reverse Logistics
Furniture merchants may process fewer returns than fashion brands, but each return can carry substantially higher costs.
Large products often require scheduled pickups, specialized transportation, additional warehouse space, inspection, repair, or markdowns.
Product dimensions, color representation, room fit, delivery damage, and customer expectations can all influence return behavior.
Furniture operators should therefore combine return frequency with cost per return and resale recovery.
3.5 Why Ecommerce Returns Statistics Need Category Context
Current ecommerce returns statistics show meaningful differences between categories, but no responsible benchmark can assign a precise current return rate to every ecommerce segment.
Where reliable primary data does not exist, businesses should avoid filling the gap with unsupported estimates.
External benchmarks work best when companies pair them with their own SKU-level data, product margins, return reasons, and disposition results.
4. Why Customers Return Online Purchases
4.1 Product Expectations Drive Many Preventable Ecommerce Returns
Many returns start before the customer clicks the buy button.
Product photography, sizing information, descriptions, dimensions, compatibility details, reviews, and merchandising all shape expectations. When the delivered product fails to match those expectations, return risk increases.
Retailers can often prevent these returns more effectively by improving product information than by changing the return policy.
For example, apparel merchants can show measurements, fit notes, model dimensions, fabric stretch, and customer feedback. Furniture sellers can provide room-scale imagery and precise dimensions. Electronics sellers can explain compatibility and system requirements more clearly.
4.2 Bracketing Changes the Meaning of Ecommerce Return Rates
Bracketing occurs when customers deliberately order several sizes, colors, or versions of a product with plans to keep only one or a few.
This behavior can make gross demand look stronger than retained demand.
A fashion product may generate impressive sales volume at checkout while producing a much smaller number of kept units after returns. If purchasing teams forecast from gross orders alone, they may repeatedly overbuy the same product.
That makes net retained sales a valuable companion to traditional sales velocity.
4.3 Fulfillment Errors Create Highly Preventable Returns
Wrong item, wrong size, wrong quantity, incomplete order, damaged packaging, and incorrect picking represent operational failures rather than customer preference.
Retailers should separate those issues from fit, buyer remorse, or bracketing.
Clean return-reason data allows managers to distinguish warehouse errors from merchandising issues, supplier quality problems, carrier damage, and customer behavior.
Without that separation, teams may spend money solving the wrong problem.
4.4 Delivery Timing Can Create Returns Even When the Product Is Correct
Late delivery can turn a perfectly acceptable product into an unwanted item.
Holiday gifts, event merchandise, travel products, seasonal goods, and time-sensitive purchases face especially high risk.
Retailers should therefore include delivery performance when they analyze ecommerce returns statistics, particularly around peak seasons.
5. Ecommerce Return Policies Now Influence Conversion Before Checkout
5.1 Free Returns Remain Important to Online Shoppers
NRF found that 82% of consumers consider free returns important when shopping online.
That preference creates a difficult economic tradeoff. Retailers absorb freight, warehouse labor, inspection costs, fraud exposure, and resale risk while customers increasingly expect convenience.
Many merchants now respond with selective policies rather than offering free returns for every product and every customer.
Loop’s 2026 data found that 65.2% of merchants charge a fee on at least some return outcomes, while 73.6% offer exchanges.
That combination suggests a clear strategy: protect margin on refund-heavy behavior while creating alternatives that help retain revenue.
5.2 Return Fees Can Reduce Ecommerce Purchase Intent
ICSC found that 67% of online shoppers become less likely to purchase when retailers charge return fees.
Transparency changes the reaction. The same study found that 71% of shoppers would accept fees more readily when retailers disclose them clearly before purchase.
FedEx reached a similar conclusion. Fifty-nine percent of consumers said they would consider avoiding a retailer that charges a return fee.
Retailers should therefore test policy changes against conversion, repeat purchase behavior, return rate, and contribution margin rather than evaluating return fees in isolation.
5.3 Return Windows Need to Match Product Economics
Loop’s 2026 benchmark found an average refund-request window of 39 days and an average exchange window of 41 days.
No universal return window works for every business.
Seasonal goods lose value quickly. Fashion collections move fast. Furniture may require more customer decision time. High-risk products may need tighter controls.
The right window balances shopper confidence with resale value, fraud exposure, and operational cost.
5.4 No-Box and No-Label Returns Continue to Grow
FedEx reported that usage of no-box, no-label returns among returners increased from 31% to 41%.
DHL also found that more than six in ten returns now happen through out-of-home locations such as parcel shops and lockers.
These changes simplify the customer experience, but they do not eliminate operational complexity.
Retailers still need to know which item came back, why the customer returned it, where the product sits, whether employees inspected it, and when the system should make it available for sale again.
6. Ecommerce Returns Statistics Reveal the Hidden Cost of Returns
6.1 Reverse Shipping Represents Only One Cost
Return shipping attracts attention because retailers can see the carrier charge clearly.
Yet the true cost continues after the package reaches the warehouse.
Employees may need to receive the item, identify it, inspect it, clean it, repackage it, relabel it, move it into a storage location, update inventory, process financial adjustments, answer customer questions, and determine whether the business can resell the product.
A universal “average cost per return” therefore provides limited value without product and process context.
6.2 Returned Inventory Loses Value While It Waits
A returned product can only generate revenue again after the business confirms that it remains sellable.
If a warehouse leaves a product in an inspection queue for several days, the item may physically exist while ecommerce systems still show zero available inventory.
For fast-moving or seasonal products, that delay can reduce recovery value.
Operators should track return-to-stock time as closely as they track return rate.
6.3 Ecommerce Returns Statistics Should Connect to Gross Margin
Strong ecommerce returns statistics analysis goes beyond counting refunds.
Imagine a retailer sells a product for $120. The company already paid customer-acquisition, payment, pick-pack, and outbound shipping costs. The customer then returns the item, which creates reverse freight and warehouse handling costs.
After inspection, the retailer discovers that it can only resell the product for $90.
The financial impact extends well beyond the original $120 refund.
Return analysis should therefore connect return rate with margin, recovery value, processing cost, and resale speed.
7. Ecommerce Return Fraud Statistics Require Careful Interpretation
7.1 Ecommerce Returns Statistics Show Fraud Is Material but Not Universal
NRF estimates that 9% of all returns involve fraud in its latest annual research.
Retailers report several forms of abuse, including empty-box returns, false quantities, item switching, label manipulation, wardrobing, and policy exploitation.
Loop reports a different metric: its 2026 dataset flagged 11.4% of return value as high risk.
Those figures do not measure the same thing. A high-risk flag identifies a transaction that deserves additional scrutiny; it does not prove fraud.
Writers and operators should avoid combining risk scores with confirmed-fraud estimates.
7.2 Wardrobing and Serial Returns Need Different Responses
Wardrobing occurs when someone buys a product, uses it temporarily, and then attempts to return it as unused.
Serial returning looks different. A customer may legitimately place many orders and return a high percentage because of fit, sizing, or product uncertainty.
The appropriate controls differ.
Retailers should use customer history, product type, transaction value, return reason, and condition data rather than treating every high-return customer as dishonest.
7.3 Fraud Controls Should Protect Good Customers
Aggressive restrictions can reduce fraud but also create friction for legitimate buyers.
Because return policies influence both conversion and retention, retailers need precision.
Low-risk customers should experience a straightforward process. Suspicious transactions may justify additional verification, delayed refunds, inspection requirements, or other controls.
The objective should be smarter decision-making, not blanket resistance to returns.
8. Reverse Logistics Turns Ecommerce Returns Into a Warehouse Issue
8.1 Reverse Logistics Starts When the Customer Sends Inventory Back
Reverse logistics covers the physical and operational journey from the customer back into the supply chain.
The customer initiates the return, a carrier or drop-off network moves the product, and a warehouse or returns facility receives it. Staff then inspect the item and decide what happens next.
Possible outcomes include full-price restocking, refurbishment, open-box resale, supplier return, liquidation, recycling, donation, or write-off.
Each outcome changes inventory and financial records differently.
8.2 Warehouse Return Processing Determines Recovery Speed
Warehouse teams need to identify the SKU, quantity, condition, location, and disposition of each returned product.
For companies that struggle with return receiving, scanning, bin movements, and multi-location visibility, a dedicated warehouse system such as XoroWMS can help connect physical activity with accurate inventory records.
The key operational goal is straightforward: the system should reflect what warehouse staff actually know about the item.
A returned unit should not become available for sale before inspection, and a sellable unit should not remain unavailable for days after employees approve it.
8.3 Ecommerce Returns Statistics Should Include Inventory Accuracy
As return volume rises, inventory accuracy becomes increasingly important.
A product can sit in several states: customer-authorized return, in transit, received, awaiting inspection, damaged, quarantined, approved for restock, or available for sale.
Disconnected systems make those states difficult to manage.
When physical status and system status diverge, companies can oversell unavailable inventory or hide sellable products from customers.
That makes inventory accuracy an essential companion metric to ecommerce returns statistics.
9. Ecommerce Returns Data Should Influence Purchasing, Forecasting, and ERP
9.1 Net Retained Demand Provides a Better Forecasting Signal
Gross orders can overstate product demand.
Suppose one style sells 10,000 units but customers return 35%. Another sells 8,000 units with an 8% return rate.
The first product appears stronger at checkout, but the retained-sales picture tells a different story.
Purchasing teams should therefore consider returns when they calculate demand, replenishment, and future order quantities.
This approach helps prevent businesses from repeatedly buying products that generate strong initial sales but weak customer retention.
9.2 Shopify Returns Need to Connect With Backend Operations
Shopify can handle the storefront and customer transaction, but growing merchants often need additional operational control once they add multiple warehouses, wholesale, Amazon, complex purchasing, or integrated accounting.
Xorosoft’s Shopify App Store listing shows how its ERP integration connects Shopify with broader inventory and operational workflows.
The key issue is not whether a system can issue a refund. The business needs warehouse, inventory, purchasing, and accounting records to remain aligned after the refund.
9.3 Ecommerce Returns Statistics Become More Useful Inside an Integrated ERP
A growing retailer may track returns in one application, inventory in another, accounting elsewhere, and purchasing through spreadsheets.
That structure makes reconciliation harder.
An integrated platform such as XoroONE cloud ERP connects inventory, sales, purchasing, warehousing, accounting, ecommerce, forecasting, EDI, and manufacturing workflows.
The advantage does not come from simply adding another returns feature. It comes from giving different teams access to the same underlying operational record.
When managers can connect ecommerce returns statistics with inventory, purchasing, margin, and warehouse data, they can make better decisions about products and processes.
9.4 Accounting Must Match the Physical Return
The customer refund and warehouse receipt represent related but distinct events.
Finance may need to process the refund, tax impact, cost-of-goods adjustment, inventory valuation, damaged inventory, and eventual disposition.
Businesses that have outgrown basic accounting tools may consider platforms such as XoroERP when they need financial, procurement, inventory, warehouse, reporting, and manufacturing workflows to operate together.
The objective is consistent data. Inventory and accounting should eventually tell the same story about every return.
9.5 Industry-Specific Return Workflows Matter
Returns behave differently across industries.
Apparel companies care heavily about size, fit, exchanges, and rapid restocking. Furniture brands face bulky freight and damage costs. Food businesses may issue replacements or credits instead of accepting physical returns. Manufacturers may need inspection, rework, or component-level decisions.
Companies evaluating ERP should therefore judge software against their actual industry workflows. Xorosoft’s industry-specific ERP solutions cover a range of inventory-driven sectors where those requirements vary substantially.
10. When Ecommerce Returns Become an ERP Problem
10.1 Small Merchants Do Not Need ERP Simply Because They Process Returns
A business with one warehouse, a small catalog, straightforward purchasing, low order complexity, and basic accounting may operate effectively with Shopify, a dedicated returns app, accounting software, and a lightweight inventory system.
Return volume alone does not justify ERP.
Complexity provides the stronger signal.
10.2 Disconnected Returns Workflows Create Clear Warning Signs
ERP becomes more relevant when one return triggers manual work in several departments.
Inventory may fail to update after inspection. Finance may manually reconcile refunds. Buyers may forecast from gross sales without return adjustments. Warehouse teams may maintain separate spreadsheets. Shopify, Amazon, wholesale, and warehouse systems may show different available quantities.
These problems indicate a systems issue rather than a simple returns-policy issue.
10.3 Returns Software, WMS, and ERP Solve Different Problems
Specialized returns platforms typically excel at customer-facing workflows such as portals, return labels, exchanges, store credit, and routing.
Warehouse management systems focus on physical execution: receiving, scanning, locations, picking, packing, and inventory movement.
ERP connects those events to accounting, purchasing, inventory valuation, forecasting, manufacturing, and management reporting.
A growing business may use more than one category. The right architecture depends on operational complexity and the specific problems that need solving.
10.4 ERP Comparisons Should Focus on Workflow Fit
Businesses evaluating larger systems often consider NetSuite, Acumatica, Microsoft Dynamics 365 Business Central, Sage, Cin7, Brightpearl, Fishbowl, Xorosoft, and other platforms.
The useful question is not which vendor advertises the most features. Companies should compare how each platform manages inventory, warehouse execution, purchasing, accounting, ecommerce integrations, implementation, reporting, and total operational complexity.
Businesses weighing those options can use this Xorosoft vs. NetSuite comparison as one reference point when comparing cloud ERP approaches.
11. Ecommerce Returns Statistics Retailers Should Track Internally
11.1 Return Rate, Refund Rate, and Exchange Rate
The overall return rate provides basic context, but operators should also calculate refund and exchange rates.
A refund removes revenue from the transaction. An exchange may retain some or all of it.
Separating these outcomes helps companies understand whether their returns strategy protects revenue or simply processes refunds efficiently.
11.2 SKU Return Rate and Return Reasons
SKU-level return data often creates the clearest opportunities.
If one product generates unusually high returns, teams can investigate size, quality, packaging, photography, supplier consistency, or customer expectations.
Combining the rate with standardized reason codes makes the data much more useful.
11.3 Cost per Return and Return-to-Stock Time
Cost per return should include more than transportation.
Warehouse labor, customer service, repackaging, markdowns, processing, and disposal can all matter.
Return-to-stock time measures how long sellable inventory remains unavailable after it comes back.
Together, these metrics help operators connect ecommerce returns statistics with real working-capital and margin effects.
11.4 Recovery Rate, Fraud Rate, and Retained Revenue
Recovery rate measures how much returned inventory the company can resell.
Fraud rate tracks confirmed abuse rather than merely suspicious transactions.
Retained revenue measures how much original transaction value survives through exchanges or store credit.
These metrics create a more complete picture than return rate alone.
12. Ecommerce Returns Statistics FAQs
12.1 What Is the Average Ecommerce Return Rate in 2026?
The market does not yet have a finalized full-year NRF return rate for 2026. The latest annual benchmark estimates that consumers returned 19.3% of online sales in 2025. Retailers can use that figure as broad context while comparing their own performance with similar categories and selling channels.
12.2 What Percentage of Online Purchases Get Returned?
NRF’s latest annual research places online returns at 19.3% of sales. Individual retailers can operate well above or below that benchmark depending on category, price, fit, product quality, selling channel, geography, fulfillment accuracy, and return-policy design.
12.3 How Do You Calculate Ecommerce Return Rate?
Divide returned units by total units sold and multiply the result by 100. If customers return 1,500 units from 10,000 sold units, the return rate equals 15%. Retailers should also calculate the metric by SKU, category, channel, warehouse, and return reason.
12.4 What Is a Good Ecommerce Return Rate?
No universal rate works for every ecommerce company. Businesses should compare themselves with similar product categories and operating models. A good rate supports healthy customer satisfaction, conversion, margin, and inventory recovery rather than simply minimizing the number of returns.
12.5 Why Are Ecommerce Return Rates High?
Online shoppers cannot physically inspect, try, or test many products before buying. That uncertainty can create problems with size, fit, quality, color, dimensions, compatibility, and expectations. Easy return policies and bracketing behavior can also increase return volumes.
12.6 Which Ecommerce Categories Have the Highest Return Rates?
Apparel and footwear consistently face high return pressure. Radial and Two Boxes found that 56% of surveyed apparel and footwear businesses reported return rates of at least 30%. Fit, sizing, style, and bracketing contribute heavily to that pattern.
12.7 Why Do Customers Return Clothing Bought Online?
Sizing differences, fit, fabric expectations, color, quality, and bracketing drive many apparel returns. Better measurements, fit guidance, model information, customer reviews, and accurate imagery can reduce some preventable returns before customers place orders.
12.8 How Much Do Ecommerce Returns Cost Retailers?
No universal cost applies across industries. Return costs can include freight, receiving, inspection, customer service, repackaging, payment processing, markdowns, damaged inventory, and disposal. Large or high-value products can create far greater costs than small, inexpensive items.
12.9 What Is Ecommerce Return Fraud?
Return fraud involves intentionally abusing the return process for financial or product gain. Common forms include empty-box returns, item switching, false quantities, manipulated labels, wardrobing, and misuse of policy exceptions.
12.10 What Percentage of Returns Are Fraudulent?
NRF’s latest annual research estimates that 9% of returns involve fraud. Businesses should separate confirmed fraud from transactions that fraud tools merely flag as high risk because the two measurements represent different levels of certainty.
12.11 What Is Bracketing in Ecommerce?
Bracketing occurs when customers order several versions of an item, usually different sizes or colors, with plans to return most of them. The behavior can increase conversion while also increasing reverse-logistics costs and making gross demand appear stronger than retained demand.
12.12 What Is Wardrobing?
Wardrobing describes a form of return abuse where someone buys a product, uses it temporarily, and then attempts to return it as though it remained unused. Apparel provides a common example, but the behavior can also affect electronics, tools, and sporting goods.
12.13 Do Free Returns Increase Ecommerce Sales?
Free returns can reduce customer hesitation, but no universal percentage increase applies to every business. NRF found that 82% of consumers consider free returns important when shopping online, showing that return policy can influence purchase decisions.
12.14 Do Return Fees Reduce Ecommerce Conversion?
Return fees can influence purchase intent. ICSC found that 67% of online shoppers become less likely to purchase when retailers charge return fees. Clear disclosure helps reduce frustration, so companies should communicate fees before checkout rather than revealing them after purchase.
12.15 How Long Should an Ecommerce Return Window Be?
The appropriate window depends on product type, seasonality, resale value, fraud risk, and customer expectations. Loop’s 2026 benchmark found average windows of 39 days for refund requests and 41 days for exchanges among merchants in its dataset.
12.16 What Are No-Box, No-Label Returns?
No-box, no-label programs allow customers to bring products to eligible return locations without printing a shipping label or packaging the item traditionally. FedEx reported that usage reached 41% among surveyed consumers who make returns.
12.17 What Is a Returnless Refund?
A returnless refund gives the customer money back without requiring a physical return. Retailers sometimes use the approach when return shipping and processing would cost more than the product’s recoverable value.
12.18 Are Exchanges Better Than Refunds?
Exchanges can preserve revenue when the customer still wants another size, color, or product. They work best when inventory remains available and the replacement meets the customer’s needs. A refund removes revenue completely, while an exchange gives the retailer an opportunity to retain it.
12.19 What Is Reverse Logistics in Ecommerce?
Reverse logistics covers the movement and processing of products from customers back into the retailer or supply chain. It includes transportation, receiving, inspection, restocking, refurbishment, liquidation, recycling, and the related inventory and financial updates.
12.20 What Happens to Returned Ecommerce Inventory?
Retailers may restock returned products, refurbish them, sell them as open-box merchandise, return them to suppliers, liquidate them, recycle them, donate them, or write them off. Product condition and recovery economics determine the best outcome.
12.21 How Can Ecommerce Businesses Reduce Returns?
Companies can improve descriptions, product imagery, sizing guidance, quality control, packaging, and fulfillment accuracy. SKU-level return analysis also helps teams identify recurring problems. The goal should focus on reducing preventable returns rather than making legitimate returns difficult.
12.22 How Can Returns Data Improve Purchasing?
Purchasing teams can use net retained demand instead of relying only on gross sales. A product that sells quickly but comes back frequently may not deserve the same replenishment priority as a product with slightly lower sales and much stronger retention.
12.23 When Does an Ecommerce Company Need ERP for Returns?
ERP becomes more relevant when returns create cross-functional issues involving several warehouses, accounting, inventory valuation, purchasing, manufacturing, EDI, forecasting, or multiple sales channels. Smaller businesses with simple operations may not need ERP solely because they process returns.
12.24 What Ecommerce Returns KPIs Should Retailers Track?
Important metrics include overall return rate, SKU return rate, return reasons, refund rate, exchange rate, cost per return, return-to-stock time, inventory recovery rate, fraud rate, retained revenue, channel-level return rate, and warehouse-level return rate.
12.25 Why Are Ecommerce Returns Statistics Important for Growing Retailers?
Ecommerce returns statistics help businesses identify product problems, understand customer behavior, measure operational costs, improve forecasting, and protect margin. External benchmarks provide context, while internal SKU, warehouse, channel, and recovery data shows managers where they can take action.
13. Conclusion: Turn Ecommerce Returns Statistics Into Better 2026 Decisions
The latest ecommerce returns statistics show that retailers cannot treat returns as a simple post-purchase inconvenience.
The 19.3% online return benchmark provides useful context, but operators should pay greater attention to the data underneath it. SKU-level return rates, standardized reason codes, exchange rates, return-to-stock time, cost per return, fraud, recovery value, and retained demand reveal much more about operational performance.
Businesses should first separate preventable returns from normal customer preference. Next, they should identify the products and processes that create disproportionate cost. Warehouse teams then need to shorten the time between receiving a return and making sellable inventory available again. Purchasing teams should incorporate retained demand rather than gross orders alone, while finance should ensure refunds and inventory adjustments reconcile accurately.
For growing inventory-driven businesses, the final question becomes a systems question. Can teams see the same return, inventory, warehouse, purchasing, and accounting information without maintaining parallel spreadsheets or manually reconciling applications?
When the answer becomes no, returns may be exposing a wider operational problem.
Free ERP Readiness Assessment: Review where returns currently create manual work across inventory, warehousing, purchasing, ecommerce, and accounting.
Watch Demo: Evaluate how a connected ERP and warehouse environment handles the complete workflow from order through return, inspection, inventory adjustment, and financial reconciliation.
Book a Personalized Demo: Businesses ready to map their Shopify, Amazon, wholesale, inventory, warehouse, accounting, or manufacturing workflows can contact Xorosoft to review their requirements.
The strongest returns strategy for 2026 does not simply make products harder to send back. It uses ecommerce returns statistics to understand why customers return products, recover inventory value faster, protect margins, and make better purchasing and operational decisions.
Recent Posts
-
 ERP Landed Cost Module vs Spreadsheet Calculations for Importers
 -
 How to Build an Open-to-Buy Plan for an Omnichannel Brand
 -
 Cold Storage WMS for Food and Beverage Distribution
 -
 ERP Buying Statistics 2026: Evaluation, Implementation, and Adoption Risks
 -
 How a Distributor Reduced B2B Order Exceptions Without Restricting Sales