If you want your business to succeed in today’s market, understanding retail demand forecasting is essential.
1. Retail Demand Forecasting Starts Where Channels Diverge
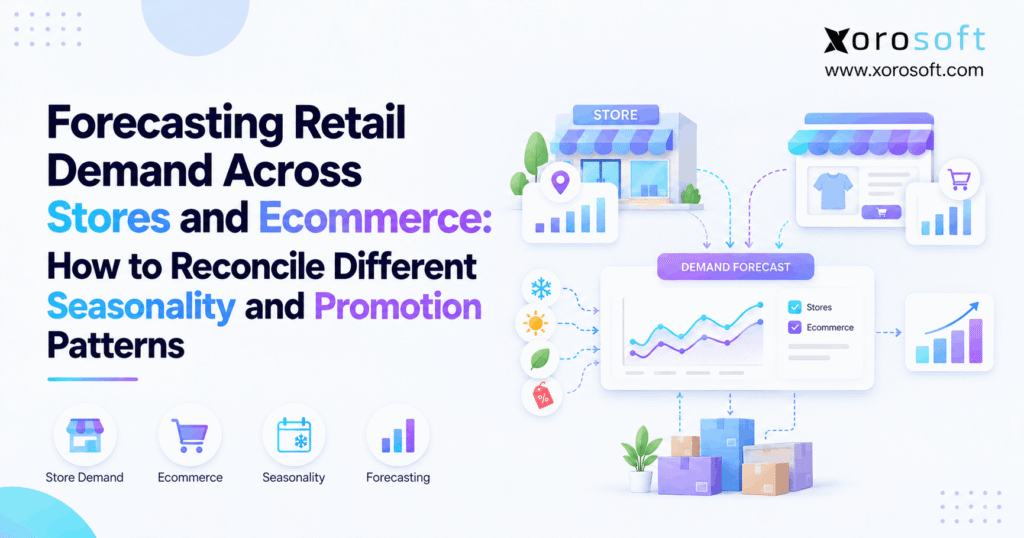
Retail demand forecasting becomes unreliable when retailers assume stores and ecommerce follow the same demand curve. Although both channels may sell identical products, customers often buy them at different times, in different regions, and under different promotional conditions. Therefore, retailers need to preserve those differences before creating one inventory plan.
A store may sell winter apparel early because its local temperature drops first. Meanwhile, ecommerce demand may build more gradually across several regions. Likewise, a digital promotion can create an immediate online spike while store sales remain close to normal.
Consequently, the objective is not to force every channel into one forecast. Instead, the business should forecast meaningful demand streams separately, reconcile them, and then convert the combined picture into purchasing and inventory decisions.
1.1 Store demand reflects local customer behavior
Physical stores operate inside specific markets. Therefore, local weather, events, demographics, opening hours, nearby competitors, and foot traffic can all change demand.
For example, two stores may sell the same jacket. However, one location may begin its seasonal peak three weeks earlier because colder weather arrives sooner.
As a result, a company-wide average can hide the timing that matters for replenishment. Store-level forecasts should preserve local patterns whenever enough historical data exists.
1.2 Ecommerce demand follows different patterns
Ecommerce serves a much broader geographic audience. Consequently, online demand often blends customers from several climates, regions, and shopping behaviors.
In addition, digital advertising can change traffic within hours. Email campaigns, paid search, social campaigns, marketplace events, and influencer activity can also create demand spikes that have no equivalent in stores.
Therefore, ecommerce demand forecasting should use online sales history without assuming that physical-store seasonality will transfer directly.
1.3 One blended forecast can create false confidence
A company can forecast total demand correctly while still putting inventory in the wrong places.
For example, suppose the business predicts 2,000 total units accurately. However, ecommerce needs 1,100 units while stores need only 900. If planners allocate 1,300 units to stores and 700 online, the total forecast still looks correct.
Nevertheless, customers experience stockouts online while stores carry excess inventory.
Therefore, teams should measure forecast quality at the same level where they make replenishment and allocation decisions.
2. What a Useful Forecast Must Separate
A useful forecast should explain more than expected sales. Instead, it should distinguish normal demand from temporary factors that can distort future planning.
Therefore, retailers should separate baseline demand, seasonality, promotions, and unusual events wherever the available data supports that level of analysis.
2.1 Baseline demand creates the starting point
Baseline demand represents the units customers would probably buy under relatively normal conditions.
For example, a SKU may usually sell 80 units per week. However, a promotion may increase sales to 180 units. Therefore, the next normal forecast should not automatically begin at 180 units.
Instead, planners should preserve the 80-unit baseline and measure the promotion separately. As a result, purchasing can respond to expected future demand rather than one temporary spike.
2.2 Seasonal demand needs its own pattern
Seasonality represents recurring demand changes connected with time.
For example, retailers may see recurring changes around:
- holidays
- weather seasons
- back-to-school periods
- sporting seasons
- weekends
- monthly buying cycles
- annual product events
However, the same seasonal pattern may not apply equally everywhere.
Therefore, planners should determine whether seasonality exists at company, channel, region, category, store, or SKU level.
2.3 Promotional demand needs separate treatment
Promotions can change both demand volume and timing. Therefore, retailers should not mix promotional and regular weeks without context.
For instance, a discount may create additional purchases. However, it may also move purchases forward from later weeks.
Consequently, a useful model should distinguish baseline demand, promotional lift, and post-promotion behavior. Otherwise, the forecast may overstate the demand that remains once the offer ends.
3. Why Store and Ecommerce Seasonality Diverge
Stores and ecommerce can share broad seasonal trends. However, the strength and timing of those trends may differ.
Therefore, planners should test channel patterns rather than assuming one seasonal index applies everywhere.
3.1 Geography changes seasonal demand forecasting
Physical stores primarily serve local customers. Consequently, climate and regional behavior strongly influence certain products.
For example, sporting goods, apparel, outdoor furniture, and seasonal food products may peak at different times across regions.
Meanwhile, ecommerce can combine demand from several regions into one online curve. Therefore, online seasonality may appear smoother even though local demand remains volatile.
3.2 Shopping calendars can differ by channel
Store traffic often changes around weekends, holidays, pay periods, and local events.
Ecommerce may behave differently. For example, email campaigns may generate strong Tuesday demand, while stores remain weekend-heavy.
Likewise, Cyber Monday affects online shopping differently from a local store event.
Therefore, retailers should compare day-of-week and week-of-year patterns independently before they combine channel forecasts.
3.3 Product categories create different patterns
Not every category needs the same seasonal logic.
Apparel depends heavily on style, weather, size, color, and markdown timing. Meanwhile, furniture often has longer buying cycles and supplier lead times.
Similarly, sporting goods can depend on regional seasons. Food and beverage forecasting also needs to consider shelf life.
Therefore, retailers should segment forecasting methods by product behavior rather than applying one model to every SKU.
4. Clean Retail Demand Forecasting Data Before Modeling
Retail demand forecasting depends on clean demand history. However, sales transactions alone rarely provide a complete picture.
Before modeling demand, teams should identify periods when inventory, returns, transfers, or fulfillment rules distorted recorded sales.
4.1 Stockouts can make strong demand look weak
Suppose a store sells its last available unit on Saturday morning. After that, sales fall to zero.
However, customer demand may continue throughout the weekend.
Therefore, zero sales do not necessarily mean zero demand. Instead, planners should compare sales with inventory availability.
As a result, stockout periods can be flagged, adjusted, or treated separately instead of teaching the forecast that demand disappeared.
4.2 Returns should not erase original demand
Returns create another problem, especially in ecommerce.
For example, a customer may order one jacket and return it two weeks later. The original transaction still represented demand. Therefore, simply forecasting from net sales can hide the customer’s initial buying decision.
Instead, teams should distinguish:
- original orders
- cancellations
- returns
- exchanges
- replacement shipments
Consequently, the forecast reflects customer demand more accurately.
4.3 Inventory transfers are not customer demand
A transfer moves stock between locations. However, it does not represent a customer purchase.
Therefore, moving 150 units from a warehouse to a store should not add 150 units to demand history.
A connected system such as XoroONE can help businesses keep inventory movements, sales transactions, purchasing activity, and location balances inside a common operational model.
As a result, planners spend less time separating operational movements manually before forecasting.
4.4 Omnichannel fulfillment needs clear attribution
Omnichannel retail complicates demand attribution further.
For example, an ecommerce order may ship from a store. Likewise, a customer may order online and collect the item at a retail location.
Therefore, businesses should distinguish three concepts:
- demand channel
- inventory location
- fulfillment location
Without those definitions, online growth can appear as unexplained store inventory consumption.
5. Separate Baseline Demand from Promotion Effects
Promotions create some of the largest forecasting errors because they can temporarily change both volume and timing.
Therefore, retailers should isolate promotional effects instead of allowing exceptional weeks to redefine normal demand.
5.1 Promotion demand forecasting starts with a baseline
Assume a product normally sells 100 units each week. During a promotion, sales rise to 220 units.
The extra 120 units may look like pure promotional lift. However, another event may also have influenced sales.
Therefore, teams should consider:
- discount depth
- campaign spend
- holiday timing
- inventory availability
- marketplace exposure
- competitor activity
- weather
As a result, the business can estimate a more realistic promotional effect.
5.2 Post-promotion demand also matters
Customers sometimes buy earlier because of a discount. Consequently, sales may fall below normal after the promotion ends.
For example, someone who buys three units during a promotion may not buy again the following week.
Therefore, retailers should examine three periods:
1. Before the promotion
2. During the promotion
3. After the promotion
This approach prevents the temporary spike from creating an inflated future baseline.
5.3 Promotions can shift demand between products
A promotion can also cannibalize another SKU.
For example, discounting Product A may increase its sales while reducing demand for Product B.
Therefore, planners should compare both SKU-level and category-level results.
If the category sells the same total volume, the promotion may have shifted product mix rather than created entirely new demand.
5.4 Ecommerce promotions may behave differently
The same offer can produce different results online and in stores.
For example, ecommerce customers may see paid advertising, email, and social content before they see the discount. Meanwhile, store customers may discover the offer only after entering the location.
Therefore, promotional elasticity should remain channel-specific until data shows that both channels behave similarly.
6. Choose the Right Forecasting Grain
More forecasting detail does not automatically create more accuracy.
Instead, retailers need enough detail to support decisions without creating thousands of unreliable low-volume forecasts.
6.1 SKU forecasting supports product decisions
SKU-level forecasts help teams understand which products may sell.
However, company-wide SKU demand still does not answer where inventory should sit.
Therefore, retailers with multiple locations often need another layer of detail.
6.2 SKU-location demand forecasting adds allocation detail
SKU-location forecasting estimates demand for a specific product at a specific location.
Consequently, it can support:
- store replenishment
- warehouse replenishment
- local safety stock
- inventory transfers
- channel allocation
However, low-volume SKU-location combinations can become noisy. Therefore, businesses should not force granular forecasting where little meaningful history exists.
6.3 Channel demand forecasting preserves behavior
Channel-level forecasts separate stores, ecommerce, marketplaces, wholesale, and other demand streams.
Therefore, teams can preserve different promotion response, seasonality, order size, and customer behavior.
Later, planners can combine those forecasts when they calculate total purchasing requirements.
6.4 Higher-level forecasting can stabilize sparse data
Sometimes, category or regional data reveals a pattern more clearly than an individual SKU.
For example, one color of a seasonal jacket may sell irregularly. However, the full jacket family may show a clear seasonal curve.
Therefore, planners can use broader patterns to guide smaller data sets while still maintaining operational detail.
7. Reconcile Retail Demand Forecasting Across Channels
After forecasting separate demand streams, retailers still need one coherent plan.
Therefore, forecast reconciliation connects detailed estimates with higher-level totals without erasing meaningful differences.
7.1 Bottom-up reconciliation protects detail
A bottom-up process starts with detailed forecasts.
For example:
SKU + Location → Region → Channel → Company
The business forecasts each lower-level combination and then adds them together.
Therefore, bottom-up forecasting provides strong operational detail. However, it can become unstable when many low-volume combinations contain limited history.
7.2 Top-down reconciliation creates stability
A top-down model begins with an aggregate forecast.
For example:
Company → Channel → Region → Location → SKU
The business then distributes the total downward using historical shares or another allocation method.
Consequently, the high-level forecast may remain stable. However, local changes can disappear when historical allocation rules no longer reflect current demand.
7.3 Middle-out forecasting balances both approaches
Middle-out forecasting starts at a level where the data remains reasonably stable.
For example, a retailer might forecast category-region demand first. Then, it can aggregate upward and distribute downward.
Therefore, middle-out planning can work well when total-company forecasts are too broad and SKU-location forecasts are too noisy.
7.4 Reconciliation should preserve operating decisions
The purpose of reconciliation is not mathematical neatness alone.
Instead, the forecast must support real decisions.
For example, purchasing may need one total requirement, while warehouse teams need location-level demand. Therefore, the business should maintain both views rather than collapsing everything into one number.
8. Turn Forecasts into Inventory Decisions
A demand forecast predicts expected demand. However, it does not tell the business exactly how much inventory to buy.
Therefore, retailers must combine expected demand with inventory position, supply timing, and service goals.
8.1 Retail inventory forecasting needs availability data
Planners should compare forecast demand with:
- on-hand inventory
- available inventory
- committed inventory
- open purchase orders
- inbound transfers
- safety stock
- supplier lead times
Consequently, replenishment reflects what the company already owns or expects to receive.
8.2 Safety stock should reflect uncertainty
A fixed safety-stock percentage may look simple. However, different products have different risks.
For example, a stable replenishment item may require less protection than a volatile promotional SKU.
Therefore, teams should consider forecast error, lead-time variability, and target service levels.
8.3 Allocation follows total purchasing
Suppose the company needs 5,000 units overall. It still needs to decide how those units should move across warehouses, stores, and ecommerce.
A real-time warehouse management system can support that execution layer by keeping inventory location and warehouse movements visible.
Therefore, better forecasts can turn into better allocation rather than remaining inside planning spreadsheets.
8.4 Shared inventory requires clear rules
Shared inventory improves flexibility. However, it also creates channel competition.
For example, ecommerce and wholesale may both rely on the same warehouse stock.
Therefore, businesses need clear rules for reservations, priorities, available-to-sell inventory, and transfers. Otherwise, one channel can consume inventory that another forecast already expected to use.
9. Connect Retail Demand Planning with Purchasing
Retail demand planning creates value when it changes purchasing decisions.
Therefore, planners should connect expected demand with open supply, supplier constraints, and order timing.
9.1 Open purchase orders change the requirement
Suppose the forecast expects 1,500 units of demand. However, 900 units are already inbound.
Therefore, buyers should not automatically order another 1,500 units.
Instead, they should calculate the remaining requirement after current inventory and confirmed inbound supply.
This simple step prevents forecasts from creating duplicate purchasing.
9.2 Lead time changes when purchasing must act
A supplier with a seven-day lead time allows the business to respond relatively quickly.
However, a 12-week supplier requires decisions much earlier.
Therefore, forecasting horizons should align with supplier lead times.
An integrated XoroERP environment can connect purchasing, inventory, accounting, and operational data so teams evaluate requirements against current transactions instead of separate exports.
9.3 Minimum quantities can change the plan
Suppliers may impose minimum order quantities, case packs, or container requirements.
Consequently, the recommended purchase quantity may differ from forecast demand.
For example, a forecast may suggest 760 units while the supplier sells only in 200-unit cases.
Therefore, buyers still need planning rules that translate forecast demand into executable orders.
9.4 Promotions should not trigger permanent overbuying
A successful promotion can make historical demand look stronger than normal.
However, future purchasing should include that lift only when a similar campaign will run again.
Therefore, buyers should distinguish recurring promotion plans from isolated events.
Otherwise, one successful campaign can create months of excess stock.
10. Measure Retail Demand Forecasting Accuracy
Retail demand forecasting should improve through repeated measurement.
Therefore, teams need metrics that explain both forecast error and operational impact.
10.1 Forecast error measures the gap
Forecast error compares expected demand with actual demand.
For example, a forecast of 120 units against actual demand of 140 creates a 20-unit error.
However, one error does not show whether forecasts consistently run high or low.
Therefore, teams need additional measures.
10.2 Forecast bias shows direction
Forecast bias identifies systematic overforecasting or underforecasting.
For example, repeated overforecasting can create excess inventory. Conversely, repeated underforecasting can contribute to stockouts.
Therefore, bias should appear alongside absolute error.
10.3 WMAPE helps compare larger portfolios
Weighted Mean Absolute Percentage Error, or WMAPE, compares total absolute error with total actual demand.
Because higher-volume items contribute more weight, the metric can help teams evaluate broad portfolios.
However, no single metric explains everything.
Therefore, businesses should pair forecasting metrics with operating outcomes.
10.4 Operational metrics reveal business impact
Teams should also monitor:
| Metric | What it helps reveal |
|---|---|
| Stockout rate | Whether demand exceeds available supply |
| Fill rate | Whether inventory supports customer orders |
| Excess inventory | Whether plans consistently run too high |
| Aged stock | Whether inventory remains unsold too long |
| Emergency transfers | Whether allocation misses local demand |
| Expedited purchases | Whether planners react too late |
Therefore, forecast accuracy matters most when it improves these outcomes.
11. Common Forecasting Errors That Distort Results
Even sophisticated tools can produce poor results when the business feeds them misleading data.
Therefore, teams should fix process and data problems before blaming the forecasting method.
11.1 Revenue is not the same as unit demand
Revenue combines price and quantity.
For example, a 15% price increase can raise revenue even when unit demand falls.
Therefore, inventory planning should usually forecast units first. Financial teams can then translate those units into revenue using expected prices.
11.2 Stockouts can look like falling demand
When inventory reaches zero, sales usually fall too.
However, customers may still want the product.
Therefore, teams should flag periods when availability constrained sales.
Otherwise, the next forecast may recommend even less inventory and repeat the same stockout.
11.3 Early channel aggregation hides differences
Combining store and ecommerce sales can create a clean-looking trend.
However, that trend may hide major differences in timing and geography.
Therefore, businesses should analyze channels separately first and aggregate later.
11.4 Manual overrides need an audit trail
Experienced planners often know about events the model cannot see.
Therefore, manual overrides can add value.
However, every override should record:
- original forecast
- revised forecast
- reason
- planner
- actual result
Consequently, the team can learn whether human adjustments consistently improve accuracy.
12. When Retail Demand Forecasting Outgrows Spreadsheets
Retail demand forecasting does not require complex software at every stage.
A small business with one location, limited SKUs, and stable demand may forecast successfully in spreadsheets.
However, spreadsheets become harder to control as operating complexity grows.
12.1 Watch for operational warning signs
The process may have outgrown spreadsheets when teams manage:
- several stores
- multiple warehouses
- thousands of SKU-location combinations
- Shopify plus marketplaces
- wholesale orders
- frequent promotions
- long supplier lead times
- regular inventory transfers
- repeated manual imports
Consequently, planners spend more time preparing data than analyzing demand.
12.2 Connected ERP can solve the data problem first
Advanced forecasting depends on reliable operational data.
Therefore, businesses should fix disconnected inventory, purchasing, warehouse, order, and accounting records before expecting sophisticated models to solve every problem.
For inventory-driven businesses, Xorosoft brings these workflows together through its cloud ERP platform.
As a result, teams can work from connected operational transactions instead of rebuilding the same data set before every planning cycle.
12.3 Integrations matter in omnichannel forecasting
Retailers rarely operate one system.
For example, the stack may include Shopify, marketplaces, EDI, shipping systems, warehouse tools, and financial applications.
Therefore, data movement becomes part of forecast quality.
Xorosoft’s integration ecosystem helps connect sales and operating systems so inventory and order information can move into the broader ERP workflow.
Consequently, planners can reduce manual channel reconciliation.
12.4 Choose software based on the actual constraint
Not every company needs the same solution.
For example, a retailer with highly advanced statistical modeling requirements may need a specialized planning platform. However, another company may mainly need inventory, purchasing, warehouse, accounting, and channel data in one system.
Therefore, software evaluation should begin with the bottleneck rather than a long feature checklist.
13. Industry Examples for Omnichannel Demand Forecasting
Different industries expose different forecasting problems.
Therefore, businesses should adapt the same core framework to product lifecycle, lead time, channel mix, and inventory risk.
Xorosoft supports inventory-driven sectors across its industries portfolio, including apparel, wholesale, furniture, sporting goods, consumer products, food, and manufacturing.
13.1 Apparel stores plus Shopify
Consider an apparel retailer with eight stores and Shopify.
A jacket launches in September. Northern stores sell quickly, while warmer locations remain slow. Meanwhile, ecommerce attracts customers across both climates.
Therefore, the retailer should preserve store-region demand while maintaining a separate ecommerce forecast.
For Shopify-driven operations, Xorosoft is also listed on the Shopify App Store, which gives merchants an external reference point for its Shopify ERP integration.
13.2 Furniture requires longer planning horizons
Furniture retailers often work with long supplier lead times and larger inventory investments.
Therefore, they may forecast categories or collections for long-range purchasing while retaining SKU-level demand for final allocation.
Moreover, store display inventory can affect recorded sales differently from ecommerce assortment.
Consequently, planners should avoid interpreting every low-volume store SKU as weak underlying demand.
13.3 Sporting goods need regional seasonality
Sporting-goods demand often follows weather and local activity.
For example, snow products may peak earlier in one region while remaining nearly flat elsewhere.
Therefore, national averages can mislead replenishment.
Instead, regional seasonality should guide allocation while a broader forecast supports total purchasing.
13.4 Wholesale plus ecommerce creates two demand rhythms
A distributor may receive large scheduled B2B orders while ecommerce produces smaller daily transactions.
Therefore, the business should preserve both patterns.
Otherwise, large wholesale orders can distort ecommerce baselines, while online growth can create noise in account-level wholesale forecasts.
14. A Practical Forecast-to-Inventory Workflow
Retailers do not need to rebuild the forecasting process from scratch each month.
Instead, they can use a repeatable workflow that connects demand signals with purchasing and inventory execution.
14.1 Collect and clean demand data
First, collect sales by SKU, channel, location, and date.
Next, add inventory availability, returns, prices, promotions, transfers, and supplier data.
Then, identify stockouts, missing transactions, assortment changes, and unusual events.
As a result, the model starts with a cleaner view of demand.
14.2 Segment meaningful demand streams
Next, separate groups that behave differently.
For example, distinguish stores from ecommerce, promoted products from regular demand, and mature items from launches.
However, avoid creating segments with too little history.
Therefore, choose the lowest level that still produces meaningful patterns.
14.3 Forecast and reconcile
Then, create baseline forecasts at the appropriate level.
Afterward, add known seasonal, promotional, and event effects.
Next, reconcile granular forecasts with channel and company totals.
Consequently, purchasing receives a coherent requirement while stores and warehouses retain useful allocation detail.
14.4 Convert the forecast into execution
A forecast should eventually trigger a decision.
Therefore, compare demand with inventory, safety stock, open purchase orders, transfers, lead times, and supplier constraints.
Xorosoft’s broader operational solutions can connect those planning inputs with inventory-driven workflows.
As a result, teams can move from forecast review into purchasing and inventory action without rebuilding the data manually.
14.5 Measure and improve every cycle
Finally, compare forecast and actual demand.
Then, examine bias, error, stockouts, excess inventory, transfers, and planner overrides.
Moreover, separate promotional periods from normal demand when measuring performance.
Consequently, each cycle provides evidence for improving the next forecast.
15. Build One Planning Process Without Forcing One Demand Pattern
Stores and ecommerce ultimately share one business objective: having the right inventory available when customers want it.
However, that does not mean every channel should follow one demand curve.
Instead, retailers should preserve meaningful differences in seasonality, promotions, geography, fulfillment, and customer behavior. Then, they can reconcile those forecasts into purchasing, inventory, allocation, and financial plans.
Therefore, the strongest forecasting process is not the one with the most complex model. It is the one that connects reliable demand signals with actual operating decisions.
For inventory-driven businesses, Xorosoft can connect forecasting with inventory, purchasing, warehouse management, accounting, Shopify, and multi-channel order operations.
If disconnected systems are making demand planning harder than it should be, Book a Demo to see how those workflows can operate from one connected ERP environment.
Frequently Asked Questions
What is retail demand forecasting?
Retail demand forecasting estimates future unit demand by product, channel, location, and period. It combines sales history with seasonality, promotions, inventory availability, pricing, and other signals that influence customer demand.
Should stores and ecommerce use the same demand forecast?
Usually, no. Stores and ecommerce can have different geography, seasonality, promotion response, assortment, and fulfillment patterns. Therefore, businesses should forecast meaningful channel differences first and reconcile them later.
How do promotions affect retail demand forecasting?
Promotions can increase sales, shift purchases forward, cannibalize other products, and create post-promotion dips. Therefore, retailers should separate temporary promotional lift from normal baseline demand.
How do stockouts affect demand forecasts?
Stockouts can make demand look artificially low because customers cannot buy unavailable inventory. Consequently, retailers should identify constrained periods before using historical sales as true demand.
What data improves retail demand forecasting?
Useful inputs include unit sales, inventory availability, promotions, pricing, returns, channel, location, purchase orders, supplier lead times, transfers, fulfillment activity, and relevant seasonal events.
How often should retail forecasts be updated?
Update frequency should match operating speed. Fast-moving ecommerce businesses may review forecasts weekly or more often, while slower categories can use longer cycles with event-based adjustments.
When should retailers move beyond spreadsheets?
Retailers should consider connected planning systems when multiple channels, warehouses, promotions, suppliers, and SKU-location combinations create heavy manual reconciliation or make inventory and purchasing decisions difficult to control.
Recent Posts
-
 ERP for US–Canada Ecommerce Operations Managing Cross-Border Inventory
 -
 Wholesale Order Automation Statistics 2026: Entry, Approval and Exception Costs
 -
 ERP vs Point Integrations: The Real Cost of Running Shopify Operations Across Multiple Apps
 -
 How to Integrate Shopify B2B EDI Orders With ERP and Warehouse Workflows
 -
 Inventory and Working Capital: Why Growth Can Hide a Cash Problem