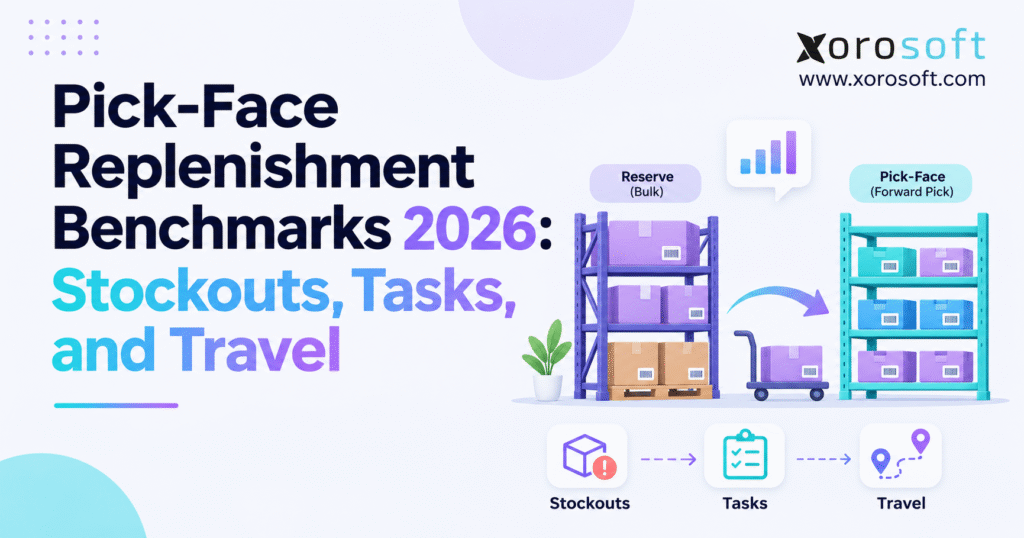
When evaluating warehouse efficiency, it’s important to pick face replenishment benchmarks that best suit your operation.
1. Pick-Face Replenishment Problems: Why Empty Bins Delay Fulfillment
An order picker reaches a forward bin, scans the location, and finds too little stock to complete the line. The inventory screen still shows several pallets in reserve. The business owns the product, but the warehouse cannot put it into the customer’s order when it is needed. That disconnect is one of the most expensive forms of avoidable replenishment failure: it turns available inventory into picking delays, unplanned travel, and extra handling.
For distribution centers managing hundreds or thousands of SKUs, the problem is rarely a single empty shelf. It may reflect late refill triggers, work released in the wrong sequence, unconfirmed transfers, inadequate pick-face capacity, or a reserve location too far from the demand it serves. Adding safety stock at the supplier level will not necessarily fix any of those problems. More inventory can simply sit in another part of the building.
1.1 Why Pick Face Replenishment Benchmarks Matter in 2026
Warehouse operators are under pressure to protect service while controlling labor and space. Pick face replenishment benchmarks help identify whether forward locations remain available, how much internal movement supports each unit of demand, and how far workers travel to keep picking active. Used together, these measurements show where a process is failing; used alone, they can reward the wrong behavior.
A team can complete more refill tasks per hour and still make fulfillment worse if it allows critical locations to run empty. Similarly, reducing task count may lower labor cost while creating overfilled bins or missed shipping cutoffs. The objective is reliable stock at the point of picking, not simply fast stock movement.
1.2 How Warehouse Replenishment Benchmarks Guide Decisions
A useful replenishment scorecard supports three decisions: which SKUs need earlier or larger refills, which routes or work practices consume unnecessary labor, and whether existing systems can reliably coordinate inventory and warehouse tasks. The best targets depend on SKU velocity, order patterns, handling equipment, and available storage. A common framework matters more than a universal number.
2. Pick Face Replenishment Benchmarks: Definitions Before Targets
Pick-face replenishment moves usable inventory from a reserve position to an active picking location. Reserve storage may be a high rack, bulk pallet bay, or separate zone. The pick face may be a shelf, carton-flow lane, tote, or floor-level case-pick position. The move does not increase total inventory; it changes where available stock can be accessed for an order.
A pick-face stockout occurs when the assigned location cannot support an eligible pick. By contrast, a true inventory shortage occurs when the operation lacks enough usable and uncommitted inventory overall. An assigned location can be empty while another contains stock, but that reserve inventory may be held for quality, allocated elsewhere, or restricted by lot. Therefore, teams must validate stock status rather than assuming all recorded on-hand units are interchangeable.
2.1 Where Pick-Face Replenishment KPIs Matter Most
Separate reserve and forward-pick areas create the clearest need. This includes ecommerce facilities with frequent piece picks, wholesale distributors using case-pick faces, manufacturers supplying components to production, and multi-site businesses where managers need consistent reporting. A small storeroom that picks safely from bulk locations might not need a dedicated replenishment program. Its priority may be inventory accuracy and direct-pick efficiency instead.
For larger operations, pick face replenishment benchmarks become especially useful when managers see repeated short picks, growing urgent-task queues, or unexplained differences between facilities. The right scope is a defined warehouse, shift, handling type, and observation period—not every building forced into one headline average.
2.2 Replenishment vs. Purchasing and Inventory Allocation
Internal replenishment is not supplier reordering. A purchase order increases incoming supply after vendor lead time, whereas a reserve-to-pick transfer makes already owned units accessible. Customer allocation is different again: it determines which order is entitled to stock. Mixing these concepts can generate unnecessary purchases while failing to fix the actual picking interruption.
3. Warehouse Replenishment Benchmarks 2026: What Research Supports
The 2026 DC Measures report from WERC covers 36 warehouse and distribution-center metrics. Its public overview also reports that 48.6% of respondents identified cost reduction as their primary organizational goal. These findings confirm that warehouse performance measurement remains economically important. However, the public overview does not provide an industry-wide target for pick-face stockout rate, replenishment tasks per labor hour, or replenishment meters traveled per task.
3.1 Why Universal Replenishment Targets Mislead
A full-pallet warehouse may complete fewer transfers per hour than a facility moving small cartons, even when both operate efficiently. A high-rack building with long aisles will not resemble a compact, ground-level piece-pick operation. In addition, one WMS may count every case movement as a separate task while another counts a multi-case route as one task. Comparing those raw totals would measure recording conventions as much as productivity.
For credible pick face replenishment benchmarks, establish comparable groups by task type, SKU class, equipment, shift, and order profile. Separate observed external research from locally calculated baselines. Where no authoritative public benchmark exists, label goals as internal improvement targets rather than quoting an invented industry median.
3.2 Building Credible Pick-Face Replenishment Baselines
Use at least several representative operating periods, including both normal and peak days. Record workload volume alongside every KPI so growth does not disguise inefficiency. Reconcile task logs against physical confirmation and explain excluded events, especially canceled orders, incomplete moves, and stock held on quality status. If a metric cannot be calculated reliably, mark it unavailable until the data improves.
A supervisor should also check whether the recorded observation period contains abnormal events, such as a network outage, a major relocation, or a short period with unusually few picks. These events do not always justify deleting the data. Instead, annotate them and compare both the full result and a like-for-like operating window. This makes the benchmark useful for future decisions rather than merely flattering the most recent shift.
4. Seven Pick-Face Replenishment KPIs for Stockouts, Tasks, and Travel
A useful scorecard combines service measures with labor and movement measures. The following seven operational focus areas are especially practical for warehouse replenishment performance reviews. Some contain companion indicators because a standalone rate cannot explain its own causes.
| KPI focus | Core calculation | What it reveals |
|---|---|---|
| 1. Stockout-affected pick rate | Blocked eligible pick attempts / eligible pick attempts × 100 | How often forward stock blocks picking |
| 2. Pick-ready availability | Pick-ready eligible minutes / scheduled eligible minutes × 100 | How long locations remain usable |
| 3. Replenishment labor productivity | Completed tasks / direct replenishment labor hours | Task throughput for comparable work |
| 4. Replenishment task intensity | Completed tasks / completed pick lines × 1,000 | Refill workload relative to demand |
| 5. Refill responsiveness | On-time tasks / tasks due × 100; also measure trigger-to-ready time | Whether stock arrives before it is needed |
| 6. Emergency replenishment burden | Urgent tasks / all created tasks × 100 | How much work is reactive |
| 7. Replenishment travel efficiency | Measured replenishment meters / completed tasks | Distance required per completed move |
4.1 Define Replenishment KPI Denominators Before Comparison
For stockouts, decide whether the denominator counts first attempts or all retries. Labor productivity also requires a decision about whether hours include waiting, travel, and confirmation. On-time reporting must include tasks still open when their deadline passes. Without written rules, a dashboard can improve because the counting method changed, not because workers did anything differently.
4.2 Use a Balanced Warehouse Replenishment Scorecard
The strongest warehouse replenishment benchmarks show stockout exposure, task workload, speed, and physical movement together. Fewer refills are good only when order service remains stable; faster task completion is valuable only when confirmation is accurate. Managers should publish definitions beside the scorecard and revisit them when workflows or technology change.
An effective review meeting also asks which variable the team can control. Stockout frequency may point to trigger design; high refill cycle time may point to a delayed work queue; high travel per move may reveal poor source placement. Assigning one owner to each corrective action helps prevent a general productivity conversation from becoming a collection of untestable opinions.
5. Pick-Face Stockout Benchmarks: Frequency, Duration, and Availability
5.1 Calculate the Pick-Face Stockout Rate
Stockout-affected pick rate = blocked eligible pick attempts ÷ total eligible pick attempts × 100. Suppose 50 first eligible attempts cannot be completed at their assigned faces during a period with 10,000 first eligible attempts. The rate is 50 ÷ 10,000 × 100, or 0.50%. If a later comparable period records 20 blocked attempts out of 10,000, its rate is 0.20%.
That improvement equals 0.30 percentage points, or a 60% relative reduction. Both descriptions are accurate but mean different things. Use the percentage-point change when comparing rates, and the relative change when describing the scale of improvement. Count repeat visits to the same order line consistently so a single empty location does not inflate the figure through repeated scans.
5.2 Measure Time-Based Pick-Face Availability
A location that remains usable for 470 out of 480 scheduled eligible minutes has 470 ÷ 480 × 100 = 97.92% availability. That is a time-based measure, not an order-fill rate. Ten minutes of unavailability during a busy shipping wave may disrupt more orders than an hour of downtime when no one needs the SKU. Track affected demand and cutoff times alongside the duration.
Stockout duration begins when the forward location cannot meet relevant demand and ends when usable replenished stock is confirmed ready. Define whether the clock stops at physical placement or at the system confirmation that releases stock for picking. For most operational decisions, confirmed pick-ready status is safer.
5.3 Identify Reserve-to-Pick Replenishment Failures
If reserve stock exists, check whether it is usable, allocated, on hold, or already assigned to another task. Then inspect the trigger, assignment delay, travel route, handling time, and confirmation. When available stock repeatedly sits in reserve while pickers wait, the likely remedy is an internal execution change—not necessarily a larger purchase order.
A connected inventory record can make this diagnosis easier. Xorosoft’s XoroONE platform combines inventory, purchasing, warehouse operations, and reporting, which provides useful context for separating internal location shortages from broader supply decisions. Any claimed improvement still needs to be measured in the specific warehouse.
6. Replenishment Task Benchmarks: Labor Productivity and Refill Timing
6.1 Calculate Replenishment Tasks per Direct Labor Hour
Tasks per labor hour = completed replenishment tasks ÷ direct replenishment labor hours. A team finishing 240 tasks in 40 hours averages 6.00 tasks per labor hour. If it later completes 200 tasks in 32 hours, the rate becomes 6.25, a 4.17% productivity improvement. This tells managers something useful only when handling types and task definitions are comparable.
For example, moving one pallet with a reach truck cannot be compared directly with topping off a small bin by hand. Segment by quantity, equipment, vertical lift, source distance, and whether a task needs lot or serial checks. Otherwise, workers assigned more demanding tasks may appear less productive simply because their work is more complex.
6.2 Normalize Replenishment Workload Against Picking Activity
Tasks per 1,000 completed pick lines = completed replenishment tasks ÷ completed pick lines × 1,000. At 240 tasks for 10,000 completed lines, the result is 24 tasks per 1,000 lines. At 200 tasks for the same 10,000 lines, it falls to 20, a 16.67% reduction in task intensity. This may reflect better refill quantities or fewer unnecessary moves.
It could also indicate deferred work. Pair task intensity with stockout rate, remaining forward stock, and open backlog. A lower task count is not beneficial if the next shift inherits empty bins. Record canceled or merged tasks separately, and be clear whether one task represents a single SKU transfer or an entire multi-stop route.
6.3 Measure Replenishment Cycle Time and Task Deadlines
A refill triggered at 8:00, assigned at 8:10, started at 8:20, and confirmed ready at 8:42 has a 42-minute trigger-to-ready time. If the need-by deadline is 8:35, the refill is seven minutes late even though the worker took only 22 minutes from starting to confirmation.
Track median and 90th-percentile cycle times, as well as on-time rate = tasks completed by need-by time ÷ tasks due × 100. Long waits often reveal task-priority or staffing problems rather than slow handling. Xorosoft documents labor tracking and warehouse reporting in XoroWMS; regardless of platform, the quality of task timestamps determines the usefulness of this analysis.
7. Replenishment Travel Benchmarks: Distance, Congestion, and True Labor Cost
7.1 Calculate Replenishment Travel Distance per Task
Travel meters per task = total measured replenishment travel meters ÷ completed tasks. A warehouse recording 9,600 meters across 240 completed moves averages 40 meters per task. After a layout pilot, 7,000 meters across 200 tasks equals 35 meters per task. That is a 12.5% improvement per task; total travel drops by 27.08%.
Those figures are meaningful only if measurement rules remain consistent. Document whether paths include travel from an assigned start point, the journey to reserve, the movement to the pick face, and any return or staging distance. An apparently shorter route can simply reflect excluding empty travel from the new measurement.
7.2 Estimate Warehouse Replenishment Travel Without GPS
Most facilities cannot rely on GPS signals between racks. Instead, map accessible aisles and cross-aisles, estimate standard routes between source and destination locations, and validate samples with direct observation. Avoid using straight-line distances through racks. For vehicles, distinguish travel time from lifting, lowering, and waiting, because a long lift may distort a distance-only analysis.
Travel measurement also has to account for shared routes. A worker may replenish two bins on one trip. Allocate the route consistently across tasks or report meters per route separately. Comparing tasks without an agreed allocation rule can make otherwise valuable pick face replenishment benchmarks unreliable.
7.3 Reduce Replenishment Travel Without Creating Congestion
Slot fast movers near compatible reserve stock where practical, but do not force every high-velocity SKU into one congested aisle. Review pedestrian interaction, forklift routes, access restrictions, and picking traffic. A 20-meter shortcut is worthless if it creates a queue or unsafe crossing. Zone-based reporting is often more useful than one building-wide travel average.
The cost connection is straightforward: time spent walking or driving is labor capacity unavailable for other work. At a hypothetical fully loaded labor rate of $28 per hour, 40 direct replenishment hours cost $1,120. Thirty-two hours cost $896. The difference is $224 per comparable period, before any equipment or disruption effects.
8. Pick-Face Replenishment Thresholds: Set Min/Max Levels Around Demand
8.1 Calculate Pick-Face Replenishment Minimums
A starting rule is minimum trigger quantity = expected demand during full refill lead time + operating buffer. Suppose a SKU sells through the pick face at 20 units per hour and a completed refill takes 1.5 hours from trigger to confirmed readiness. Expected consumption is 20 × 1.5 = 30 units. Add a justified 12-unit buffer, and the initial trigger becomes 42 units.
The buffer should reflect demand variation, refill delays, and service importance—not a guess copied across every SKU. Use an observed high-percentile lead time for critical items where practical, because averages hide the very delays that cause stockouts. Recalculate after process changes; a faster, reliable refill operation can sometimes maintain availability with less forward stock.
For especially volatile items, examine demand in short intervals rather than relying on a daily average. A SKU that sells 160 units across an eight-hour shift may not consume 20 units in every hour. If 60 units are picked during a promotion window, the same 42-unit trigger may be inadequate. This is why replenishment settings need peak-period testing before a high-volume launch.
8.2 Set Replenishment Maximums to Match Bin Capacity
Minimum tells the system when to request a refill. Maximum defines the safe working quantity after replenishment. Consider a location with room for 72 units, supplied in cases of 24. At 24 units on hand, two full cases refill it to 72. At 40 units, one full case brings it to 64, while two would exceed capacity. The chosen rule must respect space, pack size, and safe handling.
Avoid treating the nominal bin volume as completely usable when cartons require clearance or weight limits apply. Where the inventory must follow lot or expiry rotation, the remaining quantity is not interchangeable across all receipts. A poorly designed maximum can create overflow movements that erase the labor savings from fewer refill tasks.
8.3 Adapt Pick-Face Refill Rules by SKU Velocity
Fast-moving SKUs may justify larger working locations or pre-wave top-offs. Medium movers may perform well with ordinary min/max triggers. Slow movers may be better picked directly from reserve, especially when they consume valuable forward capacity. Review units per pick, picks per day, item cube, seasonal demand, and handling requirements together instead of using annual sales ranking alone.
9. Pick-Face Replenishment Methods: Min/Max vs. Wave-Based vs. Demand-Driven
9.1 Min/Max Replenishment for Predictable Demand
Min/max replenishment works well when demand and task lead times are reasonably stable. It creates repeatable work and straightforward audit trails. Its weakness emerges when the next order wave changes expected consumption faster than a fixed threshold anticipates. Scheduled top-offs can reduce that risk before predictable daily peaks, but they may also create work for stock that is not needed.
9.2 Wave-Based and Demand-Driven Replenishment
Wave-based replenishment evaluates stock required for a defined batch of orders before release. Demand-driven approaches use projected needs, existing pick-face stock, and deadlines to identify which moves should happen first. In peer-reviewed research on prioritizing replenishments of the piece-picking area, de Vries and colleagues studied policies intended to reduce stockouts when picking and replenishment occur concurrently. That research supports smarter task sequencing, not a universal percentage improvement for every warehouse.
When interpreting pick face replenishment benchmarks, a hybrid model often works best: min/max handles routine demand, scheduled checks prepare for known peaks, and priority rules address confirmed exceptions. Reserve-only picking can remain appropriate for bulky or rarely requested items. The goal is to match handling effort to actual fulfillment requirements, not to automate every SKU into the same process.
9.3 Compare Warehouse Replenishment Approaches, Not Vendor Claims
| Replenishment approach | Strongest fit | Common failure mode |
|---|---|---|
| Min/max | Stable, repeatable demand | Trigger ignores an upcoming spike |
| Pre-wave top-off | Scheduled order releases | Refill starts too close to wave time |
| Demand-driven priority | Mixed, variable demand | Poor order or stock data distorts priority |
| Manual exception | Low-frequency, small operations | Urgent work interrupts planned picking |
| Direct reserve picking | Bulky or slow-moving stock | Long or unsafe picking routes |
10. Pick Face Replenishment Benchmarks: Worked KPI Scorecard
10.1 Define a Comparable Replenishment Baseline
Consider a hypothetical wholesaler testing revised minimums, pre-wave prioritization, and better reserve-location grouping. Each period includes 10,000 first eligible pick attempts and 10,000 eventually completed pick lines. That relationship is possible because blocked first attempts may be fulfilled after later recovery; repeated retries are not counted as additional first attempts. Real comparisons would also need to normalize SKU mix, case quantities, and shift conditions.
| Measurement | Baseline | Pilot |
|---|---|---|
| Eligible first pick attempts | 10,000 | 10,000 |
| First attempts blocked by stockout | 50 | 20 |
| Completed pick lines | 10,000 | 10,000 |
| Replenishment tasks completed | 240 | 200 |
| Direct replenishment labor hours | 40 | 32 |
| Measured replenishment travel | 9,600 m | 7,000 m |
| Emergency tasks among completed tasks | 60 | 20 |
| Tasks due in period | 240 | 200 |
| Tasks completed by need-by time | 180 | 188 |
10.2 Calculate Stockout, Task, and Travel Benchmarks
Stockout rate declines from 0.50% to 0.20%, a 60% relative decrease. Tasks per labor hour increase from 6.00 to 6.25, a 4.17% improvement. Tasks per 1,000 completed lines drop from 24 to 20. The urgent share moves from 25% to 10%, a 15-percentage-point reduction. On-time task completion rises from 75% to 94%, an improvement of 19 percentage points.
Travel per completed task falls from 40 to 35 meters, while total direct labor hours fall by 20%. At the illustrative $28 loaded hourly rate, replenishment labor cost per 1,000 completed lines falls from $112 to $89.60. These are calculations from the hypothetical dataset, not 2026 industry averages or predicted software results.
10.3 What Pick Face Replenishment Benchmarks Cannot Prove
Pick-ready time availability cannot be calculated from the table because location-time records were not collected. Likewise, the scorecard does not prove that trigger changes alone caused the results. Different operators, order complexity, product dimensions, or shift congestion might have contributed. Repeat the pilot across matched periods and review labor, safety, picking delays, and residual inventory before scaling.
A better experiment records the rules changed, the dates they became active, and any concurrent staffing or slotting changes. Keep failed tasks visible rather than removing them from the dataset. This creates an auditable improvement record and gives managers confidence that the next adjustment will target a measured cause, not a convenient explanation.
In this case, the most credible interpretation is that the pilot warrants additional testing: fewer blocked picks occurred alongside less travel and fewer urgent tasks. No KPI should be presented as an externally verified pick face replenishment benchmark simply because the arithmetic is precise.
11. Warehouse Replenishment KPIs by Industry and Order Channel
11.1 Pick-Face Replenishment in Apparel and Sporting Goods
Apparel warehouses manage styles, colors, and sizes whose velocities change quickly. A promotion might empty one size while neighboring variants remain untouched. Segment availability by variant and shift, not just product family. Sporting-goods facilities may combine small accessories with bulky equipment; those replenishment tasks need separate labor comparisons because handling requirements differ materially.
Furniture operations face different constraints again. Large packages, damage risk, and equipment needs may make direct reserve picking preferable to maintaining a forward face for every item. Food and beverage warehouses require usable-stock definitions that respect lot status, expiry, rotation, and temperature controls. A physically full bin can still be unavailable for the order being picked.
11.2 Replenishment Demand Across Shopify, Amazon, and EDI Orders
Wholesale orders may release in large scheduled batches, while direct-to-consumer orders arrive continuously. Amazon demand and Shopify campaigns can create peaks that conflict with wholesale cutoffs. For these mixed operations, check whether future order demand is visible early enough to create refill work before picks are released. An accurate store-level available quantity is not the same as a stocked forward bin.
Xorosoft documents connections for ecommerce, wholesale, and EDI workflows on its integrations page. Its external Shopify App Store listing also describes integrated orders, inventory, warehousing, purchasing, and finance. These connections are relevant when evaluating demand visibility, but each business still needs to establish how its own replenishment priorities are calculated and executed.
11.3 Compare Warehouse Replenishment by Handling Type
The same 35 meters per task can be excellent in a sprawling pallet warehouse and poor in a compact pick module. Compare case handling with case handling, chilled storage with similar temperature zones, and peak shifts with similar peak shifts. Xorosoft’s industry overview covers several inventory-intensive sectors; the operational lesson is that warehouse KPIs must reflect the products and fulfillment methods involved rather than imposing a one-size-fits-all target.
12. The Financial Case for Better Pick-Face Replenishment
12.1 Calculate the Full Cost of Replenishment Exceptions
A missed refill can generate additional picker travel, supervisor intervention, rescheduling, and possible carrier-cutoff failures. Some costs are easy to identify, such as direct replenishment hours. Others require a deliberate study: how many order lines were recovered, whether shipments left late, and how much rework occurred. Avoid assigning a fixed cost to every empty-bin event without evidence.
When finance teams use pick face replenishment benchmarks, they should start with direct labor cost per 1,000 pick lines and measured exception-handling hours. If a warehouse saves eight direct refill hours in a comparable period at $28 per hour, the visible labor saving is $224. The organization should not treat that amount as a cash saving unless labor hours, overtime, or staffing requirements actually change. Otherwise, it may be released capacity available for other work.
12.2 Balance Replenishment Labor Against Inventory Carrying Costs
Larger forward bins can reduce replenishment frequency but consume scarce prime picking space. Extra reserve inventory can improve supplier coverage while increasing carrying costs, obsolescence risk, and working capital. Evaluate whether planned changes shift costs elsewhere rather than simply reducing the number of recorded transfers.
A strong investment case therefore combines stockout-affected attempts, task intensity, direct labor, travel, pick-location occupancy, and order service. Where finance and warehouse systems are disconnected, teams may need manual reconciliation before they can trust the result. Xorosoft’s XoroERP product overview describes the relationship between inventory, purchasing, warehouse execution, and accounting in a connected ERP environment; the relevant business outcome still requires facility-specific measurement.
13. When to Upgrade Warehouse Replenishment Processes or WMS
13.1 Improve Replenishment Rules Before Changing Software
A small facility may manage replenishment with documented minimums, clear location labels, routine checks, and a simple task log. If the rules are unclear, introducing more technology will reproduce the confusion faster. First confirm that each SKU has an assigned forward face, usable capacity, a safe source, a refill trigger, and a responsible owner.
However, repeated stockouts despite available reserve, unexplained stock discrepancies, missed priorities, and inconsistent multi-site reports suggest that manual methods may no longer be enough. At that point, a WMS evaluation should use real exceptions rather than a generic demonstration checklist.
13.2 Test Replenishment Workflows With Real Exceptions
Ask the prospective system to show a threshold crossing, a proposed source, a task assignment, source and destination verification, and stock becoming available to pick. Then introduce a held lot, an inaccessible reserve position, a partially completed transfer, a changed wave deadline, and a damaged carton. Check the resulting audit trail and the available fields for KPI calculation.
Xorosoft describes receiving, warehouse replenishment, barcode workflows, inventory control, and labor reporting across its connected warehouse solutions. Product descriptions establish areas to examine, not guaranteed support for every configuration. Document the exact acceptance test before choosing a platform.
13.3 Make Replenishment Data Quality a Selection Criterion
A modern system cannot produce reliable pick face replenishment benchmarks from unreliable timestamps, missing locations, or inconsistent task status codes. Require clear definitions for created, started, confirmed, overdue, canceled, and partially completed work. Ensure stock status and order demand are visible at the level needed for picking decisions, not just in a nightly summary.
14. Turn Pick Face Replenishment Benchmarks Into a 30-Day Improvement Plan
14.1 Week 1: Measure a Representative Replenishment Baseline
Start with two or three high-activity zones and the SKUs responsible for the most blocked picks. Capture eligible attempts, confirmed replenishments, need-by times, labor hours, and route estimates. Validate a sample against observations on the floor. Give managers an agreed definition for each metric and mark missing data openly rather than filling it with assumptions.
14.2 Weeks 2 and 3: Pilot Replenishment Improvements
If trigger timing is the issue, adjust minimums using observed demand and complete refill lead time. When task priority is the issue, rank work by risk of an upcoming stockout. Where excessive distance drives labor, test reserve relocation or route grouping where safety permits. Change a manageable number of factors and preserve a comparable control period or zone where possible.
14.3 Week 4: Validate Replenishment Results and Next Steps
Review stockout rate, availability, task intensity, on-time completion, urgent work, and travel together. Check for unintended effects on picking efficiency, bin occupancy, accuracy, and shipping performance. Repeat the trial if workload or staffing changed too much to support a fair comparison. Assign owners to successful changes and establish a monthly review rather than treating the pilot as a one-off exercise.
The practical outcome is not an impressive dashboard; it is a warehouse that can explain why a pick face emptied, how quickly it was restored, and what the recovery cost. Pick face replenishment benchmarks are valuable when they turn that evidence into safer, more reliable fulfillment without unnecessary inventory or handling. If your team needs to evaluate how warehouse execution, inventory, and ERP data connect, contact Xorosoft with your actual stockout, task, and travel examples for a more useful operational discussion.
Frequently Asked Questions
What is pick-face replenishment?
Pick-face replenishment moves usable inventory from reserve storage to active picking locations. It makes existing stock accessible for orders without increasing total warehouse inventory.
What is a good pick-face stockout rate?
No universal 2026 rate is verified. Divide blocked eligible pick attempts by all eligible attempts, then benchmark similar SKUs, zones, and shifts.
How do you calculate replenishment tasks per hour?
Divide completed replenishment tasks by direct replenishment labor hours. Completing 200 tasks in 32 hours equals 6.25 tasks per labor hour.
How is replenishment travel distance measured?
Divide measured replenishment travel distance by completed tasks. Use accessible routes, consistent return-trip rules, and comparable warehouse zones and equipment.
How can warehouses prevent empty pick faces?
Set refill thresholds using demand during lead time, verify usable reserve stock, prioritize urgent moves, and confirm transfers. Track blocked picks after changes.
Which pick-face replenishment method is best?
Min/max suits steady demand; wave-based and demand-driven methods address changing orders. Many warehouses combine approaches according to SKU velocity and shipping deadlines.
When should a warehouse upgrade to a WMS?
Consider upgrading when reserve stock repeatedly fails to reach pick faces, priorities remain unclear, or location records disagree. Test actual exception workflows before selecting software.
Recent Posts
-
 Pick-Face Replenishment Benchmarks 2026: Stockouts, Tasks, and Travel
-
 How to Plan Material Requirements With Supplier and Capacity Constraints
-
 ERP for Electrical Distributors Managing Reels, Lots, and Project Orders
-
 Accepted vs Rejected vs Canceled Inventory Receipts in Shopify
-
 ERP for Nutraceutical Manufacturers Managing Formulas, Lots, and Expiry