If you’re looking for the latest manufacturing backlog statistics, this is the right place.
1. Manufacturing Backlog Statistics 2026: When Strong Orders Mask Delivery Risk
A manufacturer can have a full order book and still struggle to deliver products on time. Customer orders may be increasing, but material shortages, production bottlenecks, and unreliable inventory records can prevent those orders from becoming completed shipments.
That challenge makes manufacturing backlog statistics particularly important in 2026.
According to the U.S. Census Bureau, unfilled manufacturing orders reached approximately $1.61 trillion in August 2026. Meanwhile, the Institute for Supply Management reported further expansion in manufacturing order backlogs during September.
Although these figures indicate substantial outstanding demand, they do not automatically suggest that manufacturers are becoming more productive.
1.1. Why Growing Manufacturing Backlogs Require Closer Attention
An expanding manufacturing backlog can indicate stronger customer demand and improved future revenue visibility. For manufacturers producing customized equipment or complex industrial components, outstanding orders help support purchasing plans and workforce scheduling.
However, the same growth can reveal weaknesses in production execution.
For example, a manufacturer may receive more customer orders while waiting several weeks for a critical component. As a result, the company records additional demand without increasing completed production.
Consequently, backlog growth must be evaluated alongside material availability, production capacity, and customer delivery commitments.
1.2. The Three Operational Signals Behind Manufacturing Backlogs
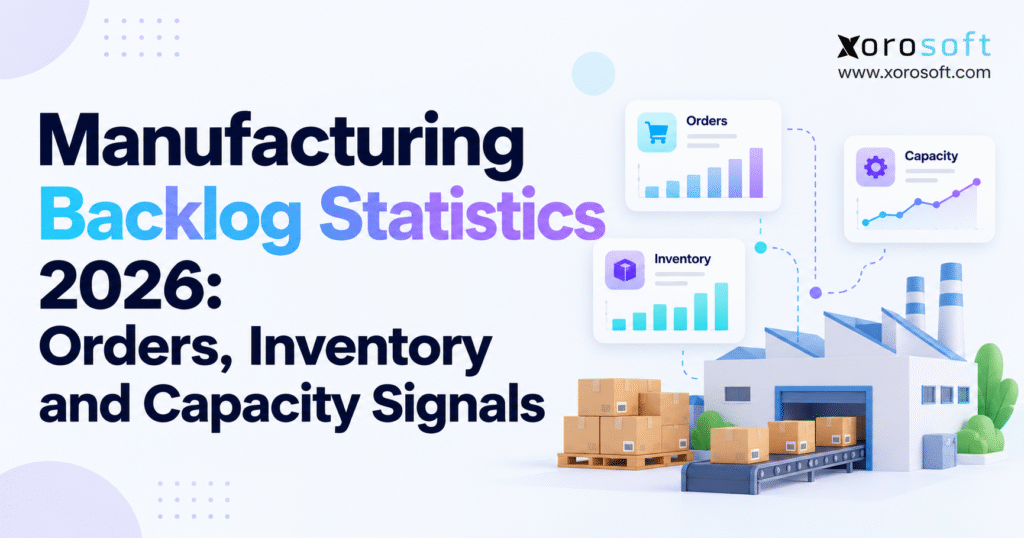
Manufacturing performance depends on the relationship between incoming orders, available inventory, and productive capacity.
First, customer orders determine what the business must deliver. Inventory availability establishes whether production can begin. Finally, manufacturing capacity determines how quickly materials can move through the required operations.
When these functions operate independently, planning problems become more difficult to detect.
Sales teams may promise dates using outdated stock information. Purchasing teams may replenish components without understanding production priorities. Meanwhile, factory managers may release work orders before confirming material availability.
Therefore, strong demand alone cannot establish whether a manufacturer’s order backlog is healthy.
1.3. Why National Backlog Trends Matter to Individual Manufacturers
National manufacturing backlog statistics help business leaders understand broader demand and production conditions.
However, factory-level decisions require more detailed measurements.
Managers should compare economic trends with their own overdue orders, inventory shortages, work-center loading, and delivery performance. This approach separates external market conditions from internal execution problems.
More importantly, it reveals whether a growing order book represents profitable opportunity or increasing operational risk.
2. U.S. Manufacturing Backlog Statistics: Latest Verified 2026 Figures
The latest available U.S. manufacturing backlog statistics show continued growth in unfilled orders, alongside changes in manufacturing shipments, inventory levels, and capacity utilization.
The U.S. Census Bureau’s manufacturing report, published October 2, 2026, provides the principal monthly figures for August.
2.1. U.S. Unfilled Manufacturing Orders Reach $1.61 Trillion
Unfilled manufacturing orders increased by $9.9 billion in August 2026, reaching $1,609.6 billion.
This represented a monthly increase of 0.6%, following another 0.6% increase in July.
Additionally, the Census Bureau reported that unfilled orders had increased in 25 of the preceding 26 months.
The extended increase suggests that outstanding manufacturing commitments continued accumulating across the order-reporting industries.
Nevertheless, this figure represents nominal dollar values. Therefore, changes in product prices, contract values, and industry composition may influence the total.
It does not directly measure the number of physical units awaiting production.
2.2. Key Manufacturing Backlog Statistics for 2026
| Manufacturing indicator | Latest value | Reporting period |
|---|---|---|
| Unfilled manufacturing orders | $1,609.6 billion | August 2026 |
| Monthly change in unfilled orders | +0.6% | August 2026 |
| Manufacturing new orders | $663.5 billion | August 2026 |
| Manufacturing shipments | $658.6 billion | August 2026 |
| Manufacturing inventories | $972.4 billion | August 2026 |
| Unfilled orders-to-shipments ratio | 6.87 | August 2026 |
| Inventory-to-shipments ratio | 1.48 | August 2026 |
| ISM Backlog of Orders Index | 56.4 | September 2026 |
| ISM New Orders Index | 55.3 | September 2026 |
| ISM Inventories Index | 48.6 | September 2026 |
| Manufacturing capacity utilization | 75.7% | August 2026 |
Sources: U.S. Census Bureau, Institute for Supply Management, and Federal Reserve. Figures represent different reporting periods and measurement methods.
These manufacturing backlog statistics provide an economic baseline rather than an operational benchmark that applies equally to every manufacturer.
2.3. Understanding the Different Reporting Methods
The Census Bureau measures manufacturing orders, shipments, and inventories primarily in dollar values.
In comparison, ISM measures changes in business conditions through survey-based diffusion indexes.
The Federal Reserve uses another methodology to estimate manufacturing output and capacity utilization.
Although each source provides useful information, the figures answer different questions.
For example, increasing unfilled orders show that outstanding order value has grown. An ISM backlog reading above 50 indicates expansion among surveyed manufacturers. Meanwhile, capacity utilization measures the relationship between output and estimated sustainable production capacity.
Combining these indicators provides a broader picture of manufacturing conditions.
3. How Manufacturing Backlogs Are Defined and Calculated
Manufacturing backlog represents accepted customer orders that remain outstanding under the applicable reporting rules.
However, backlog should not be confused with overdue backorders or work-in-process inventory.
Understanding these distinctions improves reporting accuracy and prevents unnecessary operational decisions.
3.1. Manufacturing Backlog vs. Backorders and Work-in-Process
Backlog includes accepted orders that have not yet passed through the relevant sales-recognition process.
Backorders generally refer to customer commitments that cannot be fulfilled when required.
Work-in-process represents materials and costs associated with products currently undergoing manufacturing.
| Measure | Definition | Management purpose |
|---|---|---|
| Order backlog | Accepted orders remaining outstanding | Future demand visibility |
| Backorders | Orders that cannot be fulfilled when required | Delivery exception management |
| Work-in-process | Goods undergoing production | Production flow monitoring |
| Finished goods | Completed products awaiting shipment or sale | Fulfillment availability |
For example, a custom machine scheduled for delivery in three months may remain in backlog without being overdue.
Conversely, a relatively small order delayed by missing inventory can create immediate customer service problems.
3.2. Manufacturing Backlog Calculation Formula
A simplified manufacturing backlog calculation follows this relationship:
Ending Backlog = Beginning Backlog + Net New Orders − Recognized Sales
The Census Bureau’s manufacturing definitions explain that new orders are measured net of cancellations and that qualifying sales reduce unfilled orders.
Consider the following hypothetical example:
| Monthly backlog activity | Value |
|---|---|
| Beginning backlog | $2,000,000 |
| Net new orders | +$750,000 |
| Recognized sales | −$550,000 |
| Ending backlog | $2,200,000 |
The backlog increased by $200,000.
However, that increase does not establish whether fulfillment performance improved or deteriorated. Management must also examine the age and status of outstanding commitments.
3.3. Why Backlog Aging Is More Useful Than Total Order Value
Two manufacturers may report identical backlog values but face very different operating conditions.
One business could have mostly future orders with realistic production schedules. The other might have a high proportion of overdue customer commitments.
Therefore, manufacturers should group outstanding orders by promised delivery date, material availability, production status, and customer priority.
This additional analysis helps distinguish healthy future demand from delayed fulfillment.
4. Manufacturing New Orders and Shipment Signals in 2026
New orders and shipments are important components of manufacturing backlog analysis.
New orders indicate incoming customer demand. Shipments, meanwhile, reflect goods sold or transferred under the applicable reporting methodology.
Although these measures are related, they should not be treated as interchangeable.
4.1. Manufacturing New Orders Increased in August 2026
U.S. manufacturing new orders reached $663.5 billion in August 2026, increasing 0.1% from July.
Meanwhile, manufacturing shipments totaled $658.6 billion and were virtually unchanged.
This combination shows that incoming order value continued increasing while shipment growth stabilized.
However, the headline new-order and shipment totals include different reporting characteristics across manufacturing industries.
Consequently, simply subtracting total shipments from total new orders does not reproduce the official monthly change in unfilled manufacturing orders.
A reliable analysis must account for the industries covered and the Census Bureau’s order-reporting methodology.
4.2. September ISM Manufacturing Backlog Signals
The September 2026 ISM Manufacturing PMI report showed a Backlog of Orders Index of 56.4, compared with 51.8 in August.
The New Orders Index reached 55.3, while the Production Index registered 56.7.
Although production remained in expansion territory, its index declined from 58.3 in August.
Importantly, an ISM reading of 56.4 does not mean order backlogs increased by 56.4%.
Instead, the index measures the direction and breadth of reported changes among surveyed manufacturing businesses.
4.3. Identifying Demand Growth Versus Execution Problems
When new orders rise alongside stable delivery performance, backlog growth may indicate healthy demand.
However, rising overdue orders and declining throughput suggest that production execution deserves closer attention.
For instance, an equipment manufacturer receiving additional orders may need more capacity. Alternatively, the factory may already have enough overall capacity but lack one specialized component.
Both situations can produce higher backlog totals, yet the appropriate corrective actions differ.
Therefore, manufacturers should examine demand trends alongside material shortages, production schedules, and customer delivery performance.
5. Manufacturing Backlog Statistics and Inventory Availability
Inventory availability directly influences whether outstanding customer orders can become completed products.
However, a growing inventory balance does not necessarily mean that the materials required by current production orders are available.
This distinction is essential when interpreting manufacturing backlog statistics.
5.1. Manufacturing Inventories Reached $972.4 Billion
According to the August Census report, U.S. manufacturing inventories increased to $972.4 billion.
That represented a 0.5% monthly increase.
Additionally, the inventory-to-shipments ratio rose from 1.47 to 1.48.
Meanwhile, ISM’s September Inventories Index declined to 48.6 from 50.6 in August.
These figures describe different reporting periods and measurement methods. Therefore, they should not be interpreted as conflicting estimates of the same quantity.
More importantly, aggregate inventory values cannot establish whether manufacturers have the precise components required by their open orders.
5.2. Why Excess Inventory Can Exist Alongside Material Shortages
Consider a furniture manufacturer holding substantial stocks of completed tables and packaging materials.
Despite those inventory balances, the business cannot complete outstanding chair orders because a specialized metal component has not arrived.
As a result, inventory value remains high while production readiness deteriorates.
Purchasing additional general stock would not solve the problem.
Instead, the manufacturer must identify the missing component, confirm supplier availability, and evaluate alternative production schedules.
This example demonstrates why material availability should be measured at the component level rather than through total inventory value alone.
5.3. Connecting Raw Materials, WIP and Finished Goods
Manufacturing inventory includes raw materials, work-in-process, and finished goods.
Each category plays a different role in fulfillment.
Raw materials support production. Work-in-process represents partially completed goods. Finished goods may support immediate shipment when inventory is eligible and unallocated.
However, physical availability is not always equivalent to usable availability.
Materials may be reserved for another customer, held for inspection, or stored at a different warehouse.
Therefore, accurate warehouse inventory management becomes increasingly important as manufacturers add locations, product variations, and complex production requirements.
6. Manufacturing Capacity Utilization and Production Bottlenecks
Manufacturing capacity determines how quickly available materials can move through the production process.
However, national capacity utilization statistics cannot identify the specific machines or operations limiting an individual factory.
That distinction is critical when backlog increases despite apparently available capacity.
6.1. Manufacturing Capacity Utilization Reached 75.7%
The Federal Reserve’s September 18, 2026 report estimated manufacturing capacity utilization at 75.7% in August.
This compared with 76.0% in July.
Additionally, manufacturing output decreased 0.3% during August.
These measurements describe aggregate manufacturing activity. They do not indicate that every manufacturer has approximately one-quarter of its practical production capacity available.
Instead, the distribution of capacity across machines, workers, and operations determines what an individual business can produce.
6.2. Why Unused Capacity Can Coexist With Manufacturing Backlogs
Consider a factory operating five production departments.
Four departments have available capacity, but one specialized machining operation is fully committed.
If every outstanding order requires that operation, additional capacity elsewhere will not immediately increase completed production.
Likewise, a manufacturer may have available machines but lack qualified operators or critical components.
Consequently, production planning should focus on constrained resources rather than total factory utilization alone.
This approach helps explain why manufacturers sometimes report rising order backlogs without operating every machine at maximum capacity.
6.3. Measuring Work-Center Capacity Gaps
Suppose a production work center has 40 available hours each week but 52 hours of scheduled work.
The simplified calculation is:
Work-Center Loading = Scheduled Hours ÷ Available Hours × 100
Therefore:
52 ÷ 40 × 100 = 130%
The workload exceeds available capacity by 12 hours.
Management may need to consider overtime, subcontracting, alternative routing, or revised delivery commitments.
However, releasing additional work into that same constrained resource would simply increase the production queue.
7. Manufacturing Backlog Statistics by Industry and Production Model
Manufacturing backlog statistics vary significantly across industries because products require different materials, production cycles, and customer commitments.
Consequently, a backlog level that appears reasonable for one manufacturer may represent substantial risk for another.
7.1. Durable Goods and Nondurable Goods
The Census Bureau’s unfilled-order series primarily reflects manufacturing industries where outstanding order data are collected, particularly durable goods.
Therefore, the national total does not represent every outstanding order across all U.S. manufacturing activities.
Durable-goods manufacturers frequently manage longer production cycles, specialized components, and significant contractual commitments.
In contrast, manufacturers producing frequently replenished consumer products may operate with shorter lead times and greater reliance on finished-goods inventory.
As a result, appropriate backlog coverage varies by business model.
7.2. Transportation Equipment, Machinery and Fabricated Metals
Transportation equipment and machinery manufacturers often depend on complex bills of materials and specialized production resources.
Similarly, fabricated metal manufacturers may face constraints related to raw material specifications, machine availability, and processing requirements.
ISM’s September survey identified transportation equipment, machinery, and fabricated metal products among industries reporting expanding order backlogs.
However, an industry reporting backlog growth is not necessarily the industry with the largest dollar-value backlog.
For operational planning, customer commitments and production feasibility matter more than industry ranking alone.
7.3. Canadian Manufacturing Backlog Trends
Canadian manufacturers face similar inventory and capacity challenges.
Statistics Canada’s July 2026 manufacturing report recorded CAD $134.6 billion in unfilled orders and CAD $127.5 billion in inventories.
The inventory-to-sales ratio stood at 1.62.
Nevertheless, Canadian and U.S. figures use different currencies and statistical frameworks.
Therefore, businesses operating in both countries should maintain consistent internal backlog definitions instead of combining national statistics without methodological adjustments.
8. Healthy Manufacturing Backlogs vs. Operational Warning Signs
A healthy manufacturing backlog supports future revenue visibility without undermining delivery commitments.
However, the total value of outstanding orders cannot establish whether the backlog is healthy.
Managers need to examine timing, profitability, material readiness, and production constraints.
8.1. What a Healthy Manufacturing Backlog Looks Like
A healthy backlog consists of accepted customer commitments supported by realistic production schedules and dependable material plans.
Orders have clear delivery dates, confirmed requirements, and responsible operational owners.
Additionally, purchasing teams understand which components must arrive before production begins.
The appropriate backlog level depends on product complexity and manufacturing strategy.
For example, a custom equipment manufacturer may reasonably carry several months of scheduled orders. In contrast, a make-to-stock consumer products manufacturer may rely more heavily on finished inventory to meet immediate demand.
8.2. Warning Signs That Backlog Growth Is Becoming a Problem
Manufacturing backlog statistics become more concerning when overdue orders increase faster than new demand.
Other warning signs include frequent production rescheduling, repeated supplier expedites, rising work-in-process inventory, and declining on-time delivery.
Moreover, growing inventories alongside persistent material shortages may reveal purchasing or allocation problems.
A stable backlog total can also conceal deterioration when customers cancel orders or delivery commitments are repeatedly revised.
Therefore, backlog aging and delivery reliability should be reviewed alongside total order value.
8.3. Interpreting Conflicting Manufacturing Signals
| Signal | Possible meaning | Recommended investigation |
|---|---|---|
| Orders rising, deliveries stable | Healthy demand growth | Capacity commitments |
| Backlog rising, throughput falling | Production constraints | Bottleneck performance |
| Inventory rising, shortages continuing | Inventory mismatch | Component-level availability |
| Backlog stable, late orders increasing | Delivery performance deterioration | Order aging |
| Orders falling, inventory increasing | Demand imbalance | Forecast and purchasing accuracy |
| Capacity available, orders delayed | Localized resource constraint | Work-center loading |
Although these patterns are useful, none provides a definitive diagnosis without company-level information.
9. Manufacturing Backlog Statistics and Essential Factory KPIs
National manufacturing backlog statistics help explain economic conditions. However, businesses need internal KPIs to determine whether outstanding orders can be fulfilled profitably and on time.
An effective manufacturing dashboard should connect customer commitments with inventory, purchasing, production capacity, and shipment performance.
9.1. The Most Important Manufacturing Backlog KPIs
| KPI | Measurement | Operational purpose |
|---|---|---|
| Open backlog value | Value of accepted outstanding orders | Measure committed demand |
| Backlog coverage | Backlog ÷ average monthly shipments | Assess order-book coverage |
| Past-due order rate | Past-due orders ÷ total open orders × 100 | Identify delivery risk |
| On-time delivery | On-time deliveries ÷ total deliveries × 100 | Measure fulfillment reliability |
| Material readiness | Requirements supported by eligible materials | Detect production blockers |
| Work-center loading | Scheduled hours ÷ available hours × 100 | Identify constrained resources |
| Production throughput | Completed output per period | Measure actual production flow |
| Schedule adherence | Planned work completed on schedule | Evaluate planning reliability |
Importantly, KPI definitions must remain consistent.
For example, an on-time delivery measure based on complete customer orders should not be compared directly with one calculated using individual order lines.
9.2. Why Backlog Aging Deserves More Attention
A manufacturer with $5 million in outstanding orders may have a healthy production schedule.
Alternatively, much of that same backlog could already be overdue.
Therefore, management should separate open orders by promised delivery date, production status, material availability, and customer priority.
This approach reveals whether customer commitments are progressing as expected.
Furthermore, aging reports help distinguish orders delayed by suppliers from those blocked by machine capacity or internal processing problems.
9.3. Connecting Manufacturing KPIs in One Reporting Environment
Backlog reporting becomes difficult when order data, inventory balances, production schedules, and accounting records exist in separate applications.
For example, purchasing may update a supplier delivery date without production immediately receiving the change.
Consequently, a work order may remain scheduled even though its required materials will arrive late.
An integrated ERP environment can improve consistency between these operational records.
For inventory-driven manufacturers, Xorosoft offers connected workflows through XoroONE.
However, trustworthy reporting still depends on accurate master data, consistent inventory transactions, and clear responsibilities.
CTA #1 — Free ERP Readiness Assessment
Is Your Manufacturing Backlog a Demand Problem or a Planning Problem?
Evaluate whether disconnected purchasing, inventory, production, and reporting workflows are affecting your ability to meet customer commitments.
10. How Manufacturing Backlogs Affect Working Capital and Cash Flow
A growing backlog may improve future revenue visibility, but outstanding orders do not necessarily produce immediate cash.
In fact, manufacturing businesses often incur substantial production costs before collecting customer payments.
Therefore, backlog growth should be evaluated alongside working capital requirements.
10.1. Why Backlog Value Is Not the Same as Revenue
A manufacturer may hold several million dollars in accepted customer orders while still purchasing raw materials and paying production employees.
Depending on contract terms, the business may receive customer deposits or progress payments.
However, other orders may not generate invoices until production is completed or products are delivered.
Consequently, backlog value should not be treated as guaranteed revenue or available cash.
Finance teams should examine contract terms, customer credit risk, production costs, and expected billing milestones.
10.2. Inventory Investment Can Increase Before Shipments
A delayed order may contain materials that have already been purchased, issued, or partially processed.
For example, a manufacturer could complete most production stages but remain unable to finish an assembly because one component has not arrived.
Meanwhile, cash remains tied up in work-in-process inventory.
Emergency freight, overtime, and repeated production changes can increase costs further.
Therefore, purchasing decisions should prioritize materials supporting executable production rather than simply increasing overall stock.
10.3. Connecting Order Profitability With Production Priorities
Not every outstanding manufacturing order has the same financial value.
Some orders offer stronger contribution margins, while others involve penalties, strategic customers, or expensive production constraints.
As a result, manufacturers should consider both delivery commitments and economic consequences when prioritizing work.
However, repeatedly changing production schedules can reduce throughput.
A stable prioritization process should balance customer obligations, material availability, capacity constraints, and profitability.
11. Reducing Manufacturing Backlogs Through Better Material Planning
Manufacturing backlog statistics identify the size of outstanding commitments, but operational improvements require understanding why orders are not progressing.
In many cases, the underlying issue is a mismatch between production requirements and available materials.
11.1. Start With Material Readiness Rather Than Inventory Totals
Manufacturers should begin by identifying the components required to complete outstanding orders.
Next, those requirements should be compared with eligible inventory, existing reservations, and confirmed supplier receipts.
This process helps distinguish orders ready for production from those likely to remain blocked.
For example, a factory may hold sufficient total inventory value while missing one component needed for several high-priority assemblies.
Therefore, material readiness provides a more actionable production signal than aggregate inventory value alone.
11.2. How Material Requirements Planning Supports Backlog Reduction
Material requirements planning, or MRP, translates production demand into component requirements.
It uses bills of materials, inventory balances, scheduled receipts, and purchasing lead times.
Consequently, planners can identify shortages before releasing work orders.
MRP also supports better purchasing priorities because component demand can be connected to specific production commitments.
However, the results depend on accurate data.
Incorrect bills of materials or unreliable inventory balances can generate misleading purchasing recommendations even when planning software is sophisticated.
11.3. Improving Coordination Between Purchasing and Production
Purchasing teams should understand which materials constrain the most important production orders.
Meanwhile, production planners need reliable supplier commitments before assigning customer delivery dates.
A connected workflow helps both teams evaluate the same requirements.
For example, Xorosoft provides manufacturing and inventory-related capabilities within its business solutions.
The broader principle is that production and purchasing should operate from consistent demand, inventory, and supply information.
12. Manufacturing Backlog Scenarios Across Different Industries
Manufacturing backlogs behave differently across industrial components, furniture, apparel, sporting goods, and food production.
Nevertheless, the underlying challenge remains consistent: customer commitments must be matched with eligible materials and achievable production capacity.
12.1. Industrial Components and Specialized Manufacturing
Consider a manufacturer producing custom industrial assemblies.
Each order requires several purchased components, specialized machining operations, and final inspection.
If one supplier delays a critical component, production may stop even when most materials are available.
Consequently, backlog management must consider supplier commitments, material shortages, and work-center schedules together.
Simply increasing finished-goods inventory would not address the underlying problem.
Instead, planners should identify which missing inputs prevent the highest-priority orders from progressing.
12.2. Furniture, Apparel and Sporting Goods
Furniture manufacturers often manage combinations of materials, finishes, and customer-specific configurations.
A shortage of approved upholstery fabric can delay certain products even while other inventory remains available.
Similarly, apparel and sporting-goods manufacturers face seasonal demand concentrated within limited selling windows.
Delayed production can result in inventory arriving after peak customer demand.
Therefore, these businesses need accurate inventory allocations, production schedules, and replenishment priorities.
The financial consequences of late orders may depend heavily on seasonality and customer requirements.
12.3. Food Manufacturing and Multi-Warehouse Operations
Food manufacturers must consider ingredient availability, batch requirements, shelf life, and quality restrictions.
As a result, physical inventory quantities may not accurately represent usable production supply.
Businesses managing several warehouses face additional complexity because inventory locations and reservations must remain synchronized.
Xorosoft supports several inventory-driven industries, including businesses that manage manufacturing, wholesale distribution, and complex inventory workflows.
Regardless of industry, reliable planning requires knowing whether the right materials are available at the right time and location.
13. When Manufacturing Backlog Management Requires ERP or MRP Software
Manufacturing backlog statistics become more actionable when businesses can connect customer demand with purchasing, inventory, production, and accounting records.
However, not every manufacturer requires a comprehensive ERP system.
The appropriate software depends on operational complexity rather than backlog value alone.
13.1. Spreadsheets vs. Inventory Software vs. MRP vs. ERP
Spreadsheets may be sufficient for small manufacturers with straightforward products and manageable order volumes.
Inventory software can improve stock visibility, while dedicated MRP tools focus on material requirements and production planning.
ERP platforms connect broader business processes, including purchasing, inventory, manufacturing, sales, and financial reporting.
Nevertheless, functionality varies by vendor.
| Capability | Spreadsheets | Inventory software | MRP | ERP |
|---|---|---|---|---|
| Order tracking | Manual | Varies | Usually available | Typically integrated |
| Inventory visibility | Manual | Core function | Connected | Integrated |
| BOM planning | Manual | Varies | Core function | Module-dependent |
| Production planning | Manual | Limited | Common | Module-dependent |
| Purchasing workflows | Manual | Varies | Common | Typically integrated |
| Accounting integration | Separate | Varies | Varies | Common |
Therefore, manufacturers should test specific business scenarios rather than making decisions based entirely on software categories.
13.2. Why Integrated Manufacturing Data Matters
Disconnected systems create opportunities for inconsistent information.
For example, purchasing may update a supplier delivery date while production continues using an outdated schedule.
Similarly, material consumption may be recorded in a warehouse application without immediately appearing in financial inventory records.
An integrated environment can reduce these disconnects.
For manufacturers evaluating cloud ERP, Xorosoft provides an option through XoroERP, connecting several inventory-driven operational functions.
However, implementation quality and business process discipline remain essential.
13.3. Signs That a Manufacturing Software Upgrade Is Necessary
Repeated inventory discrepancies, unreliable delivery promises, manual purchasing calculations, and frequent reporting reconciliation are common warning signs.
Additional complexity arises when businesses introduce multiple warehouses, ecommerce channels, or more sophisticated manufacturing requirements.
Nevertheless, software replacement should follow a structured operational assessment.
Before investing, management should identify which decisions are delayed, which data sources are unreliable, and which workflows need improvement.
CTA #2 — Watch Demo
See How Connected Manufacturing Planning Works
Explore how inventory, purchasing, bills of materials, work orders, and financial reporting can operate within a coordinated system.
14. Manufacturing Backlogs Across Shopify, Wholesale and Multichannel Operations
Manufacturers increasingly receive orders through direct business customers, wholesale accounts, ecommerce stores, and marketplaces.
When these channels share inventory and production capacity, disconnected order information can create unrealistic customer commitments.
Consequently, backlog management becomes an important part of multichannel operations.
14.1. Why Multiple Sales Channels Increase Planning Complexity
Consider a manufacturer selling through Shopify, Amazon, and wholesale distribution.
A wholesale purchase order may require inventory that also appears available on an ecommerce storefront.
If the business does not account for existing reservations, different customers may receive delivery promises based on the same physical stock.
The problem involves more than inventory synchronization.
Manufacturers also need accurate available-to-promise quantities, production schedules, and purchasing requirements.
Therefore, sales-channel inventory should reflect operational commitments rather than raw stock balances alone.
14.2. Connecting Ecommerce Orders With Production Planning
Ecommerce platforms primarily support storefront transactions and customer-facing commercial workflows.
Manufacturing operations require additional information about components, production orders, supplier commitments, and inventory costs.
These workflows must remain coordinated when customer demand depends on future production.
For example, the Xorosoft ERP app on the Shopify App Store describes integration capabilities involving ecommerce orders, inventory, fulfillment, and accounting.
The operational objective is to maintain dependable information between customer-facing sales activity and backend execution.
14.3. Why Integration Quality Matters More Than Integration Count
Adding more integrations does not automatically improve planning accuracy.
Instead, businesses need clear ownership of inventory availability, order status, purchasing commitments, and fulfillment updates.
Furthermore, exception handling must prevent incomplete or delayed updates from creating inaccurate promises.
A structured ERP integration approach should establish which system controls each critical record and how discrepancies are identified.
Ultimately, consistent operational data matters more than the number of connected applications.
15. Choosing Manufacturing ERP Without Recreating Backlog Problems
Manufacturing software should improve visibility into materials, capacity, and customer commitments.
However, replacing software without addressing inaccurate data or unclear processes can reproduce existing problems in a new system.
Therefore, ERP evaluation should begin with operational requirements.
15.1. Evaluate Manufacturing Systems Using Real Production Scenarios
A useful software evaluation should reflect the manufacturer’s actual processes.
For example, ask the vendor to demonstrate a customer order requiring several components, one delayed supplier receipt, and a constrained production resource.
Next, examine how the system handles inventory reservations, purchasing recommendations, production scheduling, and customer delivery commitments.
This approach reveals whether the software supports the business’s real planning needs.
Marketing feature lists alone rarely provide the same level of confidence.
15.2. Compare ERP Platforms Against Specific Requirements
Manufacturers evaluating NetSuite, Acumatica, Microsoft Dynamics 365 Business Central, and other ERP systems should compare functionality, implementation requirements, integrations, and total ownership costs.
However, a broad feature comparison may not reveal workflow limitations.
The evaluation should consider bill-of-material accuracy, manufacturing order execution, multi-warehouse requirements, accounting integration, and operational reporting.
Businesses considering alternatives can review the Xorosoft vs. NetSuite comparison as one reference, while independently validating capabilities.
15.3. Learn From Implementation Experience and Operational Results
Implementation success depends on more than software configuration.
Accurate inventory data, consistent product identifiers, realistic production routing, and trained operational teams are equally important.
Therefore, manufacturers should request relevant workflow demonstrations and examine documented customer experiences.
When evaluating Xorosoft, businesses can review available customer case studies to understand the types of operational challenges addressed.
However, individual case-study results should not be treated as guaranteed outcomes for another manufacturer.
16. Manufacturing Backlog Statistics 2026: A Practical 30-Day Action Plan
The most important lesson from manufacturing backlog statistics is that outstanding order value must be interpreted alongside material availability, production capacity, and delivery performance.
A growing order book can create opportunities. However, reliable planning determines whether those opportunities become completed, profitable customer deliveries.
Therefore, manufacturers should turn the latest manufacturing backlog statistics into specific operational actions.
16.1. Days 1–7: Establish Accurate Backlog Visibility
Begin by reviewing open customer orders, promised shipment dates, production status, and inventory allocations.
Next, separate future scheduled commitments from overdue orders.
Inventory balances should also reflect reservations, quality restrictions, and warehouse locations.
As a result, management can establish a dependable picture of what the business has promised and which orders remain unfinished.
16.2. Days 8–21: Identify Material and Capacity Constraints
Review critical component shortages, supplier delivery commitments, and work-center schedules.
Then determine which constraints prevent the largest number of important orders from progressing.
Production priorities should reflect material readiness, customer commitments, and realistic capacity.
Furthermore, managers should avoid releasing additional work into already overloaded production resources.
Instead, focus on removing the constraints that limit completed throughput.
16.3. Days 22–30: Build a Sustainable Manufacturing Backlog Review Process
Create a weekly dashboard tracking backlog value, overdue commitments, material availability, production capacity, and on-time delivery.
Assign responsibility for investigating exceptions and updating customer commitments.
Meanwhile, evaluate whether existing software provides consistent information across purchasing, inventory, manufacturing, and accounting.
If disconnected systems continue creating uncertainty, consider whether an integrated ERP environment could improve operational visibility.
Final CTA — Book a Personalized Manufacturing ERP Demo
Manufacturers managing growing order volumes across purchasing, inventory, production, warehousing, and accounting can explore how connected workflows support better planning.
For a discussion of your operational requirements, contact the Xorosoft team to arrange a personalized demonstration.
Ultimately, manufacturing performance improves when customer demand, material readiness, production capacity, and delivery commitments are managed together.
Frequently Asked Questions About Manufacturing Backlogs
What do manufacturing backlog statistics measure?
Manufacturing backlog statistics track accepted orders not yet recognized as sales. Combined with shipment data, they reveal outstanding demand and potential fulfillment pressure.
How do manufacturers calculate an order backlog?
Add net new orders to opening backlog, then subtract recognized sales. Use consistent definitions for cancellations, partial orders, and reporting periods.
Does a growing manufacturing backlog always indicate strong demand?
No. Growth may reflect stronger orders, slower production, material shortages, or delayed shipments. Therefore, review overdue orders and throughput before drawing conclusions.
What is a healthy manufacturing backlog ratio?
There is no universal benchmark. Instead, compare backlog coverage with historical shipment rates, production lead times, delivery performance, and your manufacturing model.
Why can manufacturers have inventory but still face backlogs?
Inventory may contain incorrect components, reserved stock, or quality-held materials. Consequently, manufacturers must verify component availability against actual production requirements.
How does production capacity affect manufacturing backlogs?
Overloaded work centers and labor shortages can delay orders despite available equipment elsewhere. Therefore, manufacturers should monitor bottleneck capacity and production throughput.
When should a manufacturer upgrade to ERP software?
Consider ERP when disconnected inventory, purchasing, and production systems repeatedly cause delays. Integrated workflows can improve visibility, planning accuracy, and order fulfillment.
Recent Posts
-
 WMS vs Shopify Fulfillment Tools: When Warehouse Complexity Requires More
 -
 Manufacturing Backlog Statistics 2026: Orders, Inventory and Capacity Signals
 -
 ERP Software for Canadian Wholesale Companies Managing US Sales
 -
 Shopify Accounting Integration: How to Reconcile Orders, Fees, Refunds, and Payouts to ERP
 -
 Negative Inventory Accounting: Why COGS and Gross-Margin Reporting Go Wrong