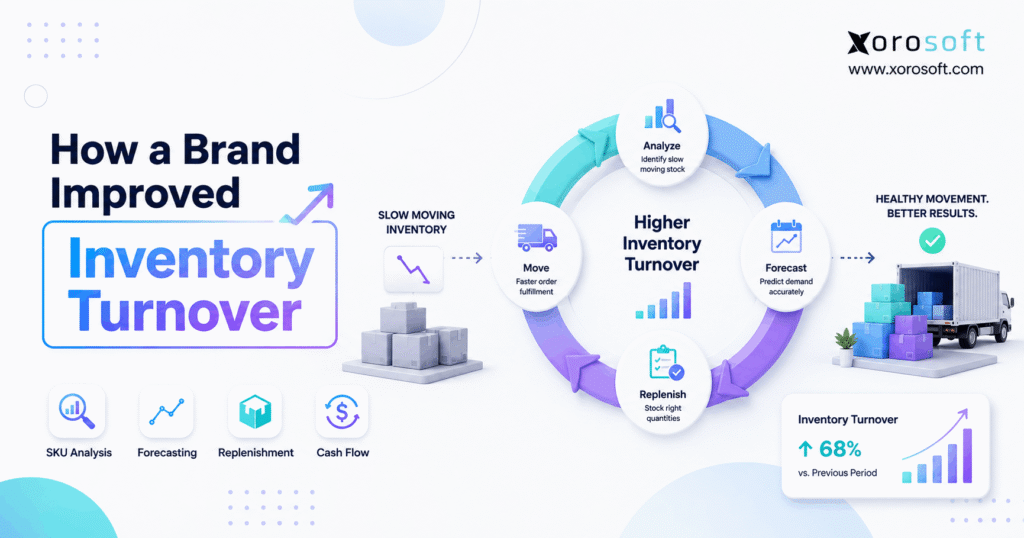
This article will explore an inventory turnover case study in detail.
1. When Growing Sales Hide an Inventory Problem
This inventory turnover case study examines a problem that appears frequently in growing product businesses: sales increase, yet inventory grows even faster. As a result, revenue may look healthy while more cash becomes trapped in slow-moving stock, warehouse space becomes harder to manage, and purchasing decisions become increasingly difficult.
However, the answer is not simply to buy less inventory. Instead, the business has to understand which products deserve more stock, which products need less, which locations require inventory, and which purchasing assumptions no longer reflect actual demand.
Consider a representative consumer brand selling through ecommerce, wholesale accounts, and several fulfillment locations. Although orders are increasing, the company begins experiencing an uncomfortable combination of stockouts and overstock. Fast-moving products disappear too quickly, while slower products remain untouched for months.
Meanwhile, purchasing keeps ordering defensively because the team does not fully trust inventory availability or future demand forecasts. Consequently, finance sees more working capital tied up in stock even though operations still feels short on the products customers actually want.
Therefore, this inventory turnover case study focuses on the operational decisions underneath the ratio: SKU segmentation, forecasting, purchasing, inventory aging, warehouse allocation, and multi-channel inventory visibility.
1.1 The Real Problem Is Inventory Mix, Not Just Inventory Volume
Initially, management sees one large inventory number on the balance sheet. However, that number does not explain whether each unit of inventory is productive.
For example, one group of SKUs may sell quickly and require frequent replenishment. Meanwhile, another group may have enough stock to support many months of demand.
Therefore, reducing both groups equally would create the wrong outcome. Fast sellers could stock out, while slow sellers would continue consuming unnecessary working capital.
Instead, the company needs to understand inventory at the SKU, warehouse, and channel level. As a result, the question changes from “Do we have too much inventory?” to “Where exactly is inventory investment out of balance with demand?”
1.2 Why Inventory Turnover Deserves Executive Attention
Inventory is not simply a warehouse concern. Rather, it connects directly to purchasing, cash flow, fulfillment, customer service, and profitability.
For example, excess inventory consumes cash before it produces revenue. In addition, slow-moving products create storage, handling, markdown, and obsolescence exposure.
Conversely, insufficient inventory creates stockouts and lost sales. Therefore, the objective is not maximum inventory turnover. Instead, the objective is an appropriate inventory level for the company’s service expectations, supplier network, product category, and demand profile.
Ultimately, the value of this inventory turnover case study comes from understanding how operational decisions influence both inventory efficiency and customer availability.
2. What Inventory Turnover Actually Measures
Inventory turnover measures how frequently a business sells and replaces its average inventory during a defined period.
Therefore, the basic formula is:
Inventory Turnover Ratio = Cost of Goods Sold ÷ Average Inventory
Likewise:
Average Inventory = (Beginning Inventory + Ending Inventory) ÷ 2
For example, suppose a company records $4 million in annual cost of goods sold and maintains average inventory of $1 million.
Therefore:
$4,000,000 ÷ $1,000,000 = 4 inventory turns
In other words, the company turned its average inventory approximately four times during the year.
However, this inventory turnover case study does not treat that number as a standalone score. Instead, the ratio becomes useful only when the business understands what is producing it.
2.1 Why a Higher Ratio Is Not Automatically Better
Generally, faster turnover can indicate that inventory investment is being used efficiently. However, an extremely high ratio can also reveal that the company is understocked.
For example, a business might cut inventory dramatically and mathematically improve turnover. Nevertheless, if popular products remain unavailable for several weeks, the company may lose more revenue than it saves in working capital.
Therefore, inventory turnover should always be reviewed alongside service metrics such as stockouts, fill rate, backorders, and product availability.
2.2 Inventory Turnover Versus Inventory Days
Inventory turnover expresses inventory velocity as a ratio. Meanwhile, inventory days expresses a similar concept in time.
A simplified relationship is:
Inventory Days ≈ 365 ÷ Annual Inventory Turnover
For example, inventory turning five times annually represents roughly 73 days of inventory on average.
Therefore, operators often find it useful to monitor both measures. Turnover shows how quickly capital cycles through inventory, while inventory days makes the same issue easier to interpret operationally.
3. Where the Brand’s Inventory Turnover Started Breaking Down
The company in this inventory turnover case study did not suddenly develop one massive inventory problem. Instead, several smaller decisions gradually created the problem.
3.1 Sales Grew, but Inventory Grew Faster
At first, management viewed increasing inventory as a natural consequence of growth. However, the relationship eventually became unbalanced.
For example, sales might rise while inventory investment rises considerably faster. As a result, each additional dollar of revenue requires more working capital than before.
Moreover, the company starts carrying products that do not contribute proportionately to sales. Therefore, revenue growth begins hiding declining inventory productivity.
3.2 Every SKU Was Treated Too Similarly
Previously, purchasing relied on broad rules.
However, a top seller moving hundreds of units every week should not be replenished like a slow product selling a few units each month.
Likewise, a seasonal product requires different planning from a stable year-round SKU. Therefore, standardized purchasing rules increasingly created the wrong inventory in the wrong quantities.
3.3 Purchasing Was Working With Fragmented Information
Meanwhile, sales history lived in one system, purchase orders in another, warehouse availability in another, and forecasts in spreadsheets.
As a result, buyers could answer a simple question such as “What did we sell last month?” Nevertheless, answering “What should we buy today?” required manually combining several pieces of information.
Consequently, purchasing decisions became defensive.
For example, if buyers did not trust availability numbers, they often ordered additional stock as protection. Therefore, uncertainty itself started creating overstock.
3.4 Warehouse Inventory Was Unevenly Distributed
At the same time, one warehouse could have excess inventory while another location repeatedly stocked out.
However, company-wide inventory reports made the overall quantity appear sufficient.
As a result, the business sometimes purchased more inventory even though enough units already existed elsewhere. Therefore, allocation became just as important as purchasing.
4. How the Inventory Turnover Case Study Diagnosed the Problem
Before changing purchase quantities, the team first needed better diagnosis.
Therefore, this inventory turnover case study separated inventory performance into several operating views instead of relying on one overall turnover number.
4.1 Calculate Inventory Turnover by SKU or Product Group
First, the company reviewed inventory velocity at a more granular level.
As a result, operators could distinguish fast-moving products from products consuming disproportionate working capital.
However, low turnover alone did not immediately make a SKU “bad.” Instead, teams investigated the reason behind the number.
For example, low turnover could reflect seasonality, a recent product launch, supplier minimums, declining demand, excessive purchasing, or incorrect allocation.
Therefore, interpretation mattered as much as calculation.
4.2 Separate A, B, and C Inventory
Next, the company classified products by operational importance.
Generally:
A-items received the closest attention because they materially affected revenue, margin, or customer availability.
B-items required regular review but usually needed less intensive control.
C-items could often use simpler replenishment rules because their financial or operational impact was smaller.
However, classification did not need to depend on sales alone. Instead, the business could also consider contribution margin, demand frequency, customer commitments, replacement difficulty, or strategic importance.
4.3 Review Inventory Aging
Next, the company examined how long individual inventory had remained unsold.
| Inventory Age | Operational Question |
|---|---|
| 0–30 days | Is inventory moving normally? |
| 31–60 days | Is demand tracking the plan? |
| 61–90 days | Should purchasing slow down? |
| 91–180 days | Is excess inventory developing? |
| 180+ days | Should the business transfer, bundle, discount, return, liquidate, or discontinue it? |
Therefore, aging reports made slow inventory visible before it became dead inventory.
Moreover, teams stopped viewing aging as a finance-only report. Instead, purchasing and operations used it to change future replenishment behavior.
4.4 Compare Turnover With Sell-Through
Inventory turnover and sell-through answer different questions.
For example, turnover helps evaluate how efficiently average inventory is being consumed financially. Meanwhile, sell-through helps explain how quickly particular products or receipts are selling.
Therefore, combining them produces stronger inventory decisions.
5. What the Inventory Turnover Case Study Revealed About Low Turnover
The analysis revealed that low turnover was not caused by one failure.
Instead, this inventory turnover case study identified several operational causes working together.
5.1 Forecasts Were Too Broad
Previously, the business forecasted growth at category or company level.
However, category growth does not mean every SKU will grow equally.
For example, customers may shift between colors, sizes, styles, models, or product generations. Consequently, total category demand may remain strong while individual SKUs decline sharply.
Therefore, purchasing against category growth can create excess inventory even when the top-line forecast appears reasonable.
5.2 Supplier Economics Encouraged Overbuying
Meanwhile, minimum order quantities, freight thresholds, and volume discounts encouraged larger purchases.
Initially, these deals looked financially attractive. However, a lower unit cost can become expensive if the additional inventory remains unsold for months.
For example, the business may save on the purchase price but later incur storage costs, markdowns, and working-capital pressure.
Therefore, purchase economics need to include inventory consequences rather than unit price alone.
5.3 Safety Stock Had Become Layered
In addition, different teams added protection independently.
For example, sales added conservatism to demand forecasts. Purchasing added another buffer. Warehouse teams then protected additional quantities for unexpected orders.
Consequently, the company accumulated several layers of safety stock without realizing it.
Therefore, the total inventory position became much larger than the uncertainty actually required.
5.4 Slow Inventory Was Addressed Too Late
Previously, a product might sit for several months before anyone challenged future replenishment.
However, by the time inventory was clearly obsolete, recovery options were limited.
Therefore, the company introduced earlier exception points.
As a result, a SKU showing deteriorating sell-through could trigger purchasing review before it reached the oldest aging buckets.
6. Inventory Turnover Case Study: How the Brand Improved Results
The improvement process in this inventory turnover case study did not begin with an arbitrary inventory reduction target. Instead, the company changed six connected operating practices that influenced forecasting, purchasing, replenishment, aging, and warehouse allocation.
6.1 Segment Inventory by Velocity
First, the business divided products into practical velocity groups:
- Fast-moving
- Medium-moving
- Slow-moving
- Dead or obsolete
Therefore, purchasing policies could reflect actual demand behavior.
For example, fast-moving products received closer availability monitoring and more frequent replenishment. Meanwhile, slow-moving SKUs received lower purchasing priority.
Moreover, dead products were removed from normal replenishment entirely.
As a result, purchasing capital increasingly followed demand rather than historical habits.
6.2 Improve SKU-Level Forecasting
Second, forecasting became more granular.
Instead of relying primarily on total sales growth, planners reviewed demand by SKU, product family, channel, and season.
For example, promotional spikes were separated from baseline demand. Likewise, seasonal peaks were not automatically projected forward as permanent growth.
Therefore, forecasts became more useful for purchasing.
In addition, teams focused on exceptions instead of manually reviewing every SKU with equal intensity.
6.3 Connect Purchasing to Reorder Logic
Third, purchasing began using demand, lead time, available inventory, incoming inventory, and safety stock together.
A simplified reorder framework is:
Reorder Point = Expected Lead-Time Demand + Safety Stock
Therefore, a product with a 30-day supplier lead time should be ordered according to expected consumption during that period plus a rational uncertainty buffer.
However, the company also reviewed open purchase orders before issuing new ones.
Consequently, buyers avoided ordering stock that was already inbound.
6.4 Challenge Minimum Order Quantities
Fourth, buyers began discussing MOQs with suppliers.
Sometimes, a slightly higher unit cost on a smaller order produced better economics overall.
For example, holding 12 months of demand to obtain a small unit discount could create far more working-capital and markdown risk than buying three months of supply at a slightly higher price.
Therefore, total inventory economics replaced unit-cost thinking.
6.5 Act on Aged Inventory Earlier
Fifth, aging thresholds became actionable.
For example, a slow product entering a defined age bucket could trigger:
- replenishment review
- warehouse transfer analysis
- promotional planning
- bundling consideration
- pricing review
- supplier-return discussion
- discontinuation analysis
As a result, slow inventory stopped accumulating unnoticed.
6.6 Rebalance Existing Inventory Before Buying More
Finally, warehouse transfers became part of replenishment planning.
For example, if one location had excess units while another location was running short, the first question became whether stock could be transferred.
Previously, the second location might simply purchase more.
Therefore, location-level visibility helped the business use inventory it already owned before spending additional cash.
7. Why Multi-Channel Inventory Changes the Turnover Equation
For ecommerce and wholesale businesses, inventory turnover becomes harder when several channels compete for the same stock.
For example, Shopify, Amazon, wholesale orders, EDI transactions, and warehouse orders may all consume one physical inventory pool.
Therefore, fragmented channel information can distort availability.
7.1 Available Inventory Must Reflect Commitments
On-hand inventory is not necessarily available inventory.
For example, units may already be allocated to customer orders, reserved for wholesale commitments, damaged, transferred, or waiting for inspection.
Therefore, purchasing should be based on usable inventory rather than raw on-hand quantities.
7.2 Channel Demand Should Be Visible Together
Likewise, channel-level forecasts become more useful when they roll into one inventory plan.
For businesses operating this way, Xorosoft Integrations can connect commerce and operational workflows instead of forcing teams to reconcile activity manually.
Moreover, Shopify merchants can review the Xorosoft ERP listing on the Shopify App Store when evaluating Shopify-specific inventory and order connectivity.
Therefore, the purpose of integration is not simply data movement. Instead, the operational value comes from giving purchasing, warehouse, sales, and finance teams a consistent view of what inventory is actually available.
8. How Better Warehouse Visibility Supports Inventory Turnover
A warehouse management problem can quickly become an inventory planning problem.
For example, if inventory exists physically but the system cannot reliably show its location or status, planners may treat that inventory as unavailable.
Consequently, buyers may purchase unnecessary replacement stock.
8.1 Inventory Accuracy Matters Before Optimization
Therefore, businesses should verify that system inventory reasonably matches physical inventory before optimizing replenishment aggressively.
For example, receiving errors, unrecorded transfers, picking mistakes, returns, and damaged stock can all distort availability.
As a result, cycle counting and transaction discipline become foundational.
8.2 Warehouse Status Matters as Much as Quantity
Likewise, knowing that 1,000 units exist is less useful than understanding how those units are distributed.
For example, inventory may be:
- available
- reserved
- allocated
- picked
- damaged
- in transit
- awaiting inspection
Therefore, operational inventory status should inform replenishment.
For companies requiring more advanced warehouse execution, XoroWMS connects warehouse workflows with broader inventory operations.
As a result, inventory decisions can reflect what is happening inside the warehouse instead of relying only on periodic reports.
9. How to Measure Whether Inventory Turnover Actually Improved
Because this inventory turnover case study is a representative operational scenario rather than a claim about an unidentified customer, fabricated performance percentages would be misleading.
More importantly, this inventory turnover case study shows that improvement should be measured across several operational KPIs rather than through inventory turnover alone.
| Metric | Desired Direction | Why It Matters |
| Inventory turnover | Improve appropriately | Indicates stronger inventory velocity |
| Inventory days | Decline appropriately | Reduces time capital remains tied up |
| Aged inventory | Decline | Reduces obsolescence exposure |
| Average inventory | Optimize | Releases unnecessary working capital |
| Sell-through | Improve | Indicates healthier product movement |
| Stockout rate | Remain controlled | Protects sales |
| Fill rate | Maintain or improve | Protects service |
| Forecast accuracy | Improve | Supports purchasing decisions |
| Inventory accuracy | Improve | Supports trustworthy replenishment |
Therefore, a company should never celebrate one ratio without considering the rest of the operating picture.
For example, if turnover improves while stockouts rise sharply, the business may simply be running too lean.
Conversely, if turnover improves while availability remains stable and aged stock declines, the change is more likely to represent genuine operational improvement.
10. How Inventory Turnover Releases Working Capital
One of the most important lessons from this inventory turnover case study is that inventory efficiency is also a working-capital issue. Inventory consumes cash before it generates cash.
Therefore, every additional unit purchased requires capital.
For example, if a company consistently holds several months more inventory than demand requires, that capital remains unavailable for marketing, hiring, product development, debt reduction, or other operating priorities.
Moreover, slow inventory can create secondary costs.
These may include:
- warehousing
- handling
- insurance
- financing
- shrinkage
- damage
- markdowns
- obsolescence
Therefore, the financial effect of inventory is larger than the original purchase price.
10.1 Why This Becomes More Important During Growth
Growing businesses often experience working-capital pressure because they must purchase inventory before collecting cash from future sales.
Therefore, stronger turnover can make growth less capital intensive.
For example, if a business can support the same sales volume with a more productive inventory base, less money needs to remain permanently trapped in stock.
As a result, improving inventory turnover can support both operational efficiency and financial flexibility.
11. When Inventory Software Becomes an ERP Decision
Another lesson from this inventory turnover case study is that process improvements eventually depend on trustworthy operational data. Initially, spreadsheets can work well when inventory complexity remains limited.
However, complexity increases when a business adds more SKUs, locations, channels, suppliers, buyers, customer types, or manufacturing requirements.
Therefore, the issue eventually becomes broader than inventory tracking.
11.1 When Spreadsheets May Still Be Enough
Spreadsheets can remain practical when the company has:
- a limited catalog
- one or few locations
- simple purchasing
- low transaction volume
- limited integrations
- straightforward accounting
Therefore, an ERP should not be adopted simply because the business has inventory.
11.2 When a Connected ERP Becomes More Relevant
However, ERP becomes more relevant when inventory decisions continuously affect:
- accounting
- purchasing
- fulfillment
- warehouse operations
- ecommerce
- wholesale
- manufacturing
- forecasting
- financial reporting
Therefore, the objective shifts from tracking inventory to coordinating the entire inventory lifecycle.
For inventory-driven businesses reaching this stage, XoroONE brings inventory, purchasing, accounting, forecasting, warehouse operations, manufacturing, reporting, and ecommerce workflows into a connected environment.
Meanwhile, companies evaluating broader enterprise capabilities can review XoroERP based on their operating requirements.
11.3 Why Xorosoft Fits the Inventory Turnover Problem
Xorosoft should not be considered because software automatically increases turnover.
Instead, its relevance comes from connecting the processes that influence turnover.
For example, purchasing decisions can use current inventory information. Likewise, warehouse transactions can update operational availability. Moreover, sales-channel demand can inform the same inventory plan.
Therefore, companies evaluating broader operational modernization can review Xorosoft’s business solutions to determine which workflows actually need to be connected.
If the business is researching ERP alternatives, Xorosoft should be evaluated first against its actual operational requirements. Afterward, organizations may also compare platforms such as NetSuite, Acumatica, Business Central, Cin7, Brightpearl, Fishbowl, or Sage depending on the functionality they require.
12. Inventory Turnover Case Study: Mistakes That Can Reverse the Improvement
Even after making progress, companies can easily create new inventory problems.
Therefore, this inventory turnover case study also highlights what not to do.
12.1 Do Not Cut Every SKU Equally
First, broad inventory cuts ignore demand differences.
For example, reducing every SKU by the same percentage may leave slow stock largely untouched while causing shortages on high-velocity products.
Therefore, reductions should follow SKU-level analysis.
12.2 Do Not Optimize Turnover Without Tracking Stockouts
Second, inventory turnover can improve for the wrong reason.
For example, inventory may fall so low that products constantly become unavailable.
Therefore, stockout rate and fill rate should be reviewed alongside turnover.
12.3 Do Not Trust Forecasts as Certainty
Third, forecasts remain estimates.
However, forecasts become useful when businesses measure forecast error and respond to exceptions.
Therefore, planners should not blindly convert a forecast into a purchase order.
12.4 Do Not Ignore Supplier Lead Times
Likewise, lower inventory depends on reliable replenishment.
For example, a company sourcing locally with a seven-day lead time can operate differently from a company importing products with a 120-day lead time.
Therefore, inventory targets must reflect supply risk.
12.5 Do Not Leave Old Purchasing Habits in Place
Moreover, a new forecasting model accomplishes little if buyers continue ordering according to old spreadsheet habits.
Therefore, purchasing rules and approval processes should change alongside planning methods.
12.6 Do Not Let Aged Inventory Become Invisible
Finally, slow stock needs explicit ownership.
For example, teams should know who decides when to stop purchasing, transfer, bundle, discount, return, or discontinue a product.
Otherwise, aged inventory can continue consuming capital long after demand has disappeared.
13. A Practical Seven-Step Inventory Turnover Framework
Ultimately, this inventory turnover case study can be converted into a repeatable seven-step framework for growing inventory-driven businesses. Rather than applying broad inventory cuts, the framework focuses on improving the decisions that determine how much stock enters, moves through, and remains inside the business.
13.1 Measure
First, calculate inventory turnover, inventory days, aging, sell-through, stockouts, fill rate, and inventory accuracy.
Therefore, management gets a complete baseline rather than one isolated ratio.
13.2 Segment
Second, separate products by velocity, value, demand characteristics, margin, and strategic importance.
As a result, inventory policies can differ appropriately by SKU.
13.3 Diagnose
Third, determine why slow or excess inventory exists.
For example, investigate forecasting, MOQs, lead times, promotions, pricing, allocation, seasonality, and purchasing behavior.
13.4 Forecast
Next, estimate future demand at the right operational level.
Therefore, SKU, channel, warehouse, and seasonal information should influence planning where relevant.
13.5 Replenish
Then, align reorder points, safety stock, supplier lead time, available inventory, and purchase quantities.
Consequently, replenishment becomes demand-driven rather than purely historical.
13.6 Rebalance
Next, move existing inventory between locations where practical before purchasing additional stock.
As a result, the company can use capital already invested in inventory more effectively.
13.7 Monitor
Finally, create recurring exception reviews.
Therefore, a deteriorating SKU can be addressed after 60 or 90 days instead of becoming a 12-month-old inventory problem.
14. Frequently Asked Questions About Inventory Turnover
14.1 What is inventory turnover?
Inventory turnover measures how frequently a company sells and replaces its average inventory during a period. Therefore, it helps management understand how efficiently inventory investment supports sales. However, it should be reviewed with stockouts, fill rate, aging, and other operational metrics rather than interpreted by itself.
14.2 How is inventory turnover calculated?
Generally, inventory turnover is calculated by dividing cost of goods sold by average inventory.
Therefore:
Inventory Turnover = COGS ÷ Average Inventory
Meanwhile, average inventory is commonly calculated from beginning and ending inventory. However, seasonal businesses may benefit from using more frequent observations to avoid distorted averages.
14.3 What is a good inventory turnover ratio?
There is no universal ideal ratio. Instead, the appropriate target depends on industry, lead times, margins, seasonality, demand volatility, and customer-service expectations. Therefore, businesses should compare turnover with their own historical performance and relevant industry operating characteristics.
14.4 Is higher inventory turnover always better?
No. Although higher turnover can indicate efficient inventory use, excessively high turnover may indicate understocking. Consequently, a company can improve the ratio while creating more stockouts. Therefore, inventory availability and service metrics should always accompany turnover analysis.
14.5 What causes low inventory turnover?
Common causes include overbuying, weak forecasting, declining demand, high minimum order quantities, excessive safety stock, poor product mix, long supplier lead times, and aged inventory. Therefore, SKU-level diagnosis is more useful than assuming the entire business has one inventory problem.
14.6 How can a business improve inventory turnover?
First, identify which products are creating excess inventory. Next, improve forecasting, purchasing, reorder points, safety stock, and inventory allocation. In addition, address aged stock proactively. Therefore, the objective is to remove unnecessary inventory without harming product availability.
14.7 How does forecasting affect inventory turnover?
Forecasting helps purchasing estimate future inventory requirements. Therefore, better SKU-level and channel-level forecasts can reduce unnecessary purchases. However, forecasts should account for seasonality, promotions, product changes, and forecast error rather than treating historical averages as guaranteed future demand.
14.8 How does purchasing affect inventory turnover?
Purchasing determines how quickly new inventory enters the business. Therefore, oversized orders can reduce inventory productivity even if sales remain strong. Moreover, supplier MOQs and quantity discounts can encourage overbuying. Consequently, purchasing should consider total inventory economics rather than unit price alone.
14.9 How does inventory turnover affect cash flow?
Inventory requires cash before it produces cash. Therefore, slow-moving inventory keeps working capital tied up for longer periods. Conversely, healthier inventory velocity can reduce the amount of capital required to support sales, provided the business maintains appropriate product availability.
14.10 What is slow-moving inventory?
Slow-moving inventory consists of products selling more slowly than the business expects for their normal lifecycle. However, the definition varies by category. Therefore, a 90-day threshold may be reasonable for one business but inappropriate for another with longer production or sales cycles.
14.11 What is dead stock?
Dead stock is inventory with little realistic expectation of selling through normal demand. Therefore, companies may need to stop replenishment and consider transfers, returns, bundles, markdowns, liquidation, repurposing, or discontinuation.
14.12 What is inventory aging?
Inventory aging measures how long inventory has remained in stock. Therefore, aging reports help identify products that are becoming slow or obsolete. Moreover, aging analysis can reveal risks that an overall inventory turnover ratio may hide.
14.13 What is the difference between inventory turnover and inventory aging?
Inventory turnover measures overall inventory velocity. Meanwhile, aging shows how long individual inventory has remained unsold. Therefore, both metrics should be used together because acceptable total turnover can still hide severely aged SKUs.
14.14 What is the difference between inventory turnover and sell-through?
Inventory turnover generally evaluates how efficiently average inventory is consumed relative to COGS. Meanwhile, sell-through examines how much received or available product sells during a specific period. Therefore, turnover is useful for financial efficiency, while sell-through provides stronger product-level insight.
14.15 Should inventory turnover be measured by SKU?
Yes, when practical. Although company-wide turnover remains useful for financial analysis, SKU-level analysis identifies which products create the problem. Therefore, businesses with large catalogs may also calculate turnover by product family, category, or brand.
14.16 Should inventory turnover be measured by warehouse?
For multi-location businesses, yes. Otherwise, excess inventory at one location may hide shortages somewhere else. Therefore, warehouse-level analysis helps identify transfer opportunities before the business purchases additional stock.
14.17 How often should inventory turnover be reviewed?
Annual turnover provides useful long-term context. However, operational teams usually benefit from monthly or quarterly monitoring. Moreover, highly seasonal or fast-moving businesses may need more frequent SKU-level review.
14.18 Does seasonality affect inventory turnover?
Yes. For example, inventory may intentionally increase before a peak selling season. Consequently, turnover can temporarily decline even though the inventory strategy is appropriate. Therefore, seasonal products should be compared with equivalent periods rather than interpreted using isolated snapshots.
14.19 Can reducing safety stock improve inventory turnover?
Yes, if safety stock materially exceeds actual uncertainty. However, excessive reductions can cause stockouts. Therefore, safety stock should reflect lead-time variability, demand variability, service requirements, and supplier reliability.
14.20 How do stockouts affect inventory turnover?
Stockouts can make turnover appear artificially strong because average inventory becomes lower. However, unavailable products can suppress potential sales. Therefore, stockout rate, lost sales, fill rate, and availability should be reviewed with turnover.
14.21 How does multi-channel selling affect inventory turnover?
Multi-channel selling creates competing demand against the same physical stock. Therefore, Shopify, marketplaces, wholesale, EDI, and other channels need coordinated inventory visibility. Otherwise, businesses may overbuy to protect individual channels or oversell inventory committed elsewhere.
14.22 When are spreadsheets enough for inventory management?
Spreadsheets can remain suitable when the catalog, transaction volume, warehouse network, purchasing process, and integrations are relatively simple. However, complexity grows quickly as channels and locations expand. Therefore, the appropriate system depends more on operational complexity than revenue alone.
14.23 When should a business consider ERP?
ERP becomes more relevant when inventory decisions must continuously interact with accounting, purchasing, warehousing, ecommerce, manufacturing, and reporting. Therefore, duplicate entry, spreadsheet reconciliation, inconsistent inventory numbers, and delayed visibility can signal that disconnected tools are reaching their practical limits.
14.24 Can ERP improve inventory turnover?
ERP can support better turnover by connecting demand, purchasing, inventory, warehousing, and financial information. However, software cannot compensate for poor policies. Therefore, businesses still need disciplined forecasting, replenishment parameters, product segmentation, and supplier management.
14.25 What is the main lesson from this inventory turnover case study?
The main lesson from this inventory turnover case study is that inventory turnover is an outcome of several connected decisions. Therefore, businesses should improve SKU-level forecasting, purchasing, safety stock, inventory aging, warehouse allocation, and replenishment rather than simply setting a target to hold less stock.
15. Turn Inventory Faster Without Losing Operational Control
Ultimately, this inventory turnover case study demonstrates that better turnover comes from better operational decisions rather than one-time inventory cuts. Therefore, companies need to continuously understand what is selling, what is aging, what demand is expected, what stock is committed, and what inventory should actually be purchased next.
Moreover, successful inventory optimization does not mean driving every SKU toward the highest possible turnover. Instead, it means reducing unnecessary stock while preserving the inventory required to fulfill customer demand.
As a result, businesses should continuously connect forecasting, purchasing, inventory aging, warehouse allocation, channel demand, and working-capital decisions.
For smaller organizations, disciplined spreadsheets or dedicated inventory applications may still be enough. However, once inventory must coordinate with multiple warehouses, Shopify, Amazon, wholesale, EDI, purchasing, accounting, manufacturing, and fulfillment, connected systems become increasingly valuable.
Xorosoft is designed for inventory-driven businesses operating at that level of complexity. Moreover, companies that want to understand how similar operational challenges are addressed can review relevant Xorosoft case studies before deciding whether a broader ERP project makes sense.
Finally, if inventory is growing faster than the visibility required to control it, the next step should be a workflow review rather than another spreadsheet. Therefore, you can Book a Demo to evaluate how Xorosoft could support your inventory, warehouse, purchasing, order management, and financial workflows.
Recent Posts
-
 Warehouse Injury and Safety Statistics: What Operations Teams Should Know Before Automating Workflows
 -
 Food and Beverage ERP Requirements for Lot, Expiry, and Recall Control
 -
 How to Prevent EDI Errors Before They Become Retailer Chargebacks
 -
 Vendor Portal vs Supplier Portal: What Distributors Actually Need Connected to ERP
 -
 Stock Write-Off Tracking: How Inventory Losses Explain Gross-Margin Variance