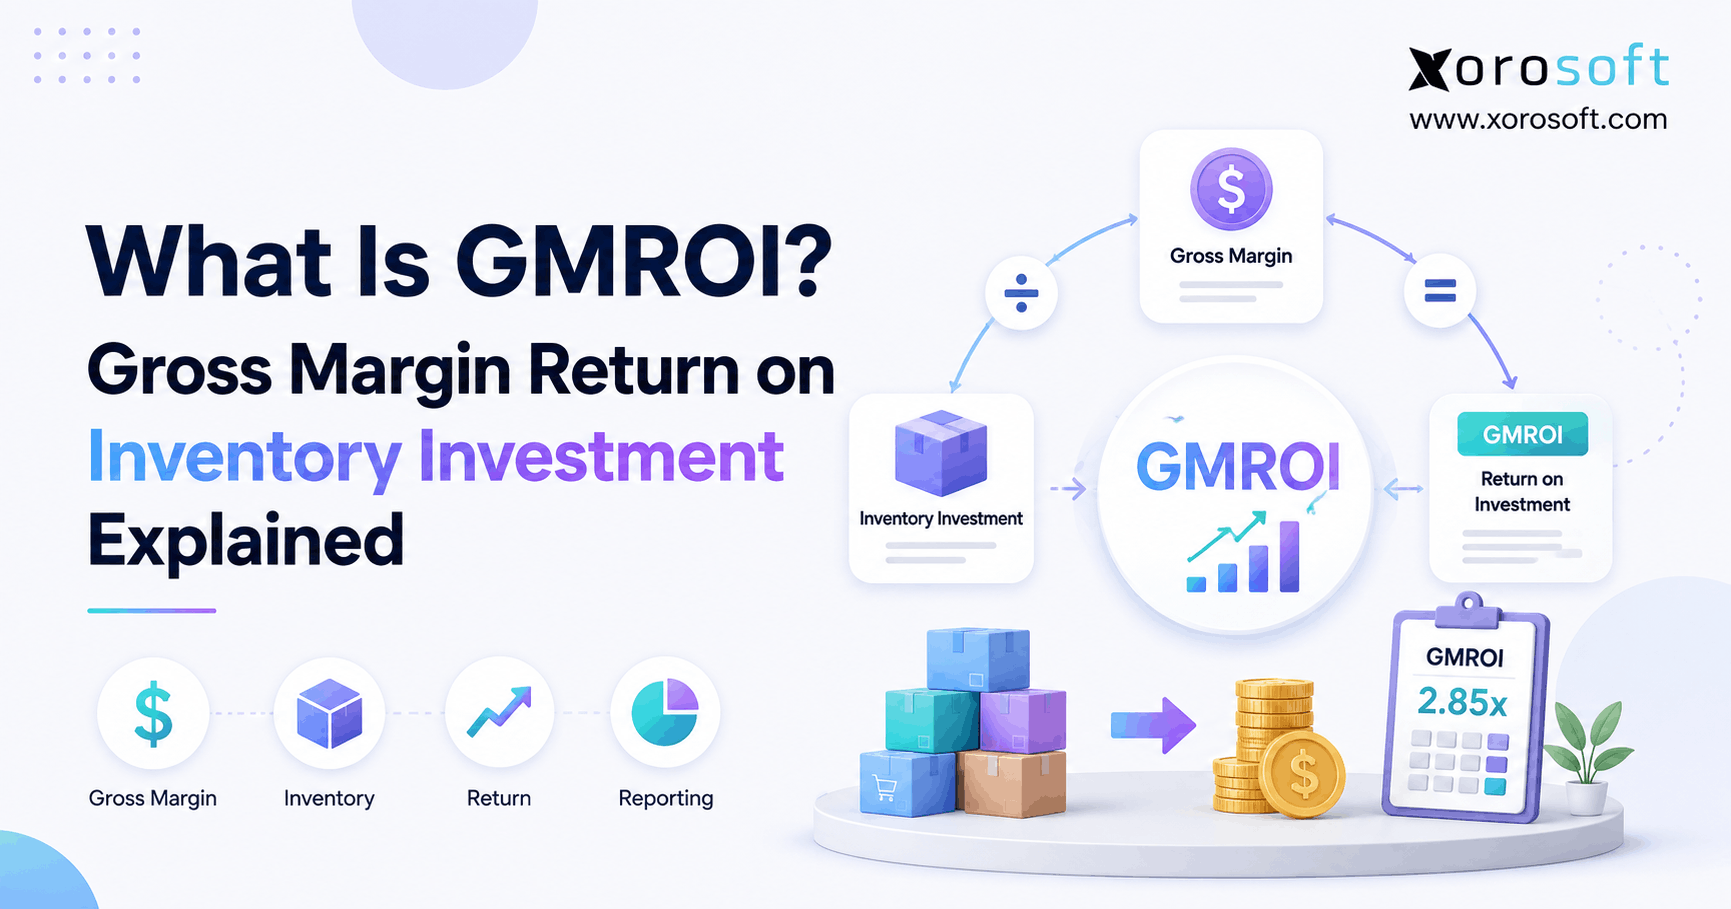
If you’re looking to improve retail profitability, understanding GMROI is essential.
1. Why Revenue Alone Can Hide an Inventory Problem
GMROI measures how efficiently inventory investment generates gross profit. Therefore, rather than looking only at how much a product sells, the metric asks a more important operational question: how much gross profit is the business earning from the money tied up in inventory?
For example, one product may generate impressive annual revenue while requiring a large stock position. Meanwhile, another product may generate less revenue while using far less inventory. Consequently, the second product can sometimes create a stronger return on working capital even though its headline sales are lower.
Moreover, inventory requires cash before it creates revenue. Therefore, every dollar committed to stock is capital that cannot simultaneously support marketing, payroll, product development, equipment, or other business priorities.
However, conventional sales reports rarely make this tradeoff obvious. Instead, they usually emphasize units sold, revenue, and gross margin. As a result, companies can continue investing heavily in products that appear successful while using inventory capital inefficiently.
That is why inventory profitability deserves its own measurement framework.
1.1 What Does GMROI Stand For?
GMROI stands for Gross Margin Return on Inventory Investment.
In practical terms, the ratio compares the gross profit produced during a period with the average amount invested in inventory during that same period.
Therefore, it connects merchandising and purchasing decisions with financial performance.
Moreover, businesses can analyze the metric at several levels, including:
- Entire company
- Product category
- Brand
- SKU
- Warehouse
- Store
- Sales channel
Consequently, operators can move beyond company-wide averages and identify where inventory capital performs well and where it becomes trapped.
1.2 Why Inventory-Driven Businesses Track It
This measure is especially useful for businesses that:
- Sell physical products
- Maintain substantial stock
- Manage large SKU catalogs
- Purchase ahead of demand
- Operate multiple warehouses
- Sell seasonal products
- Manage wholesale inventory
- Sell through ecommerce channels
- Experience markdown risk
- Need to balance margin and turnover
For example, an apparel company may need to compare the performance of different seasonal collections. Similarly, a wholesaler may need to understand which product families consume large amounts of working capital without producing adequate gross profit.
Therefore, the metric is useful across retail, ecommerce, wholesale, distribution, and many inventory-driven manufacturing environments.
1.3 Who May Not Need It as a Primary Metric?
However, businesses with little physical inventory may gain less value from this analysis.
For example, software companies, professional-services firms, and digital-product businesses generally have different working-capital structures.
Therefore, inventory return should be used where inventory itself represents a meaningful financial investment.
2. How the Inventory Return Formula Works
The standard GMROI formula is:
Gross Profit ÷ Average Inventory Cost
Therefore, the calculation requires two primary inputs:
- Gross profit
- Average inventory cost
The Shopify explanation of Gross Margin Return on Inventory Investment uses this same fundamental approach and provides additional retail context.
2.1 Calculating Gross Profit
Gross profit is:
Revenue − Cost of Goods Sold
For example, suppose a company generates:
- Revenue: $1,000,000
- Cost of goods sold: $600,000
Therefore:
Gross Profit = $400,000
Consequently, $400,000 becomes the numerator in the calculation.
However, revenue and COGS must relate to the same period. Otherwise, the resulting ratio may become misleading.
2.2 Calculating Average Inventory
A simple average inventory formula is:
(Beginning Inventory + Ending Inventory) ÷ 2
For example:
- Beginning inventory: $180,000
- Ending inventory: $220,000
Therefore:
Average Inventory = $200,000
However, this method works best when inventory levels remain relatively stable.
For seasonal businesses, stock may rise substantially before peak demand and then fall sharply afterward. Consequently, beginning and ending values alone may not accurately represent how much inventory the company carried throughout the year.
Instead, businesses can use monthly inventory balances. Moreover, high-volume operations may use weekly averages when their reporting systems provide reliable data.
2.3 Why Cost Basis Matters
Average inventory should generally be measured at cost.
Therefore, operators should avoid mixing retail selling prices with cost-based gross-profit figures.
For example, if inventory is valued at expected selling price while gross profit is calculated from acquisition cost, the numerator and denominator no longer use a consistent economic basis.
As a result, category comparisons and historical trends may become unreliable.
3. How to Calculate Inventory Profitability Step by Step
Although the mathematics are straightforward, reliable inputs matter more than the arithmetic.
3.1 Step 1: Select a Reporting Period
First, determine the period being analyzed.
Common options include:
- Monthly
- Quarterly
- Seasonal
- Annual
However, the reporting period should match the business decision.
For example, a fashion retailer may evaluate a spring collection separately. Meanwhile, a wholesaler may prefer quarterly and annual comparisons.
3.2 Step 2: Determine Revenue
Next, calculate product revenue during the selected period.
Assume:
Revenue = $1,000,000
3.3 Step 3: Determine Cost of Goods Sold
Then, calculate the cost associated with those sales.
Assume:
COGS = $600,000
3.4 Step 4: Calculate Gross Profit
Therefore:
$1,000,000 − $600,000 = $400,000
Gross profit equals:
$400,000
3.5 Step 5: Calculate Average Inventory
Suppose:
- Beginning inventory: $180,000
- Ending inventory: $220,000
Therefore:
($180,000 + $220,000) ÷ 2 = $200,000
Average inventory equals:
$200,000
3.6 Step 6: Calculate GMROI
Finally:
$400,000 ÷ $200,000 = 2.0
Therefore, the GMROI is 2.0.
In practical terms, the company generated $2 of gross profit for every $1 represented by average inventory investment during the period.
3.7 Complete Calculation Example
| Metric | Amount |
|---|---|
| Revenue | $1,000,000 |
| Cost of Goods Sold | $600,000 |
| Gross Profit | $400,000 |
| Beginning Inventory | $180,000 |
| Ending Inventory | $220,000 |
| Average Inventory | $200,000 |
| Inventory Return | 2.0 |
Therefore, the result provides a clear starting point for evaluating inventory productivity.
However, the ratio alone does not explain why performance is strong or weak. Consequently, operators should examine margin, inventory turnover, purchasing, and SKU performance next.
4. How to Interpret the Result Correctly
Inventory-return figures become useful only when management understands what they represent.
4.1 What Does a Result of 1 Mean?
A result of 1 means that the business generated $1 of gross profit for every $1 represented by average inventory investment.
However, this does not mean the company generated $1 of net profit.
Instead, operating expenses still need to be paid.
For example:
- Payroll
- Rent
- Marketing
- Warehouse expenses
- Software
- Insurance
- Administration
- Interest
Therefore, the ratio should not be confused with net profitability.
4.2 What Does a GMROI of 2 Mean?
A GMROI of 2 means the business generated $2 of gross profit for every $1 represented by average inventory during the measurement period.
Therefore, when equivalent accounting methods and comparable periods are used, a result of 2 generally represents stronger inventory productivity than a result of 1.
However, context still matters.
For example, one category may require longer supplier lead times or higher safety stock. Consequently, it may reasonably carry more inventory than another category.
4.3 What Does a Result Below 1 Mean?
A value below 1 indicates that gross profit was lower than average inventory investment during the selected period.
Therefore, operators should investigate potential causes such as:
- Overstock
- Weak margin
- Low turnover
- Excessive markdowns
- Poor forecasting
- Obsolete products
- Large purchase quantities
- Excess safety stock
However, the correct response is investigation rather than immediate discontinuation.
5. What Is a Good GMROI?
There is no universal good GMROI that applies to every business.
Although industry references sometimes discuss benchmark figures, the appropriate target depends on category economics, margin structure, inventory turnover, seasonality, supplier lead times, and operating model.
The Investopedia guide to GMROI also explains the measure and discusses commonly referenced retail benchmarks.
Therefore, businesses should avoid treating one generic figure as the definition of success.
5.1 Compare Similar Categories
First, compare products that have reasonably similar economics.
For example:
- T-shirts with other apparel products
- Sofas with similar furniture
- Running shoes with footwear
- Replacement parts with comparable parts
Otherwise, radically different margin and turnover characteristics can make the comparison misleading.
5.2 Compare Performance Over Time
Moreover, historical comparison is often highly actionable.
Suppose:
- Previous-year result: 1.8
- Current-year result: 2.2
Therefore, inventory productivity improved.
However, management should determine why.
For example, the improvement might result from:
- Better pricing
- Lower supplier costs
- Faster turnover
- Reduced inventory
- Better forecasting
- Fewer markdowns
Consequently, the metric should begin the investigation rather than end it.
6. Inventory Profitability vs. Inventory Turnover
Inventory profitability and turnover are related, but they answer different questions.
Inventory turnover asks:
How quickly does inventory sell and get replaced?
Inventory return asks:
How much gross profit does the inventory investment produce?
Therefore, the two measures are most useful when viewed together.
| Metric | Measures | Main Question |
| GMROI | Inventory profitability | How much gross profit does inventory investment generate? |
| Inventory Turnover | Inventory velocity | How quickly does stock move? |
| Gross Margin | Sales profitability | How much gross profit remains from sales? |
| Sell-Through | Product movement | How much available stock has sold? |
6.1 Fast Turnover Does Not Guarantee Strong Returns
For example, a deeply discounted product may sell rapidly.
Therefore, turnover may look excellent.
However, because discounting reduces gross profit, the inventory return may remain weak.
6.2 High Margin Does Not Guarantee Strong Returns Either
Conversely, a product may have an attractive gross-margin percentage.
However, if the business holds excessive quantities, average inventory rises.
Consequently, the capital efficiency of that product can remain poor.
Therefore, margin and turnover should always be considered together.
7. What Usually Reduces Inventory Profitability?
Weak inventory returns often originate in operational decisions made months before the issue becomes visible in reporting.
7.1 Overstock
First, excess inventory increases average stock investment.
Therefore, if gross profit does not rise proportionately, the return deteriorates.
For example, carrying six months of supply when three months would provide adequate availability can tie up substantial working capital unnecessarily.
7.2 Weak Forecasting
Moreover, inaccurate demand forecasts frequently create excessive purchasing.
When expected demand does not materialize, products remain in stock longer.
Consequently:
- Inventory ages
- Cash stays tied up
- Storage requirements rise
- Markdown risk increases
- Obsolescence becomes more likely
Therefore, better forecasting can directly support stronger inventory economics.
7.3 Slow-Moving Products
Similarly, slow-moving SKUs consume warehouse space and capital for long periods.
Moreover, these products may eventually require promotional discounts.
As a result, a category that looks healthy at the revenue level can still contain products that weaken overall returns.
7.4 Excessive Discounting
Discounts can increase sales velocity.
However, promotions also reduce gross profit per unit.
Therefore, operators should evaluate both movement and margin before deciding whether a promotion improved performance.
7.5 Inefficient Purchasing
Large supplier discounts can encourage buyers to purchase more stock than necessary.
However, a lower unit price does not automatically create better economics.
Instead, buyers should consider:
- Demand
- Supplier lead time
- Minimum order quantity
- Current stock
- Incoming purchase orders
- Storage requirements
- Markdown risk
- Obsolescence risk
Consequently, purchasing decisions should account for inventory productivity as well as purchase price.
8. How to Improve Inventory Returns Without Creating Stockouts
Improving GMROI generally requires increasing gross profit, reducing unnecessary inventory investment, or accomplishing both.
However, operators should avoid cutting stock indiscriminately.
8.1 Improve Demand Forecasting
First, stronger forecasting helps teams distinguish repeatable demand from temporary spikes.
Therefore, businesses can reduce unnecessary stock without blindly increasing stockout risk.
Moreover, stronger forecasts can improve:
- Purchase quantities
- Reorder timing
- Safety-stock decisions
- Seasonal planning
8.2 Improve Replenishment
Next, replenishment rules should incorporate:
- Sales velocity
- Supplier lead time
- Safety stock
- Available inventory
- Incoming inventory
- Minimum order quantities
- Seasonality
Consequently, businesses can maintain availability while reducing unnecessary inventory.
8.3 Review Weak SKUs
Moreover, SKU-level analysis can reveal products that repeatedly consume capital without producing an adequate return.
Therefore, operators can decide whether to:
- Reduce purchase quantities
- Pause replenishment
- Renegotiate supplier costs
- Adjust pricing
- Promote aged stock
- Bundle products
- Discontinue selected SKUs
However, businesses should also consider the strategic role of each product.
For example, a low-return product may support a larger customer relationship or complete an important assortment.
8.4 Connect Purchasing With Inventory Visibility
As operations grow, buyers need accurate information before placing purchase orders.
For example, they need visibility into:
- Available inventory
- Committed stock
- Sales velocity
- Open purchase orders
- Supplier lead times
- Warehouse demand
Therefore, an integrated platform such as XoroONE can become relevant when inventory, purchasing, accounting, forecasting, and operational information need to work within one environment rather than separate spreadsheets.
9. Measuring Inventory Returns by SKU, Category, and Warehouse
Company-wide GMROI gives management a useful headline.
However, averages can hide serious product-level problems.
9.1 Compare Products at SKU Level
Consider two products:
| Metric | Product A | Product B |
| Revenue | $500,000 | $350,000 |
| Gross Margin | 40% | 50% |
| Gross Profit | $200,000 | $175,000 |
| Average Inventory | $150,000 | $50,000 |
| Return Ratio | 1.33 | 3.50 |
Product A generates more revenue.
However, Product B generates substantially more gross profit relative to inventory investment.
Therefore, revenue alone would lead to an incomplete conclusion.
9.2 Analyze Categories Separately
Similarly, category analysis can reveal which groups deserve more inventory capital.
For example, operators can compare:
- Apparel collections
- Footwear ranges
- Furniture categories
- Sporting-goods groups
- Consumer-product families
Consequently, purchasing budgets can be allocated more intelligently.
9.3 Analyze Inventory by Warehouse
Moreover, multi-location companies should determine where inventory actually sits.
For example, one warehouse may experience repeated stockouts while another holds months of surplus.
Therefore, a connected warehouse management system can provide better location-level visibility before teams make replenishment or transfer decisions.
As a result, operators can assess inventory productivity at the location level rather than relying solely on network-wide averages.
10. Inventory Profitability for Shopify and Multi-Channel Ecommerce
Ecommerce businesses often have excellent sales data but fragmented operating data.
For example, information may be spread across:
- Shopify
- Amazon
- Accounting software
- Warehouse systems
- Purchasing spreadsheets
- Returns tools
- EDI applications
Consequently, reliable GMROI analysis becomes more difficult as channel complexity grows.
10.1 Shopify Revenue Is Only One Input
Shopify can show what customers bought.
However, inventory profitability also depends on:
- Inventory cost
- Purchase receipts
- Cost of goods sold
- Returns
- Discounts
- Warehouse balances
- Transfers
Therefore, sales reporting by itself cannot provide the complete picture.
10.2 Why Connected Ecommerce Data Matters
Moreover, duplicate entry creates opportunities for operational and accounting records to diverge.
As a result, businesses may spend considerable time reconciling systems before they can trust their inventory analysis.
Therefore, Xorosoft integrations can become relevant for businesses that need Shopify, Amazon, EDI, payments, accounting, and operational workflows to communicate more consistently.
In addition, ecommerce operators can review Xorosoft’s listing in the Shopify App Store when evaluating how ERP and Shopify workflows can connect.
11. How Inventory Returns Vary Across Industries
The same metric can support many inventory-driven sectors.
However, the appropriate interpretation varies considerably.
11.1 Apparel and Fashion
Apparel businesses often manage:
- Seasonal collections
- Color variations
- Size variations
- Short product lifecycles
- Markdown risk
Therefore, SKU-level GMROI analysis can help expose items that consume excessive capital.
11.2 Furniture
Furniture companies often face:
- High unit costs
- Larger storage requirements
- Long supplier lead times
- Slower stock movement
Consequently, expected inventory economics can differ significantly from fast-moving consumer goods.
11.3 Sporting Goods
Sporting-goods businesses can experience strong seasonality.
Therefore, monthly or seasonal comparisons can often provide better insight than a single annual snapshot.
11.4 Food and Beverage
Food companies face additional shelf-life and expiration considerations.
Consequently, excessive purchasing can create both weak inventory returns and waste.
11.5 Wholesale Distribution
Wholesalers frequently manage broad catalogs and customer-specific pricing.
Therefore, SKU and category analysis can identify products that generate substantial revenue but consume too much working capital.
Businesses evaluating broader process improvements can explore Xorosoft’s business solutions for inventory-driven operations.
11.6 Manufacturing
Manufacturers have additional complexity because inventory can exist as:
- Raw materials
- Work in process
- Finished goods
Therefore, GMROI is often easiest to interpret at the finished-goods level.
However, production planning, BOM requirements, material availability, and capacity constraints must also be considered.
12. Common Calculation Mistakes That Distort the Result
The mathematics are simple.
However, inconsistent data can still produce misleading results.
12.1 Mixing Cost and Retail Values
First, businesses should avoid using selling prices for average inventory while calculating gross profit from cost.
Instead, the cost basis should remain consistent.
12.2 Using Only Beginning and Ending Inventory
Moreover, two inventory snapshots may be insufficient for highly seasonal companies.
Therefore, monthly or more frequent averages may provide a more representative figure.
12.3 Comparing Unrelated Categories
Similarly, products with radically different margin structures should not automatically share the same target.
Therefore, compare similar categories wherever possible.
12.4 Ignoring Returns
Returns can affect:
- Revenue
- Available inventory
- Stock position
- Gross profit
Consequently, companies with meaningful return rates should ensure their reporting treats returns consistently.
12.5 Ignoring Markdowns
Moreover, markdowns can accelerate turnover while reducing margin.
Therefore, faster unit movement does not necessarily improve GMROI.
12.6 Using the Metric in Isolation
Finally, inventory return does not explain the complete health of an operation.
Instead, businesses should review it alongside:
- Inventory turnover
- Gross margin
- Sell-through
- Weeks of supply
- Aged inventory
- Stockout rate
- Forecast accuracy
- Service level
Consequently, management receives a more balanced view of both profitability and availability.
13. How Purchasing Decisions Affect Inventory Return
Purchasing teams have a direct influence on inventory productivity.
Therefore, buyers should consider more than unit cost when placing purchase orders.
13.1 Buying Too Early
Suppose a supplier requires eight weeks of lead time.
However, the buyer routinely orders six months before the inventory is required.
Consequently, cash remains tied up much longer than necessary.
Therefore, even when the products eventually sell, excessive early purchasing can weaken GMROI.
13.2 Buying Too Much
Similarly, volume discounts can look attractive.
However, purchasing twice the needed quantity to achieve a small unit-cost reduction can create:
- Higher average inventory
- More storage requirements
- Greater aging risk
- Additional markdown exposure
Therefore, the lower purchase price should be weighed against working-capital consequences.
13.3 Supplier Lead Times Matter
Moreover, unreliable supplier lead times can force teams to carry additional protection stock.
Therefore, supplier performance should be considered when evaluating inventory productivity.
As operations become more complex, companies may need purchasing workflows that connect directly to inventory data. Xorosoft’s XoroERP supports inventory-driven businesses that need purchasing, accounting, warehouse, and operational processes to work within a connected ERP environment.
14. Frequently Asked Questions About Inventory Profitability
14.1 What Is GMROI?
GMROI stands for Gross Margin Return on Inventory Investment. Therefore, it measures the amount of gross profit generated relative to average inventory cost. For example, a ratio of 2 means the business generated $2 in gross profit for every $1 represented by average inventory investment during the measurement period.
14.2 What Does GMROI Stand For?
The acronym means Gross Margin Return on Inventory Investment. Moreover, retailers and other inventory-driven businesses use it to evaluate how effectively working capital invested in stock produces gross profit.
14.3 What Is the GMROI Formula?
The GMROI formula is gross profit divided by average inventory cost. Therefore, a business must first determine gross profit for the reporting period and then calculate the average value of inventory held during the same period.
14.4 What Is a Good GMROI?
There is no universal target. Instead, an appropriate result depends on industry, category, gross margin, stock velocity, seasonality, and supplier requirements. Therefore, historical comparisons and similar product groups are often more useful than one generic benchmark.
14.5 What Does a GMROI of 2 Mean?
A GMROI of 2 means the business generated $2 of gross profit for every $1 represented by average inventory investment. Therefore, when the same calculation method is used, it generally indicates stronger inventory productivity than a result of 1.
14.6 What Does a Result Below 1 Mean?
A result below 1 means gross profit was lower than average inventory investment for the selected period. Consequently, the business should investigate overstock, slow turnover, pricing, markdowns, supplier costs, and forecasting.
14.7 Is a Higher Ratio Always Better?
Generally, a higher ratio indicates stronger inventory productivity. However, businesses should not reduce stock purely to improve the calculation. Otherwise, persistent stockouts and lost sales may damage total profitability.
14.8 How Is Average Inventory Calculated?
A basic calculation adds beginning and ending inventory and divides the result by two. However, seasonal businesses should consider monthly or weekly balances because two snapshots may not represent average stock accurately.
14.9 Should Inventory Be Valued at Cost?
Generally, yes. Therefore, average inventory should normally use a consistent cost basis that aligns with gross-profit calculations. Otherwise, the resulting comparison may become distorted.
14.10 How Is This Different From Inventory Turnover?
Inventory turnover measures how quickly inventory sells and is replaced. In contrast, GMROI measures the gross profit produced relative to inventory investment. Therefore, one measures velocity while the other emphasizes profitability.
14.11 How Is This Different From Gross Margin?
Gross margin measures gross profit relative to revenue. However, inventory return measures gross profit relative to average inventory. Consequently, two products with similar margins can have very different inventory economics.
14.12 Is It the Same as ROI?
No. ROI is a broad measure that can apply to many kinds of investments. In contrast, this calculation focuses specifically on inventory and gross profit.
14.13 How Is It Different From Sell-Through?
Sell-through measures how much inventory sells during a period. However, it does not directly incorporate gross profit. Therefore, a heavily discounted item can achieve strong sell-through while producing a weaker inventory return.
14.14 How Can a Business Improve GMROI?
A company can improve GMROI by raising gross profit, reducing unnecessary inventory, improving forecasts, optimizing replenishment, reviewing low-performing SKUs, and improving purchasing decisions. However, any inventory reduction should still protect appropriate product availability.
14.15 Does Overstock Reduce Inventory Profitability?
Usually, yes. Overstock raises average inventory investment. Therefore, when gross profit does not increase proportionately, the resulting return becomes weaker.
14.16 Does Discounting Affect Inventory Return?
Yes. Discounting lowers gross profit per unit. However, it may also accelerate stock movement. Therefore, the final impact depends on whether faster turnover compensates for the lost margin.
14.17 Can Inventory Profitability Be Calculated by SKU?
Yes. In fact, SKU-level analysis can expose products that use disproportionate working capital. However, operators should also consider each item’s strategic role before reducing or discontinuing it.
14.18 Can Inventory Returns Be Measured by Category?
Yes. Moreover, category-level analysis often produces more meaningful comparisons because similar products tend to share more comparable margin and turnover characteristics.
14.19 Can Inventory Profitability Be Measured by Warehouse?
Yes, provided the business can allocate inventory and profitability information reliably. Therefore, warehouse-level reporting can reveal regional overstock, stock imbalances, and transfer opportunities.
14.20 How Often Should This Inventory Metric Be Reviewed?
Monthly or quarterly analysis works for many businesses. However, seasonal companies may need more frequent reviews during key buying periods. Therefore, review frequency should reflect the speed of purchasing and replenishment decisions.
14.21 Is This Metric Useful for Ecommerce Businesses?
Yes. Ecommerce companies still invest working capital in physical inventory. Therefore, Shopify, Amazon, and multi-channel operators can use the measure to evaluate whether their stock is producing sufficient gross profit.
14.22 Can Wholesale Distributors Use This Profitability Metric?
Yes. Wholesalers often manage broad catalogs and significant stock positions. Consequently, inventory-return analysis can help identify categories that consume capital for long periods without generating adequate margin.
14.23 Is It Useful for Manufacturing?
It can be. However, manufacturing introduces raw materials, work in process, production constraints, and finished goods. Therefore, the calculation is usually easier to interpret at the finished-goods level.
14.24 Can ERP Software Support Inventory Profitability Analysis?
Yes. The calculation itself is simple. However, ERP can improve access to the underlying inventory, purchasing, warehouse, ecommerce, and accounting data required for reliable analysis.
14.25 Which Other Metrics Should Be Used Alongside It?
Businesses should also monitor inventory turnover, sell-through, gross margin, weeks of supply, aged inventory, forecast accuracy, stockout rate, and service level. Consequently, management can balance capital efficiency with customer availability.
15. Turn Inventory Profitability Into an Operating Decision
Ultimately, GMROI matters because it changes how operators evaluate inventory.
Instead of asking only:
“How much did this product sell?”
management can also ask:
“How much gross profit did our inventory investment generate?”
Therefore, revenue growth alone is not enough.
For example, a business can increase revenue while simultaneously:
- Carrying excessive inventory
- Increasing working-capital requirements
- Creating markdown exposure
- Slowing inventory turnover
- Accumulating weak SKUs
Consequently, strong inventory management requires a balance between sales, profitability, availability, and capital efficiency.
Moreover, GMROI becomes more actionable when businesses analyze it across products, categories, warehouses, and reporting periods.
As a result, the metric can inform:
- Purchasing
- Demand forecasting
- Replenishment
- Pricing
- Assortment planning
- Inventory transfers
- Supplier negotiations
However, reliable analysis depends on reliable data.
As companies add Shopify, Amazon, wholesale customers, multiple warehouses, purchasing teams, and accounting complexity, disconnected applications can make inventory reporting increasingly difficult.
Therefore, businesses that have outgrown spreadsheets and standalone inventory tools may benefit from an integrated ERP approach.
Xorosoft brings inventory management, accounting, purchasing, warehouse operations, forecasting, ecommerce workflows, and reporting into a connected cloud environment. Moreover, businesses evaluating this type of operational change can review relevant Xorosoft customer case studies to see how inventory-driven companies approach broader systems challenges.
Ultimately, the goal is not simply to maximize GMROI.
Instead, the goal is to invest the right amount of capital in the right products, at the right locations, while maintaining sufficient availability and producing healthy gross profit.
If your team spends more time reconciling inventory information than acting on it, Book a Demo to see how Xorosoft can support a more connected inventory operation.
Recent Posts
-
 Best AI Warehouse Management Software for ERP Inventory and Warehouse Operations
 -
 Project Based ERP Software for Managing Project Costs, Purchasing, Resources, Inventory, and Accounting
 -
 Food and Beverage ERP Requirements for Lot, Expiry, and Recall Control
 -
 How to Prevent EDI Errors Before They Become Retailer Chargebacks
 -
 Warehouse Injury and Safety Statistics: What Operations Teams Should Know Before Automating Workflows