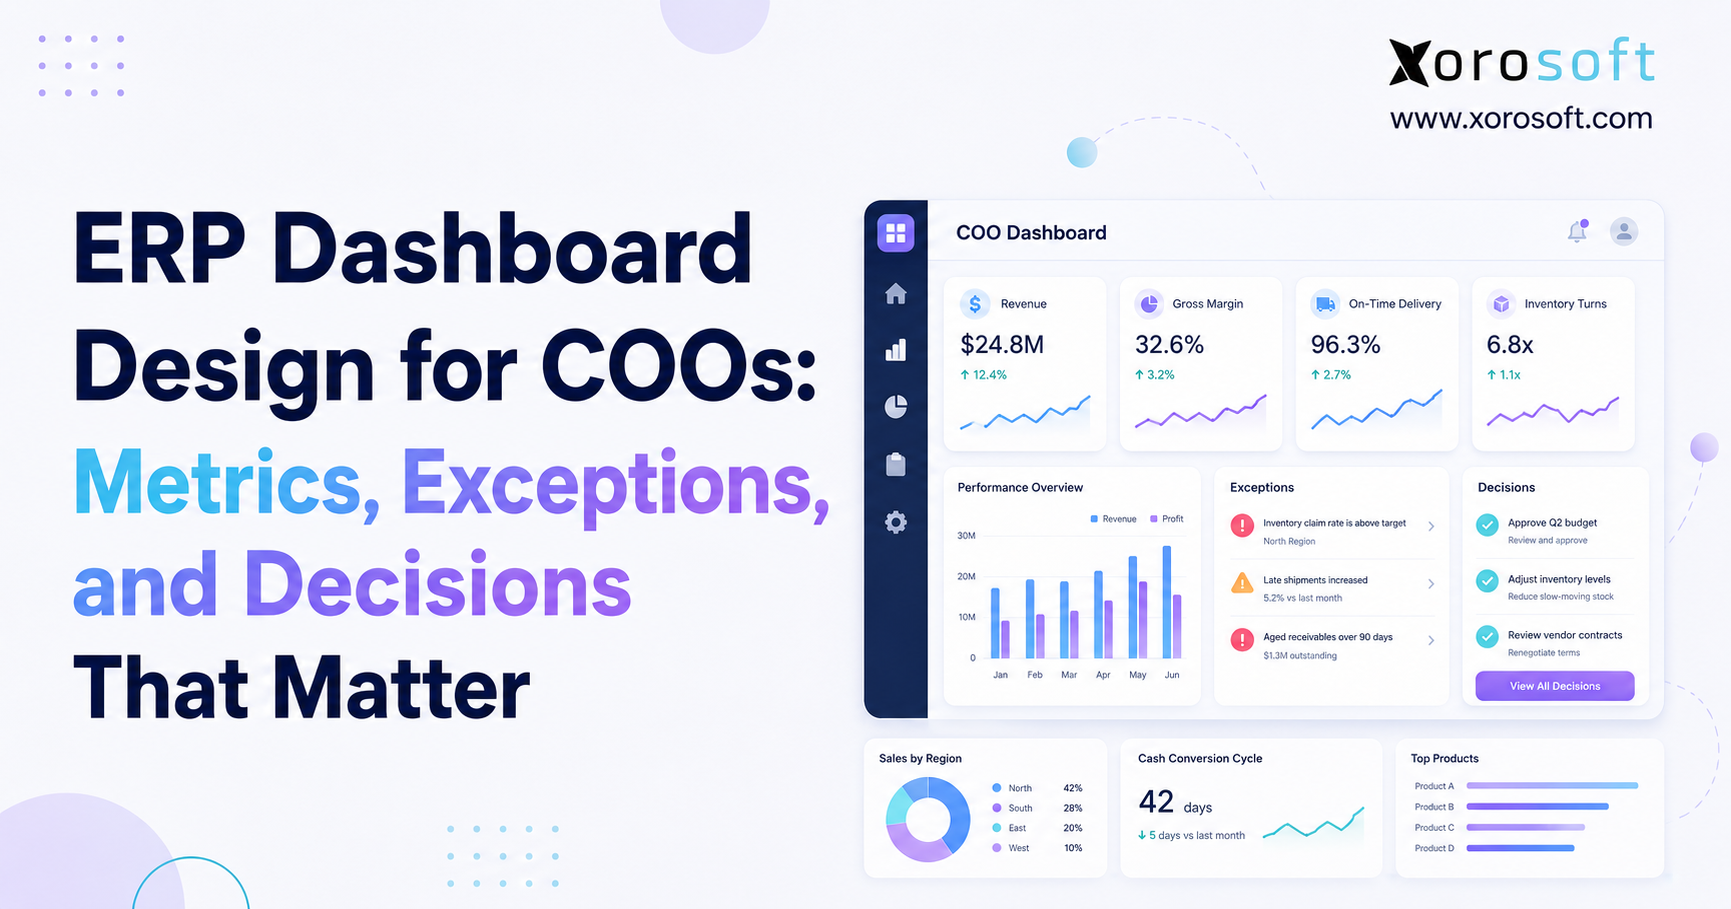
When creating effective ERP dashboard design, it’s important to focus on usability and clarity for end users.
1. Why COO Dashboards Often Show Too Much and Explain Too Little
The challenge facing most COOs is not a lack of data. Growing companies already generate enormous amounts of information across inventory, sales orders, purchasing, warehouses, accounting, manufacturing, ecommerce, and supplier activity. The difficult part is determining which information deserves executive attention.
A dashboard can contain dozens of charts and still fail to answer the most important operational question: Where does management need to intervene?
This is where effective ERP dashboard design becomes different from ordinary reporting. The goal is not to put every available number on one screen. The goal is to help a COO recognize abnormal conditions quickly, understand their business impact, and move toward a decision.
For example, knowing that 5,000 customer orders are open provides context, but it does not identify risk. A COO gains more value from knowing that 62 orders are already late, 24 are blocked by inventory shortages, eight involve strategic customers, and a specific supplier delay is responsible for most of the exposure.
That is actionable visibility.
As companies grow across multiple warehouses, sales channels, suppliers, and operating teams, separate departmental reports become less useful at executive level. A warehouse problem may start with purchasing. A fulfillment problem may result from inventory allocation. A margin problem may come from expedited freight or production inefficiency.
The COO dashboard must connect those relationships rather than display departments in isolation.
2. ERP Dashboard Design Should Begin With Decisions, Not Available Metrics
Many dashboard projects begin by asking what the ERP can display. That approach usually produces crowded screens because every department can suggest another useful metric.
A stronger approach starts with a different question: What decisions does the COO repeatedly need to make?
Once those decisions are understood, the right KPIs become much easier to select. This keeps the dashboard focused on management activity rather than software capability.
2.1 The Metric-to-Decision Framework for ERP Dashboard Design
A practical framework is:
Metric → Target → Variance → Exception → Owner → Decision
The metric defines what the company is measuring, while the target establishes acceptable performance. Variance shows how far actual results have moved from that target. An exception rule then determines when the difference becomes important enough to require attention. Ownership creates accountability, and the final step connects the issue to a management decision.
Consider supplier on-time delivery. If a key supplier’s performance falls from 96% to 84%, simply turning a KPI card red does not tell management enough.
A stronger dashboard should identify the affected purchase orders, show which inventory or customer commitments are at risk, assign the issue to purchasing, and support decisions such as expediting supply, transferring inventory, rescheduling demand, or changing supplier allocation.
2.2 Leading Indicators Strengthen a COO ERP Dashboard
Lagging indicators describe what has already happened. Missed deliveries, lost sales, margin erosion, excess inventory, and late production are useful for reviewing performance, but they provide limited opportunity to prevent the outcome.
Leading indicators provide earlier warning.
A purchase order that is approaching its required date without confirmation may indicate future supply risk. Warehouse backlog growing faster than shipping capacity may signal tomorrow’s fulfillment problem. Projected inventory dropping below committed demand may expose a stockout before it happens.
A good COO ERP dashboard therefore combines outcomes with early-warning signals.
2.3 Executive Metrics Need Context
A KPI without context creates interpretation work for the executive.
Management should be able to understand the current result, expected level, recent trend, threshold, responsible owner, and underlying cause when further investigation is required.
Not all of this information needs to appear at once. However, the dashboard should make it easy to move from the summary metric into the supporting operational detail.
3. ERP Dashboard Design Works Better When Exceptions Take Priority
Most business activity is normal. Normal activity rarely requires a COO’s direct involvement.
That makes exception management one of the strongest principles behind effective ERP dashboard design.
A company might successfully process thousands of warehouse movements, invoices, purchase receipts, production transactions, and sales orders every day. Showing all of them to an executive creates noise.
The dashboard should instead highlight the small percentage of conditions that fall outside acceptable operating parameters.
3.1 What Exception Management Means in an ERP KPI Dashboard
Exception management identifies transactions, trends, or KPIs that move outside predefined tolerances and routes those conditions to the appropriate person for investigation.
The goal is not to create an alert every time a number changes. Strong exception logic considers the severity, financial impact, customer impact, duration, recurrence, and available response.
A low-value item falling below its target quantity may require no executive attention. A top-selling product expected to stock out tomorrow while hundreds of customer orders remain open is different.
Both conditions are technically inventory exceptions. Their business significance is not equal.
3.2 Inventory Exceptions That Deserve COO Attention
Inventory exceptions become important when they affect working capital, customer service, or operating reliability.
Management may need visibility into projected stockouts, unusually high inventory adjustments, persistent negative inventory, excess stock, slow-moving products, location imbalances, or declining inventory accuracy.
The dashboard should connect each condition to consequences.
For instance, excess inventory should show the value of cash tied up, the products responsible, the locations holding the stock, and whether open purchase orders will make the situation worse.
That is more useful than a generic “overstock” alert.
3.3 Fulfillment and Purchasing Exceptions in an Executive ERP Dashboard
Fulfillment exceptions may include overdue orders, backorders, partial shipments, unallocated demand, unusually long order cycle times, or high-value customer orders approaching their promised date.
Purchasing exceptions should focus on supply risks that threaten future execution. Late purchase orders, supplier confirmation delays, unexpected price increases, and incoming stock that no longer aligns with demand can all justify attention.
Context remains essential.
A PO that is two days late may be irrelevant when weeks of stock remain available. The same delay can become urgent when customer orders are already waiting.
4. ERP KPI Dashboard Design Needs a Clear Information Hierarchy
A COO usually needs fewer metrics than the operational teams reporting into the role.
That does not mean detailed metrics are unnecessary. It means they should sit at the right reporting level.
Effective ERP dashboard design separates executive health indicators from functional analysis and transaction-level detail.
4.1 Level One: Executive ERP Dashboard Metrics
The first screen should answer whether the operation is healthy and where executive attention is needed.
Depending on the business, this may include fill rate, inventory turnover, inventory value, on-time delivery, gross margin, warehouse backlog, purchasing exceptions, production attainment, and working-capital indicators.
There is no universal perfect number of KPIs. However, roughly eight to twelve high-value measures often provide enough context without overwhelming the screen.
Every metric should earn its position by supporting an actual management decision.
4.2 Level Two: Functional ERP Analytics
The second level explains the executive signal.
If inventory turnover is declining, management may need to examine performance by product family, warehouse, category, or inventory class.
If fill rate falls, the executive should be able to determine whether the change came from a particular warehouse, sales channel, product group, or customer segment.
This is where an ERP analytics dashboard becomes more detailed without cluttering the first screen.
4.3 Level Three: Transaction-Level Drill-Down
The final level should connect the metric to actual transactions.
A fulfillment issue may ultimately lead to specific sales orders, SKUs, purchase orders, transfers, or warehouse tasks.
Without transaction-level drill-down, executives can identify symptoms but still need another report or spreadsheet before understanding the cause.
That delay weakens the dashboard’s value.
5. Inventory Metrics Are Central to ERP Dashboard Design for Product Businesses
Inventory is often one of the largest operating assets in an inventory-driven company. It is also an area where optimizing one department can create problems elsewhere.
Purchasing can improve availability by ordering more stock, but that decision may increase working-capital requirements. Finance can push inventory lower, but aggressive reductions may produce stockouts. Warehouses can become congested when stock exceeds planned capacity.
A useful COO dashboard makes those tradeoffs visible.
5.1 Inventory Turnover and Days Inventory
Inventory turnover shows how efficiently inventory investment converts into sales or consumption. A common formula divides cost of goods sold by average inventory.
At executive level, the company-wide number should be treated as a starting point rather than a complete answer.
Turnover often needs to be reviewed by product family, warehouse, season, or inventory class. A healthy company average can hide slow-moving products that are tying up cash while high-demand items repeatedly stock out.
Days inventory provides another perspective by translating inventory coverage into time.
Neither metric should be evaluated in isolation. High turnover is not automatically desirable when service levels are deteriorating.
5.2 Inventory Accuracy and Available-to-Promise Visibility
Inventory accuracy matters because almost every downstream decision depends on it.
When physical inventory and ERP inventory disagree, purchasing teams may reorder unnecessarily. Customer-service teams may promise stock that does not exist. Warehouse staff may waste labor searching for items, while accounting teams spend more time reconciling adjustments.
Strong ERP dashboard design should therefore distinguish between physical quantity, committed stock, available quantity, incoming supply, and projected availability when those concepts matter to the business.
The COO needs to know not only how much inventory exists but how much can actually support new demand.
5.3 Excess Inventory, Stockouts, and Warehouse Imbalance
Excess inventory and stockouts should be evaluated together.
A company can have too much inventory overall while still experiencing frequent shortages because the wrong products or locations hold the available stock.
This becomes especially important in multi-warehouse operations. A product may be heavily overstocked in one facility while another warehouse cannot satisfy customer orders.
A dashboard that exposes those imbalances can support transfer decisions before additional purchasing becomes necessary.
6. Fulfillment Metrics Should Show Which Customer Commitments Are at Risk
COOs do not need to review every order that moves normally through fulfillment. They need to understand whether customer promises are being met and where service risk is increasing.
An effective operational KPI dashboard therefore emphasizes service outcomes and the exceptions behind them.
6.1 Fill Rate and On-Time Delivery in ERP Dashboard Design
Fill rate indicates how much customer demand the business fulfills as expected. On-time delivery shows whether orders meet promised delivery commitments.
The two measures should remain separate.
A company can ship every item eventually while routinely shipping late. Another company may ship on time while frequently sending incomplete orders.
Both situations create customer-service problems, but they require different operational responses.
The executive dashboard should also reflect commercial impact. Missing a low-value routine order does not carry the same consequence as delaying an important wholesale account or high-margin customer order.
6.2 Order Cycle Time and Backorder Exposure
Order cycle time can reveal whether fulfillment is slowing.
However, a single average may hide severe exceptions. One hundred orders processed quickly can make the average appear healthy even while several strategic orders remain stuck for days.
A stronger dashboard combines overall trends with aging and exception views.
Backorders should also be presented in business terms. Instead of showing only the number of backordered order lines, management should understand affected customers, revenue value, product, age, cause, and likely resolution date.
7. Purchasing KPIs Should Connect Supplier Performance With Future Demand
Purchasing departments can track dozens of measures, but a COO needs a more selective view.
Supplier performance becomes strategically important when it changes the company’s ability to meet future customer demand.
7.1 Supplier Reliability and Lead-Time Variance
Supplier on-time delivery can reveal reliability problems, while lead-time variance shows whether supplier performance is becoming unpredictable.
The variance can be as important as the average.
A supplier that reliably delivers in 30 days can be easier to plan around than one averaging 30 days but frequently ranging between 18 and 55 days.
For the COO, the important question is how that variability changes inventory exposure and customer-service risk.
7.2 Open Purchase Orders and Future Cash Commitments
COOs also need visibility into future commitments represented by open purchase orders.
A purchasing plan created months earlier may no longer reflect current demand. If sales slow, the business may continue receiving inventory that no longer deserves the same investment.
Meanwhile, other products can remain understocked.
Effective ERP dashboard design for COOs connects open POs with demand, projected stock, supplier performance, and cash exposure rather than treating purchasing as a separate reporting silo.
8. Warehouse ERP Dashboard Design Should Focus on Throughput and Reliability
Warehouse systems generate highly detailed operational data. Pick rates, scans, replenishment tasks, receiving activity, packing times, labor productivity, and many other measures can all be valuable to warehouse managers.
They do not all belong on the COO’s primary dashboard.
The executive perspective should focus on whether the warehouse is processing demand quickly enough, accurately enough, and with enough capacity to support upcoming volume.
8.1 Warehouse Throughput and Backlog
A backlog becomes meaningful when incoming workload consistently exceeds the operation’s ability to complete it.
The raw count alone can be misleading.
Five hundred pending orders might be completely normal at noon and highly concerning at the end of the shipping day. Management therefore needs trend, age, workload, and service-deadline context.
The executive dashboard should reveal whether the backlog is temporary or whether the operation is moving toward a capacity problem.
8.2 Warehouse Accuracy and Inventory Integrity
Picking and receiving accuracy affect both customers and system inventory.
Repeated errors can create returns, incorrect stock records, additional reconciliation, and wasted labor.
When warehouse execution becomes complex, Xorosoft’s warehouse management system can provide a reference point for how receiving, scanning, picking, packing, shipping, and inventory activity can connect to broader ERP processes.
The COO dashboard should summarize operational impact rather than reproduce every WMS metric.
9. Manufacturing ERP Dashboard Design Should Surface Constraints Early
Manufacturers require another layer of visibility because fulfillment depends on more than finished-goods inventory.
Material availability, production capacity, work-order execution, and production schedules can all affect whether customer demand is fulfilled on time.
9.1 Production Schedule Attainment
Production schedule attainment helps management understand whether planned production is actually being completed.
When performance deteriorates, the COO should be able to investigate the operational cause.
Potential drivers include material shortages, labor constraints, machine availability, sequencing problems, inaccurate standards, or quality issues.
A percentage alone does not provide enough guidance.
The dashboard should connect schedule performance to affected products, work orders, work centers, materials, and customer demand.
9.2 Material Availability and Manufacturing Exceptions
Material shortages often reveal how closely manufacturing, purchasing, and inventory planning need to work together.
If a work order is delayed because a component is unavailable, management should be able to identify the material, supplier, purchase order, expected receipt, and customer orders that may ultimately be affected.
This cross-functional visibility is one of the major strengths of integrated ERP reporting dashboards compared with separate departmental spreadsheets.
10. Financial Metrics Give COO ERP Dashboards Business Context
A COO dashboard should not become a finance dashboard. However, operational performance eventually becomes financial performance.
A company can improve fill rate by carrying substantially more inventory. It can maintain delivery performance through expensive expedited freight. A factory can increase output while creating excessive scrap.
Operational improvements are meaningful only when management understands the economic consequences.
10.1 Gross Margin and Operational Drivers
Gross margin helps reveal whether operational decisions are supporting profitability.
When margin deteriorates, management should investigate the drivers rather than assuming price or product mix is responsible.
Purchasing costs, freight, warehouse inefficiency, inventory adjustments, production problems, discounts, and product returns may all contribute.
An executive dashboard that supports drill-down from financial variance into operational activity creates more useful conversations between the COO and CFO.
10.2 Inventory Value and Working Capital
Inventory value should be considered alongside service levels.
Reducing inventory may improve working capital, but only if customer availability remains acceptable.
Likewise, increasing inventory may support service while creating unnecessary cash pressure if purchasing significantly exceeds demand.
A strong executive ERP dashboard gives management enough financial context to evaluate both sides of the tradeoff.
11. Real-Time ERP Dashboard Design Should Match Data Speed With Decision Speed
Real-time reporting is frequently treated as an automatic improvement.
It is useful only when the business can act on the information at approximately the same speed.
Inventory availability, ecommerce orders, warehouse congestion, fulfillment exceptions, and production interruptions may justify frequent updates because the underlying conditions change rapidly.
Other metrics do not.
Monthly inventory turnover, DSO, long-term supplier performance, and gross-margin trends do not become materially more valuable because they refresh every few seconds.
11.1 Match Refresh Frequency to Operational Use
Every KPI should have a refresh frequency based on how quickly the underlying condition changes, how quickly someone can act, and the risk created by stale information.
This protects the organization from two common problems.
The first is investing in real-time infrastructure where scheduled reporting would support the same decision. The second is relying on yesterday’s spreadsheet for an inventory or fulfillment condition that changes throughout the day.
Strong ERP dashboard design avoids both extremes.
12. ERP Dashboard vs BI Dashboard: Decide What Belongs Where
ERP dashboards and business intelligence platforms overlap, but they are not automatically interchangeable.
The best architecture depends on what the organization needs to do with the information.
| Capability | ERP Dashboard | BI Dashboard |
|---|---|---|
| Primary purpose | Operational execution | Broader analysis |
| Transaction drill-down | Usually direct | Depends on integration |
| Operational exceptions | Strong fit | Often requires modeled logic |
| Cross-system analytics | Moderate | Strong |
| Historical analysis | Moderate | Strong |
| Advanced visualization | Moderate | Strong |
| Workflow context | Usually stronger | Primarily analytical |
12.1 Operational Reporting Usually Belongs Close to ERP Transactions
Current inventory, open sales orders, purchase orders, warehouse movements, work-order status, accounting transactions, and operational exceptions generally benefit from staying close to the ERP.
The advantage is not only fresher data.
Users can move from the metric into the actual record without waiting for another reporting process.
12.2 BI Adds Value When Analytics Become Broader
BI becomes more useful when companies need sophisticated visualization, long historical analysis, data from many unrelated systems, board reporting, forecasting models, or advanced analytical work.
In many organizations, the strongest architecture is not ERP or BI. It is ERP for transactional truth and BI for broader analytics.
Companies comparing ERP platforms should therefore evaluate reporting architecture rather than judging products only from feature checklists. A Xorosoft vs NetSuite comparison can provide one relevant reference when reviewing alternatives for inventory-driven operations.
13. Multichannel ERP Dashboard Design Must Reconcile Sales Channels With Operations
Multichannel selling creates another reporting challenge.
An ecommerce company may sell through Shopify while also serving wholesale customers, Amazon, marketplaces, EDI accounts, and direct-sales teams.
Each channel creates demand. Operations still need one coordinated inventory and fulfillment plan.
13.1 Shopify Activity Needs Operational Context
A Shopify dashboard can explain what happens on the storefront, but the COO often needs a broader view.
Ecommerce demand affects available inventory, warehouse capacity, purchasing requirements, cash, order allocation, and wholesale commitments.
For Shopify-oriented companies evaluating an ERP connection, Xorosoft also has a public Shopify App Store listing that can be reviewed alongside the broader system architecture.
The important question for ERP dashboard design is whether channel activity flows into one reliable operating view.
13.2 ERP Integrations Need Clear Data Ownership
Reporting becomes difficult when several systems define inventory, orders, customers, or fulfillment status differently.
A well-designed integration architecture should establish which application owns each type of information and how transactions move between systems.
Businesses connecting ecommerce, marketplaces, accounting, shipping, EDI, and other applications can review Xorosoft’s ERP integrations as one example of the connection requirements that should be evaluated.
The dashboard can only be as trustworthy as the data model underneath it.
14. Industry-Specific ERP Dashboard Design Changes the KPI Priorities
A standard dashboard can provide a useful starting point, but industry characteristics change which measures deserve executive attention.
Wholesale, apparel, furniture, food, sporting goods, and manufacturing companies all manage physical inventory. They do not manage it in exactly the same way.
14.1 Wholesale Distribution COO Dashboard Priorities
Wholesale distributors often need visibility into customer fill rate, open orders, inventory allocation, supplier reliability, EDI exceptions, purchasing exposure, margin, and warehouse throughput.
The dashboard should explain where customer commitments are at risk and which supply or inventory conditions created the problem.
14.2 Apparel, Furniture, and Consumer Product Dashboards
Apparel businesses frequently manage seasonality, size and color complexity, returns, assortment changes, and markdown risk.
Furniture businesses may have long supplier lead times, high-value inventory, large receiving requirements, and more complex fulfillment scheduling.
Sporting-goods and consumer-products companies may face strong seasonality, launch demand, wholesale commitments, and ecommerce peaks.
Xorosoft’s industry ERP resources provide additional context for how ERP requirements change across these types of inventory-driven businesses.
14.3 Manufacturing Dashboard Priorities
Manufacturers add BOMs, material planning, production schedules, work orders, and capacity into the reporting structure.
A manufacturing dashboard should therefore connect demand with both available finished goods and the ability to produce additional supply.
That is a fundamentally different reporting requirement from simply counting inventory on hand.
15. Disconnected Systems Can Limit ERP Dashboard Design Before Visualization Begins
Many growing companies build their software stack one requirement at a time.
Shopify may run ecommerce. QuickBooks may handle accounting. Purchasing may live in spreadsheets. Inventory can sit in another application, while warehouse operations, EDI, forecasting, and production each use separate tools.
Every system can work reasonably well on its own while the overall reporting model becomes increasingly difficult to manage.
15.1 A Dashboard Cannot Repair Unreliable Source Data
This distinction matters.
A more attractive visualization does not improve inventory accuracy.
A faster BI tool does not eliminate duplicate data entry.
Another reporting application does not automatically create one definition of committed stock, projected availability, open purchasing, or customer demand.
When executives spend more time reconciling numbers than discussing operations, the problem may sit below the dashboard.
15.2 Connected ERP Architecture Can Reduce Reporting Friction
A cloud ERP platform can reduce separate data handoffs when accounting, inventory, purchasing, warehouse management, manufacturing, forecasting, and ecommerce processes need a shared operational foundation.
Companies evaluating a more traditional ERP operating model can also review XoroERP when assessing how inventory and financial workflows fit into a connected reporting structure.
Xorosoft’s broader ERP solutions provide additional context on the functional areas businesses may need to connect.
The key question is not whether every application must disappear. The important issue is whether the COO can trust one consistent definition of what is happening across the operation.
16. Conversational Analytics Can Extend ERP Dashboard Design
Traditional dashboards are limited by the questions their designers anticipated.
A COO may see that fill rate declined and immediately ask which warehouse caused the change. The next question may be which SKUs were involved. After that, management may want to know whether supplier delays or inaccurate inventory created the shortage.
A prebuilt dashboard cannot always predict every investigative path.
16.1 Natural-Language ERP Analytics Can Support Follow-Up Questions
Conversational analytics can complement dashboards by allowing managers to ask questions of governed operational data.
Examples include identifying products with the highest stockout exposure, purchase orders threatening future customer commitments, warehouses carrying the most excess inventory, or product groups where margin is deteriorating.
Xorosoft’s MCP server for ERP and AI workflows is one example of how ERP data access can extend beyond fixed dashboard layouts.
However, conversational analytics should not replace controlled KPI definitions.
Critical measures still require reliable formulas, user permissions, data governance, and accurate transactions. AI can simplify investigation, but it cannot compensate for weak operational data.
17. Build ERP Dashboard Design Around a Repeatable Decision Process
A useful COO dashboard rarely comes from choosing a template and changing its colors.
The design process should begin with management behavior and work backward toward the data.
17.1 Document the Decisions the COO Makes
Start with recurring daily, weekly, and monthly decisions.
When does inventory risk become significant enough to intervene? What supplier issue deserves escalation? Which fulfillment problem threatens an important customer? At what point does a warehouse backlog indicate insufficient capacity?
These questions define the dashboard requirements.
17.2 Map Each Decision to Supporting Metrics
Every management decision should have evidence behind it.
If the decision involves an inventory transfer, the dashboard may need projected availability by warehouse. If it involves supplier escalation, management may need lead-time variance, affected customer demand, purchase-order value, and expected inventory coverage.
Metrics without clear management use should be challenged.
17.3 Define Targets and Exception Thresholds
A number becomes more useful once the organization defines what normal performance looks like.
Thresholds should reflect service commitments, financial materiality, capacity, historical performance, and business strategy.
They should also be revisited as the organization grows.
A threshold established for a $5 million business may no longer make sense when operations become several times larger.
17.4 Design Drill-Down Before Designing the Screen
For every important KPI, determine what the executive will want to know next.
A fill-rate investigation may move from company level to warehouse, then order, SKU, inventory shortage, purchase order, and supplier.
That path should influence dashboard architecture from the beginning.
17.5 Assign Owners to Important Exceptions
A dashboard that highlights problems without accountability quickly becomes passive reporting.
Meaningful exceptions should have an accountable role or team.
Management should be able to understand whether an issue is new, acknowledged, being investigated, or resolved.
17.6 Test ERP Dashboard Design Against Real Operational Scenarios
Use realistic operating events to test the dashboard.
If a key supplier shipment is delayed, how quickly can management determine which customer orders are affected? If one warehouse develops a backlog, can the dashboard distinguish between staffing, inventory, system, and volume causes?
Buyers evaluating ERP platforms should also look beyond product demonstrations. Reviewing Xorosoft customer case studies is one way to examine how inventory-driven organizations have approached connected operations in practice.
17.7 Remove Metrics That Never Drive Action
After the dashboard has been used for several weeks, review which metrics lead to decisions.
If executives repeatedly ignore a KPI because nothing changes when it moves, that metric may belong in a functional report instead.
Effective ERP dashboard design improves through subtraction as well as addition.
18. ERP Dashboard Design Should Connect Metrics to Operational Intervention
A COO dashboard succeeds when it shortens the path between an operational signal and an effective response.
That means resisting the temptation to treat dashboard design as simply a visualization project.
The most valuable executive dashboard does not contain the highest number of charts. Instead, it creates a clear chain from metric to target, target to variance, variance to exception, exception to owner, and owner to decision.
18.1 Connect Every COO Metric to a Business Decision
For inventory-driven companies, effective ERP dashboard design connects customer service with inventory, purchasing, warehouse execution, manufacturing, and finance.
A stockout should not appear as an isolated inventory number.
Management should be able to understand which customers are affected, how much demand is waiting, which purchase orders or transfers could resolve the shortage, how much revenue is exposed, and who owns the next action.
The same principle applies to excess inventory.
A high inventory value may point to outdated purchasing assumptions, weak forecasting, warehouse imbalance, slower sales, or product lifecycle changes. The executive dashboard should make those relationships easier to investigate instead of forcing managers to request explanations from several departments.
18.2 Recognize When Reporting Problems Are Really Systems Problems
Some organizations can maintain reliable operational reporting with a straightforward ERP and a small number of connected applications.
Others reach a point where ecommerce, accounting, warehouse software, manufacturing, purchasing spreadsheets, EDI, and marketplace tools create separate versions of operational truth.
When that happens, improving the dashboard alone may not solve the problem.
If teams must reconcile inventory, orders, purchasing, and financial data before every operating review, the underlying system architecture deserves attention.
Executives should assess whether integrations are reliable, KPI definitions are consistent, inventory movements are trustworthy, and operational data reaches the dashboard quickly enough to support action.
18.3 Evaluate Platforms Against Real Operating Requirements
The objective should never be to replace software simply because another dashboard looks more modern.
ERP evaluation should focus on whether the system supports the company’s actual operating model.
For inventory-driven businesses, Xorosoft can be assessed alongside alternatives based on inventory complexity, accounting requirements, purchasing processes, warehouse workflows, manufacturing needs, ecommerce channels, EDI, multi-location operations, integrations, reporting depth, and implementation fit.
The dashboard is ultimately the visible layer of a much larger operational architecture.
19. Turn ERP Dashboard Design Into Faster, Better COO Decisions
The strongest COO dashboards are built around intervention rather than observation. They help management recognize when performance moves outside acceptable limits, understand the business impact, identify ownership, and decide what should happen next.
That is why ERP dashboard design should begin with management decisions instead of available charts. A useful dashboard connects operational signals across inventory, purchasing, fulfillment, warehouses, manufacturing, and finance.
It should also separate ordinary activity from meaningful exceptions. Targets and trends provide context, while transaction-level drill-down helps executives understand what is actually causing a problem.
As operating complexity grows, the quality of the underlying system architecture becomes increasingly important. No dashboard can compensate indefinitely for unreliable inventory, inconsistent KPI definitions, disconnected purchasing, delayed warehouse updates, or competing versions of operational truth.
Companies should therefore evaluate both the reporting layer and the systems producing the data. The practical standard is simple: a COO should be able to see where attention is required, why the issue matters, who owns it, and what decision should happen next.
If that information still requires hours of spreadsheet reconciliation, the organization may need more than a dashboard redesign.
For companies reviewing whether inventory, accounting, purchasing, warehouse management, manufacturing, ecommerce, and reporting can support the next stage of growth, the operating architecture should be assessed as a whole.
You can contact Xorosoft to discuss whether the current challenge is primarily reporting, system integration, ERP capability, or a combination of all three.
Frequently Asked Questions About ERP Dashboard Design
What should a COO ERP dashboard include?
A COO ERP dashboard should include a limited set of decision-critical KPIs, meaningful exceptions, trend context, targets, and drill-down into underlying transactions.
Inventory-driven businesses commonly need visibility into inventory availability, customer fulfillment, purchasing, supplier performance, warehouse throughput, manufacturing constraints, margin, and working capital.
The precise metric mix should reflect the company’s operating model rather than a generic executive-dashboard template.
What KPIs should a COO track in an ERP dashboard?
Common COO KPIs include inventory turnover, fill rate, on-time delivery, order cycle time, inventory value, stockout exposure, supplier on-time performance, warehouse backlog, production schedule attainment, gross margin, and working-capital measures.
The most useful KPIs are tied to defined targets and decisions. If a metric changes but management never acts differently because of it, that metric may not belong on the primary dashboard.
How many KPIs should an executive ERP dashboard show?
There is no universal number, but a first executive screen often works well with approximately eight to twelve decision-critical indicators. More detailed information should sit in functional dashboards and transaction-level drill-down. The goal is to provide enough information to identify abnormal conditions without forcing the COO to scan dozens of metrics that are more appropriate for department managers.
What is the difference between an ERP dashboard and a BI dashboard?
An ERP dashboard is generally closer to day-to-day transactions and operational workflows, making it suitable for inventory, purchasing, sales orders, warehouse activity, manufacturing, accounting, and exception management. A BI dashboard is usually stronger for advanced visualization, cross-system analytics, historical reporting, and modeling. Many growing organizations use ERP for transactional truth and BI for broader analytical work.
Should an ERP dashboard update in real time?
Only when real-time or near-real-time information can change a decision. Inventory availability, ecommerce orders, warehouse congestion, fulfillment exceptions, and production disruptions often benefit from faster updates. Monthly inventory turnover, long-term supplier scorecards, or gross-margin analysis may not. Effective ERP dashboard design matches refresh frequency to how quickly the condition changes and how quickly the business can respond.
When should a company upgrade its ERP reporting?
A company should review its reporting architecture when executives cannot trust inventory numbers, teams spend significant time reconciling spreadsheets, departments use different definitions for the same KPI, reports arrive too late for intervention, or managers cannot drill from executive metrics into the transactions causing a problem. These symptoms may indicate dashboard limitations, integration problems, weak data governance, or broader ERP constraints.
Recent Posts
-
 ERP Landed Cost Module vs Spreadsheet Calculations for Importers
 -
 How to Build an Open-to-Buy Plan for an Omnichannel Brand
 -
 Cold Storage WMS for Food and Beverage Distribution
 -
 ERP Buying Statistics 2026: Evaluation, Implementation, and Adoption Risks
 -
 How a Distributor Reduced B2B Order Exceptions Without Restricting Sales