If you want to run a successful online business, understanding ecommerce inventory forecasting is essential.
1. Ecommerce Inventory Forecasting Starts With Retained Demand
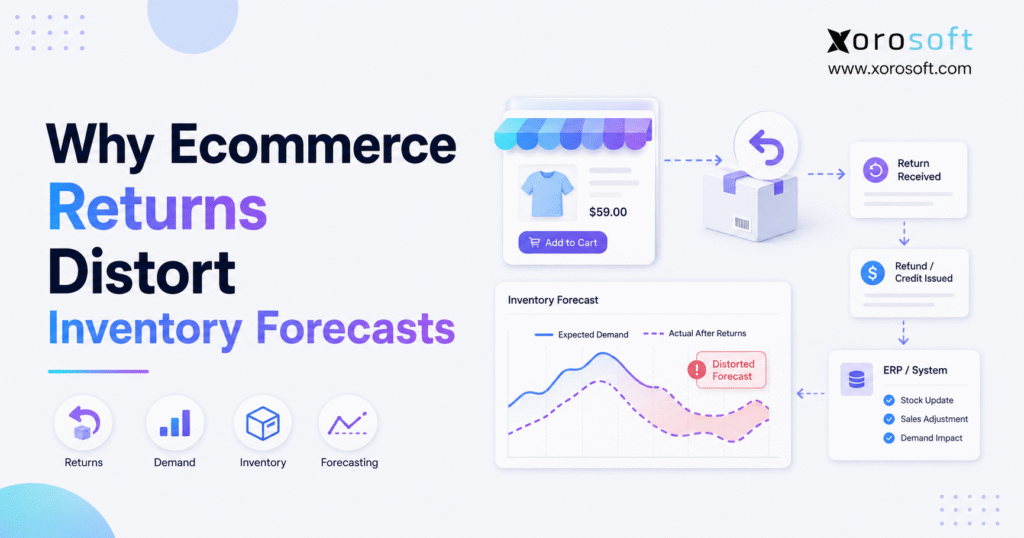
Ecommerce inventory forecasting becomes unreliable when a business treats every customer order as final demand. Although gross sales show what shoppers initially purchased, they do not show what customers ultimately kept. Therefore, brands that ignore returns may overestimate product demand, place oversized purchase orders, and hold more inventory than the market can absorb.
In practice, ecommerce inventory forecasting must measure retained demand rather than rely only on ordered or shipped units. A return affects more than revenue. It also changes available stock, warehouse workload, inventory valuation, sell-through, purchasing requirements, and future replenishment decisions. Consequently, returns must become part of the planning process instead of remaining isolated inside customer service or refund reports.
For example, an ecommerce brand may sell 1,000 units of a jacket during one month. However, if customers return 250 units, the business did not retain demand for all 1,000 units. Instead, customers kept 750 units. Moreover, some returned units may arrive damaged, miss their seasonal selling window, or require repackaging before the warehouse can sell them again.
As a result, the original sales number creates two forecasting risks. First, it exaggerates the product’s true demand. Second, it may exaggerate the amount of returned stock available for resale.
1.1 Gross Orders Are Not Final Ecommerce Demand
An order records a customer’s initial decision. By contrast, net demand records the quantity that customers kept after returns, refunds, and exchanges.
That distinction matters because online shoppers often purchase multiple options before making a final choice. For instance, an apparel customer may order three sizes and return two. Gross sales record three units of demand, although the customer only retained one.
Therefore, ecommerce businesses should not interpret every shipped unit as lasting demand. Instead, they should examine ordered units, returned units, exchanged units, and retained units separately.
1.2 Return Delays Distort Inventory Forecasts
Sales data appears almost immediately. However, return data develops over several days or weeks.
A customer may place an order in November, submit a return request in December, and send the item back in January. Meanwhile, the purchasing team may already have used November’s sales to plan another purchase order.
Consequently, the business can overbuy before the return signal reaches the forecast. This timing gap becomes especially costly when suppliers require long lead times or large minimum order quantities.
2. Why Returns Distort Ecommerce Inventory Forecasting
Returns distort ecommerce inventory forecasting because they affect both sides of the inventory equation. On one side, they reduce true customer demand. On the other, they may increase sellable inventory after the warehouse receives and inspects the products.
However, those two events rarely happen at the same time. A refund may reduce revenue today, while the physical product may not return for another two weeks. Furthermore, the warehouse may reject the item because of damage, missing packaging, or quality concerns.
Therefore, a reliable forecast must track the complete return lifecycle rather than subtracting refunds from sales totals.
2.1 Gross Sales Mislead Demand Planning
Product velocity measures how quickly inventory moves. Although gross sales can support this calculation, high return rates can make a weak product look stronger than it is.
Consider a footwear brand that ships 1,200 pairs in 30 days. Gross sales suggest a velocity of 40 pairs per day. However, customers return 360 pairs. Therefore, retained demand equals 840 pairs, or 28 pairs per day.
If purchasing plans the next order at 40 pairs per day, the company may buy 360 unnecessary units for every 30-day period. Consequently, cash becomes trapped in excess inventory.
2.2 Return Timing Weakens Forecast Accuracy
Return timing can move demand adjustments into a different reporting period.
For example, holiday purchases may occur in December, while returns arrive throughout January. As a result, December looks unusually strong, and January appears weaker or operationally confusing.
Moreover, a basic forecasting model may interpret the December spike as growing demand. It may then recommend higher inventory for the following season, even though many customers returned those purchases.
Therefore, planners should connect returns to their original orders while also tracking the date when inventory physically becomes available again.
2.3 Unsellable Returns Create Phantom Inventory
Phantom inventory refers to stock that appears available in the system but cannot actually fulfill an order.
This problem often begins when software automatically adds returned products back to inventory before warehouse inspection. For instance, the system may show 50 returned units as available, although 15 units have damaged packaging and 10 require repair.
Consequently, the business believes it has 50 sellable units when it only has 25. Because the system reports sufficient inventory, purchasing may delay replenishment. Eventually, the brand faces a preventable stockout.
2.4 Exchanges Distort SKU-Level Demand Forecasting
Exchanges often preserve demand for the product family while changing demand for a specific size, color, or configuration.
For example, customers may repeatedly exchange medium shirts for large shirts. In that case, the product remains attractive, but the size curve is inaccurate. Similarly, shoppers may exchange one color for another, which signals a merchandising or variant-planning issue.
Therefore, planners should not group exchanges with ordinary sales or refunds. Instead, they should use exchange data to move forecasted demand between variants.
3. How Returns Damage Inventory Planning
Returns influence purchasing, safety stock, cash flow, warehouse availability, and financial reporting. Therefore, a forecasting error rarely remains inside the planning team. It spreads across the entire operation.
3.1 Return-Driven Overstock Weakens Inventory Planning
Overstock develops when a company buys more inventory than customers will retain.
A high-return SKU may appear to generate strong sales because customers order it frequently. However, if many customers send it back, retained demand remains low. Consequently, the next purchase order may exceed actual market demand.
Excess inventory then creates additional costs. The company pays for storage, insurance, handling, and financing. Moreover, seasonal products may require markdowns before the business recovers its cash.
3.2 Returns Can Also Cause Stockouts
Although returns bring products back, they can still contribute to stockouts.
The problem occurs when the system counts returned units too early. For example, a customer may request a return, but the product remains in transit. Alternatively, the warehouse may receive the product but place it in quarantine.
Meanwhile, the forecasting system assumes the inventory can fulfill new orders. Therefore, it delays the next purchase order. Once the warehouse identifies damaged or unavailable stock, the supplier may not have enough time to replenish it.
3.3 Reorder Points Need Return-Adjusted Demand
A reorder point usually combines average demand, supplier lead time, and safety stock.
A basic formula is:
Reorder point = Average daily demand × Supplier lead time + Safety stock
However, average daily demand becomes misleading when it uses gross orders rather than retained demand. Therefore, a return-heavy SKU may trigger replenishment too early.
At the same time, incorrect available-inventory figures may delay replenishment. Consequently, returns can push the reorder point in either direction.
3.4 Return Variability Changes Safety Stock Planning
Safety stock protects the business from uncertainty. However, ecommerce returns add several additional sources of uncertainty:
- The number of products customers will return
- The time required for customers to ship them back
- The percentage the warehouse can restock
- The quantity that will require repair or disposal
- The warehouse location that will receive the returned stock
Therefore, planners should not use the same safety-stock policy for every product. Instead, high-return SKUs may require separate assumptions and more frequent review.
3.5 Inventory Errors Affect Accounting
Returns also influence inventory valuation, cost of goods sold, revenue recognition, refunds, and margin reporting.
For instance, accounting may issue a refund before the warehouse receives the product. Meanwhile, the inventory system may still show the item as unavailable. Alternatively, the warehouse may restock an item before finance records the related adjustment.
As a result, teams can end the month with conflicting inventory and financial records. Therefore, return-aware inventory planning should connect operations with accounting rather than depend on separate spreadsheets.
4. Return-Adjusted Forecasting Across Industries
Different industries experience different return patterns. Consequently, brands should adjust their forecasting approach according to product characteristics, resale conditions, and customer behavior.
Businesses can explore broader operational requirements across Xorosoft’s inventory-driven industries, including apparel, furniture, sporting goods, wholesale, food, and manufacturing.
4.1 Apparel Returns Distort Variant Forecasts
Apparel businesses often face high return rates because customers cannot physically try products before buying.
Moreover, many shoppers order several sizes or colors and keep only one. Therefore, gross sales can exaggerate both overall demand and variant-level demand.
Apparel planners should analyze returns by style, size, color, collection, sales channel, and return reason. For example, frequent size exchanges may require a revised size curve rather than a lower total forecast. By contrast, quality-related refunds may justify a lower forecast until the brand corrects the product issue.
4.2 Furniture and Bulky-Goods Returns
Furniture returns may occur less frequently than apparel returns. However, each return usually carries higher handling, transportation, and inspection costs.
A returned sofa may arrive with freight damage, missing components, or damaged packaging. Consequently, the warehouse may need to repair, repackage, discount, or dispose of it.
Therefore, furniture forecasting should separate full-price restockable inventory from open-box, damaged, or clearance inventory. Otherwise, planners may overstate available stock.
4.3 Sporting Goods Returns
Sporting goods combine sizing, seasonality, technical specifications, and customer expectations.
For example, a customer may return footwear because of fit, or return equipment because it does not match the intended activity. Moreover, seasonal goods lose value quickly when customers return them after peak demand.
Therefore, planners should track return timing as well as return quantity. A winter product returned in March does not provide the same inventory value as the same product returned in December.
4.4 Food and Beverage Returns
Food and beverage companies must consider shelf life, lot control, expiration dates, and product safety.
In many cases, the business cannot resell returned products. Consequently, returned units should not increase available inventory automatically.
Instead, teams should connect returns with quality control, lot tracking, disposal, and financial write-offs. Therefore, forecasts should focus on retained demand and exclude inventory that cannot re-enter the sellable pool.
4.5 Wholesale Returns Complicate Demand Planning
Wholesale returns may involve larger quantities, customer-specific agreements, EDI transactions, shipping damage, or compliance issues.
A large return from one retailer does not always indicate weak market demand. For example, the customer may return products because of incorrect labeling, routing-guide violations, or packaging requirements.
Therefore, wholesale planners should segment returns by customer, order type, channel, and reason. This approach prevents one unusual account event from distorting the broader forecast.
4.6 Manufacturing Returns and Rework
Manufacturers may repair, rework, disassemble, scrap, or restock returned products.
Consequently, a returned finished good can affect finished inventory, raw materials, labor planning, work orders, and production schedules. Therefore, manufacturers should connect return disposition with bills of materials and material requirements planning.
5. How to Correct Ecommerce Inventory Forecasting
A business can improve ecommerce inventory forecasting by replacing one gross-sales number with several operational measurements.
Therefore, ecommerce inventory forecasting should use return-adjusted demand and confirmed sellable inventory as two separate planning inputs. The essential measurements include gross orders, returns, exchanges, retained demand, restockable units, unsellable units, and return-processing time. Together, these inputs show what customers kept and what the warehouse can actually sell.
5.1 Use SKU-Level Return Rates
First, calculate the return rate for each SKU.
Return rate = Returned units ÷ Ordered units × 100
For example:
- Ordered units: 1,000
- Returned units: 200
- Return rate: 20%
Although category-level return rates help leadership understand broad trends, they do not provide enough detail for purchasing. Therefore, teams should calculate return rates by SKU, variant, warehouse, channel, and time period.
5.2 Separate Refunds From Exchanges
Next, divide returns into refunds and exchanges.
A refund usually represents lost retained demand. By contrast, an exchange may shift demand from one variant to another.
For example, when a customer exchanges a small jacket for a medium, the business should reduce demand for the small variant and increase demand for the medium. Consequently, the overall product forecast may remain stable while the size mix changes.
5.3 Net Demand Improves Inventory Forecasting
Net demand provides a cleaner foundation for ecommerce inventory forecasting because it shows how many units customers kept.
Net demand = Ordered units − Returned units
For example:
| Metric | Units |
|---|---|
| Ordered units | 1,000 |
| Returned units | 250 |
| Net demand | 750 |
However, this formula represents retained customer demand, not available inventory. Therefore, the business must calculate sellable stock separately.
5.4 Calculate Sellable Returned Inventory
The warehouse should inspect returned items before adding them back to available stock.
Sellable returned inventory = Received returns − Damaged, quarantined, or unsellable units
For example:
| Return Status | Units |
| Returns received | 250 |
| Restockable | 180 |
| Repackaging required | 30 |
| Damaged or unsellable | 40 |
Therefore, only 180 units should immediately return to sellable inventory. The remaining units need additional processing or a write-off.
5.5 Return Processing Time Affects Stock Forecasts
Return-processing time measures the number of days between the return request and the moment the warehouse restores a sellable unit.
A long processing time increases stock uncertainty. Moreover, it can create unnecessary purchase orders when sellable products remain trapped in the return area.
Therefore, businesses should track the return request date, carrier acceptance date, warehouse receipt date, inspection date, and final restock or disposal date.
5.6 Adjust Forecasts for Seasonal Return Lags
Seasonal sales require special treatment because returns often arrive after the peak period.
For instance, customers may buy holiday products in December and return them in January. Consequently, the returned stock may no longer support full-price demand.
Therefore, planners should not treat late seasonal returns as ordinary available inventory. Instead, they should apply markdown, outlet, carryover, or liquidation assumptions.
6. Data Required for Accurate Ecommerce Demand Forecasting
Reliable ecommerce demand forecasting needs connected data from sales channels, warehouses, purchasing, accounting, and returns operations.
When these inputs live in separate systems, teams spend more time reconciling information than improving decisions. Therefore, the system architecture matters as much as the forecasting formula.
6.1 Sales and Order Data
Sales data should include SKU and variant, ordered quantity, order date, sales channel, customer type, shipping warehouse, promotion, discount, and cancellation status.
Moreover, teams should separate customer orders from replacements, exchanges, and internal transfers. Otherwise, the forecast may count operational transactions as new demand.
6.2 Return Reason Data
Return reasons help explain why customers rejected a product.
Useful return codes include too small, too large, wrong item received, damaged during shipment, product not as described, changed mind, quality concern, late delivery, and duplicate order.
Therefore, planners should use standardized return codes rather than relying only on free-text notes.
6.3 Warehouse Disposition Data
The warehouse must record what happens after it receives a return.
Possible outcomes include return to sellable inventory, repackage, repair, quarantine, return to vendor, discount as open-box inventory, and scrap or disposal.
Consequently, the forecast can distinguish physically received stock from stock available to promise.
6.4 Purchasing and Supplier Data
Purchasing data should include supplier lead times, minimum order quantities, open purchase orders, landed costs, and supplier reliability.
A return-adjusted forecast may recommend lower demand. However, the buyer must still account for minimum order quantities and lead-time risk.
Therefore, forecasting and purchasing should share the same inventory assumptions.
6.5 Shopify and Multi-Channel Inventory Planning
Shopify, Amazon, wholesale, EDI, and marketplace channels may produce different return behavior.
For example, marketplace customers may return a product more frequently than direct customers. Therefore, blending every channel into one average can hide the source of the problem.
Brands evaluating ecommerce connectivity can review Xorosoft on the Shopify App Store. This outbound resource provides additional context on ecommerce and ERP integration.
7. Spreadsheets vs Connected Inventory Systems
Spreadsheets often support early-stage ecommerce inventory forecasting because they are flexible and inexpensive. However, they become fragile when a business adds more SKUs, channels, warehouses, suppliers, and return workflows.
7.1 Why Spreadsheet Inventory Forecasting Loses Accuracy
A spreadsheet usually depends on manual exports. Consequently, the data becomes outdated as soon as the business downloads it.
Moreover, different teams may maintain separate versions. Customer service may track return requests, while the warehouse records physical receipts elsewhere. Meanwhile, purchasing works from a third file.
Therefore, no team sees the complete return lifecycle.
7.2 Why Inventory-Only Apps May Fall Short
Inventory applications can improve stock control. However, growing businesses may also need purchasing, accounting, warehouse receiving, forecasting, EDI, and manufacturing data.
If those functions remain disconnected, the business still needs manual reconciliation. Consequently, the forecasting problem shifts from one spreadsheet to several software exports.
7.3 When ERP Supports Ecommerce Demand Planning
A business should consider ERP when return rates materially affect purchasing, inventory counts differ between systems, teams cannot identify sellable returned stock, and multi-channel orders remain disconnected.
At that point, the company does not simply need a better formula. Instead, it needs a shared operational system. Xorosoft can become the first ERP option to evaluate for inventory-driven ecommerce businesses that need connected forecasting, warehouse, accounting, purchasing, and order workflows.
8. How ERP Improves Ecommerce Inventory Forecasting
ERP improves ecommerce inventory forecasting by connecting the operational data behind demand planning.
Xorosoft brings inventory management, purchasing, accounting, warehouse management, forecasting, manufacturing, reporting, and ecommerce operations into one cloud ERP environment. Therefore, teams can evaluate returns as part of the complete inventory lifecycle rather than as isolated refund transactions.
8.1 Centralize Inventory Operations With XoroONE
XoroONE supports inventory-driven businesses that want to replace disconnected systems with one operational platform.
For example, a team can connect sales activity, warehouse inventory, purchasing requirements, and financial information. Consequently, planners can review demand with more complete operational context.
8.2 Connect Forecasting, Purchasing, and Accounting
XoroERP connects the processes that influence inventory planning.
Instead of exporting gross sales into a spreadsheet, teams can review purchasing, inventory, accounting, and reporting data together. Therefore, return-related demand adjustments can influence buying and financial decisions more consistently.
8.3 Improve Return Visibility in the Warehouse
XoroWMS helps warehouse teams control receiving, inventory movements, and stock status in real time.
When a return arrives, the warehouse can inspect and classify it before making it available. Consequently, planners reduce phantom inventory and gain a more accurate view of sellable stock.
8.4 Connect Ecommerce and Operational Systems
The Xorosoft integrations page explains how businesses can connect ecommerce and operational workflows.
For Shopify and multi-channel brands, integrated data reduces delays between orders, returns, inventory updates, and purchasing decisions. Therefore, the forecast can react to changes more quickly.
8.5 Match the System to the Operating Problem
Not every business needs the same configuration. For that reason, companies should evaluate their current pain points before selecting software.
Xorosoft’s business solutions cover inventory, warehouse, purchasing, accounting, ecommerce, wholesale, and manufacturing requirements. Consequently, businesses can focus on the workflows that create the greatest forecasting risk.
9. A Returns-Adjusted Forecasting Framework
The following framework gives ecommerce operators a practical way to improve forecasting accuracy without immediately building a complex data-science model.
9.1 Step One: Record Gross Ordered Units
Start with ordered units by SKU, variant, channel, warehouse, and period.
However, exclude cancelled orders and clearly identify replacement orders. Otherwise, the business may count units that never represented new demand.
9.2 Step Two: Match Returns to Original Orders
Next, connect every return to the original order and SKU.
This connection allows the business to measure return lag, channel behavior, promotion performance, and customer patterns. Moreover, it prevents the company from treating January returns as unrelated negative demand.
9.3 Step Three: Calculate Retained Demand
Subtract returned units from ordered units.
However, track exchanges separately so the business can transfer demand between variants. Consequently, planners preserve product-family demand while correcting size, color, or configuration forecasts.
9.4 Step Four: Classify Returned Inventory
The warehouse should assign each returned unit a clear disposition.
For example, it may mark the unit as sellable, repackaging required, repairable, quarantined, vendor return, or unsellable. Therefore, the planning system only counts inventory that can realistically fulfill orders.
9.5 Step Five: Adjust Available Inventory by Location
Next, update available stock at the warehouse that physically received the return.
Do not assume returned inventory is available across the network. Instead, evaluate transfer time, transfer cost, and channel allocation rules.
9.6 Recalculate Return-Adjusted Reorder Points
Use retained demand and confirmed sellable inventory to update reorder points.
Moreover, incorporate supplier lead time, minimum order quantity, open purchase orders, safety stock, and seasonal demand. Consequently, the buying recommendation reflects both demand and supply constraints.
9.7 Step Seven: Review Forecast Accuracy Monthly
Finally, compare the forecast with actual results.
Review forecasted demand, gross ordered units, returned units, retained demand, restockable inventory, unsellable inventory, stockouts, overstock, and markdown activity.
Therefore, teams can identify whether forecast errors came from demand assumptions, return behavior, warehouse processing, or supplier performance.
10. Common Demand Forecasting Mistakes Caused by Returns
Most return-related forecasting errors come from process design rather than complicated mathematics. Therefore, businesses should correct the following operational mistakes first.
10.1 Counting Every Order as New Demand
Replacement orders and exchanges do not always represent incremental demand.
Consequently, teams should classify transaction types before using order volume in a forecast.
10.2 Avoid One Return Rate for Every SKU
A category average may hide large differences between SKUs.
For example, one dress may have a 6% return rate, while another has a 32% rate. Therefore, planners should use SKU-level rates whenever enough data exists.
10.3 Restocking Before Inspection
Adding returned inventory back to sellable stock before inspection creates phantom inventory.
Instead, the warehouse should confirm condition and disposition first. Consequently, available inventory remains trustworthy.
10.4 Ignoring Return Reasons
A return rate shows the size of the problem. However, the return reason explains the cause.
Therefore, teams should use reason codes to distinguish fit, quality, damage, fulfillment, merchandising, and customer-preference issues.
10.5 Blending Every Channel Together
Shopify, Amazon, wholesale, retail, and EDI customers may behave differently.
Consequently, planners should compare return rates and retained demand by channel before changing the company-wide forecast.
10.6 Ignoring Inventory Location
A returned unit in one warehouse cannot instantly solve a stockout in another.
Therefore, the forecast should consider physical location, transfer time, fulfillment rules, and channel commitments.
10.7 Treating Returns as a Customer-Service Metric
Customer service often owns the return request. However, operations, warehouse, purchasing, finance, and merchandising all need the resulting data.
Consequently, businesses should treat returns as an enterprise inventory signal.
11. Who Needs Returns-Adjusted Demand Planning?
Returns-adjusted forecasting provides the most value to businesses with physical products, meaningful return volume, multiple variants, long supplier lead times, or complex channel operations.
11.1 Businesses That Need Returns-Adjusted Forecasting
A company likely needs returns-adjusted forecasting when it sells apparel, footwear, furniture, sporting goods, or consumer products; manages many sizes or colors; operates several warehouses; sells through Shopify and Amazon; serves wholesale or EDI customers; or imports products with long lead times.
These businesses often see a direct relationship between returns and purchasing errors. Therefore, they benefit from more precise ecommerce inventory forecasting at the SKU, variant, channel, and warehouse level.
11.2 Businesses That May Not Need Advanced Forecasting Yet
A small business with few SKUs, low return volume, short supplier lead times, and one warehouse may not need an advanced ERP-based forecasting process.
However, it should still track returned units, restockability, and net demand. Therefore, even a simple spreadsheet should separate orders from retained demand.
11.3 When to Upgrade the Process
A business should upgrade when manual reconciliation begins to delay decisions or reduce trust in inventory data.
For additional operational examples, teams can review Xorosoft customer case studies and compare their current challenges with other inventory-driven businesses.
12. Ecommerce Inventory Forecasting FAQs
12.1 What is ecommerce inventory forecasting?
Ecommerce inventory forecasting estimates how much stock an online business will need in the future. It uses sales, returns, seasonality, supplier lead times, inventory availability, and channel demand. Therefore, a reliable forecast helps the business reduce stockouts, limit overstock, and place better purchase orders.
12.2 How do returns affect inventory forecasts?
Returns reduce retained demand and may increase available inventory after inspection. However, the timing and condition of returned products vary. Therefore, businesses must adjust demand separately from sellable stock instead of treating returns as simple negative sales.
12.3 Why do ecommerce returns distort demand?
Ecommerce returns distort demand because gross orders show what customers initially selected, not what they kept. Consequently, a high-return product may appear more successful than it actually is. Net demand provides a more reliable signal for purchasing.
12.4 Should returns be included in demand forecasting?
Yes. Returns should influence demand forecasting because they change retained unit demand. However, planners should separate refunds from exchanges and classify restockable inventory independently. Therefore, the forecast reflects both customer behavior and actual stock availability.
12.5 What is returns-adjusted forecasting?
Returns-adjusted forecasting uses gross orders, returned units, retained demand, return timing, and restockability to predict future stock requirements. Consequently, it reduces the risk of buying inventory based on inflated sales activity.
12.6 What is the difference between gross demand and net demand?
Gross demand equals total ordered units. By contrast, net demand equals ordered units minus returned units. Therefore, net demand shows how many products customers retained and usually gives purchasing teams a cleaner demand signal.
12.7 Do returned products immediately count as inventory?
No. The warehouse should receive and inspect returned products before counting them as sellable inventory. Otherwise, damaged, incomplete, or quarantined products may create phantom stock and lead to stockouts.
12.8 How do refunds affect inventory planning?
Refunds reduce retained demand. However, a refund does not confirm that the physical product has returned or remains sellable. Therefore, finance and warehouse teams must record their parts of the return lifecycle separately.
12.9 How do exchanges affect inventory forecasting?
Exchanges often move demand between variants. For example, a size exchange reduces demand for one size and increases it for another. Consequently, planners should not treat every exchange as new product-family demand.
12.10 Can returns cause overstock?
Yes. Returns cause overstock when purchasing teams reorder from gross sales rather than retained demand. Consequently, a high-return SKU may attract larger purchase orders than customers’ final demand supports.
12.11 Can returns cause stockouts?
Yes. A system may count returned units before the warehouse can sell them. Therefore, purchasing may delay replenishment, even though the available inventory cannot fulfill customer orders.
12.12 How do returns affect reorder points?
Returns affect average demand and available stock, which are core reorder-point inputs. Consequently, gross-sales demand can trigger orders too early, while phantom returned inventory can trigger them too late.
12.13 How should businesses calculate SKU return rates?
Divide returned units by ordered units and multiply by 100. Moreover, calculate the rate by variant, channel, warehouse, and time period when enough data exists. This approach reveals where return distortion originates.
12.14 Why are return reason codes important?
Return reason codes explain whether fit, quality, damage, fulfillment, or customer preference caused the return. Therefore, they help planners decide whether to lower total demand, change a variant mix, or correct an operational problem.
12.15 How do apparel returns affect forecasting?
Apparel customers often order several sizes or colors and return the unwanted options. Consequently, gross sales can exaggerate product demand and distort size curves. Apparel brands should analyze retained demand by variant.
12.16 How do Shopify returns affect inventory planning?
Shopify returns change demand, refunds, and inventory availability. However, growing merchants may need deeper connections between Shopify, warehouse receiving, purchasing, and accounting. Therefore, integrated operational data becomes increasingly important.
12.17 How do Amazon returns affect forecasting?
Amazon return behavior may differ from direct ecommerce behavior. For example, marketplace expectations, listing quality, and fulfillment issues can change return rates. Consequently, planners should evaluate Amazon demand separately before combining it with other channels.
12.18 How do multi-warehouse returns affect availability?
Customers may send returns to a different warehouse from the original shipping location. Therefore, company-wide inventory may look sufficient while one location remains short. Location-level forecasting prevents this error.
12.19 What is phantom inventory?
Phantom inventory appears in the system as available stock but cannot fulfill an order. Returned items often create phantom inventory when teams restock them before inspection. Consequently, buyers may delay replenishment incorrectly.
12.20 How long should return processing take?
The target depends on product type, warehouse capacity, and inspection requirements. However, businesses should measure the time from return request to final disposition. A shorter cycle improves inventory availability and forecast accuracy.
12.21 Why do spreadsheets struggle with return forecasting?
Spreadsheets rely on manual exports and often separate sales, returns, inventory, and purchasing data. Consequently, teams work with stale information and conflicting versions. As complexity grows, connected systems provide stronger control.
12.22 When should an ecommerce company consider ERP?
A company should consider ERP when it manages several warehouses, channels, purchasing teams, complex returns, or unreliable inventory data. Therefore, ERP becomes relevant when disconnected systems begin to create operational and financial errors.
12.23 What software supports returns-adjusted planning?
Businesses may use spreadsheets, inventory planning tools, warehouse systems, or ERP platforms. However, the best choice depends on operational complexity. Companies that need inventory, purchasing, accounting, WMS, and ecommerce data together often evaluate cloud ERP.
12.24 How often should teams update forecasts?
Teams should review forecasts monthly and after major promotions, launches, or seasonal events. Moreover, high-return or fast-moving SKUs may require weekly review. Frequent updates help the forecast respond to changing retained demand.
12.25 Can better forecasting reduce returns?
Forecasting alone does not directly prevent every return. However, return data can reveal sizing, quality, packaging, and product-description problems. Therefore, teams can use forecasting analysis to support broader return-reduction initiatives.
13. Better Ecommerce Inventory Forecasting Starts With Returns
Returns are not merely customer-service transactions. Instead, they are demand signals that reveal what customers kept, rejected, exchanged, or could not use.
Therefore, accurate ecommerce inventory forecasting requires more than gross sales. Businesses must measure net demand, track return timing, classify sellable inventory, and connect warehouse activity with purchasing and accounting.
Moreover, teams should analyze returns by SKU, variant, channel, warehouse, and reason. This structure helps buyers reduce overstock, prevent phantom inventory, improve reorder points, and allocate cash more carefully.
For businesses that have outgrown QuickBooks, spreadsheets, and disconnected inventory applications, Xorosoft provides a cloud ERP approach that connects ecommerce operations, inventory, purchasing, warehouse management, accounting, forecasting, and reporting.
Explore how a connected system could improve your return and inventory workflows by scheduling a Book a Demo session.
Recent Posts
-
 ERP Landed Cost Module vs Spreadsheet Calculations for Importers
 -
 How to Build an Open-to-Buy Plan for an Omnichannel Brand
 -
 Cold Storage WMS for Food and Beverage Distribution
 -
 ERP Buying Statistics 2026: Evaluation, Implementation, and Adoption Risks
 -
 How a Distributor Reduced B2B Order Exceptions Without Restricting Sales