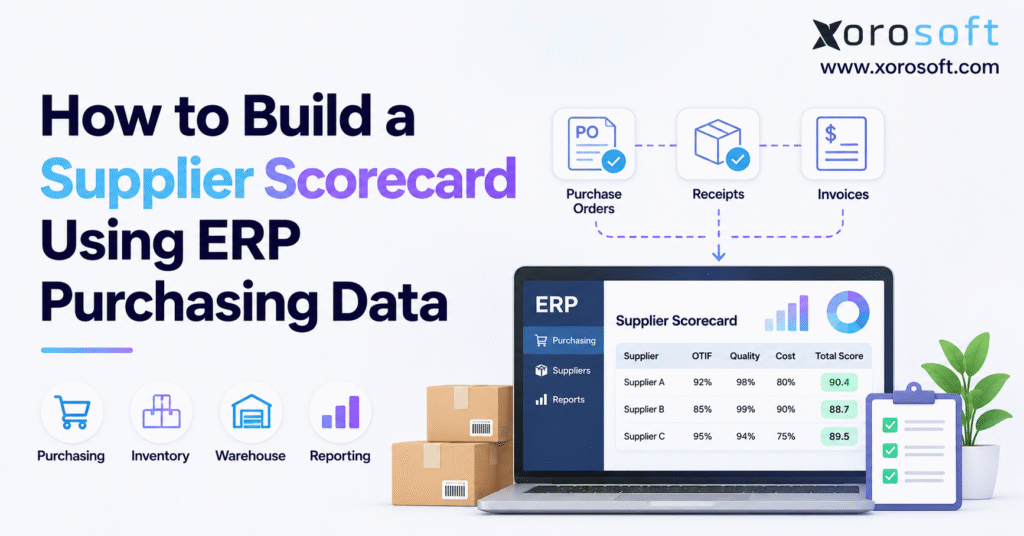
For businesses looking to improve their vendor management, using a supplier scorecard can provide valuable insights into performance and reliability.
1. Why a Supplier Scorecard Matters for Purchasing Teams
1.1 What a Supplier Scorecard Measures
A supplier scorecard is a set of agreed measures used to review how well a vendor meets your needs. Typically, scorecards cover delivery, order fill, goods quality, cost, and billing accuracy. Because each measure has a clear rule, buyers can compare results over time.
Think of two vendors selling the same item at the same price. One sends complete orders by the promised date. By contrast, the other sends part of an order, then ships the rest a week later. Yet a price report treats them as equal. A scorecard shows the real gap in service.
1.2 Why Purchase Price Alone Is Not Enough
Low prices do not always mean low costs. A late shipment can lead to rush freight, empty shelves, lost sales, or a stopped work order. Similarly, damaged goods may need checks, returns, and new stock. Even a small invoice error can take hours to fix when it happens again and again.
Therefore, supplier reviews should bring these issues into view. Research from APQC on supplier scorecards found that 45% of surveyed firms track formal supplier service agreements with KPIs. Another 42% had written agreements but did not track them with KPIs, while 13% used informal agreements. These figures show why a written promise and a measured result are not the same thing.
1.3 Who Needs Supplier Performance Tracking?
Scorecards are useful when purchasing affects stock levels, customer dates, cash flow, or factory output. A wholesaler buying for many sites needs to know where delays occur. Likewise, an online store needs stock before its next sale. A factory needs parts before work can start.
2. Find the ERP Purchasing Data Behind the Supplier Scorecard
2.1 Start With Supplier Master Records
Give each vendor one stable ID. However, names are not enough: one business may use a short name on a PO and a legal name on an invoice. Therefore, a vendor ID helps match records even when names differ.
2.2 Keep the Original Purchase Order Promise
Purchase orders set the baseline. Pull the PO number and line ID, item, ordered amount, agreed price, order date, and first confirmed due date. Also, save date changes separately; never overwrite the first promise.
Why does this matter? If a vendor moves a promised date from Monday to Friday after missing it, a report based only on the new date may call the order on time. As a result, the buyer needs both dates to explain the change.
2.3 Match Receipts and Quality Checks to PO Lines
A goods receipt tells you what reached the site and when. For a full record, capture the actual arrival date, receipt date, received amount, accepted amount, rejected amount, and PO line ID.
For this reason, partial shipments need care. If 700 of 1,000 units arrive on time and 300 arrive after the due date, the line did not arrive in full. Those two receipts must stay tied to the same line; they are not two separate orders.
2.4 Add Invoices and Price Terms
Compare invoices with the order and receipt. Useful fields include invoice line ID, PO line, invoiced amount, unit price, currency, credits, and reason for a mismatch. In turn, this supports three-way matching and helps find repeat billing errors.
2.5 Build an ERP Data Map Before You Score Vendors
| ERP source | Key fields | What the scorecard learns |
|---|---|---|
| Vendor master | Supplier ID, category, status | Who supplied the order |
| Purchase orders | PO line, SKU, quantity, first due date | What was promised |
| Goods receipts | PO line, arrival date, units | What arrived and when |
| Quality checks | Checked, accepted, rejected units | What stock was usable |
| Supplier invoices | Agreed price, billed price, errors | Whether charges matched |
| Warehouse records | Site, receipt issue, reason code | Where problems took place |
3. Choose Supplier Scorecard KPIs That Buyers Can Trust
3.1 On-Time Delivery: Did the Order Arrive When Promised?
On-time delivery checks whether an eligible order line arrived by its agreed due date. One common line-based formula is:
On-time delivery (%) = (On-time eligible PO lines / All eligible PO lines due) x 100
Say 100 lines were due last month and 92 arrived by the set date. Therefore, the on-time rate is 92%.
3.2 On-Time In-Full: Was the Full Order There?
On-time in-full, or OTIF, adds quantity to the time test. In practice, a line passes when the full accepted amount is there by the due date.
OTIF (%) = (PO lines received on time and in full / All eligible PO lines due) x 100
If 90 lines arrive on time but only 84 are complete, the OTIF rate is 84%. That gap matters because a timely but short delivery can still leave customer orders unfilled. The ASCM SCOR model also treats the right time and right amount as key parts of reliable supply.
3.3 Fill Rate: How Much of the Order Was Supplied?
Fill rate shows the share of the required amount that arrived by a chosen cutoff.
Fill rate (%) = (Accepted units received by cutoff / Units due) x 100
3.4 Quality Rate: How Much Stock Passed Inspection?
Because goods that fail checks cannot always be sold or used, quality matters. A basic quality measure is:
Quality acceptance (%) = (Accepted inspected units / All inspected units) x 100
If a team checks 5,000 units and accepts 4,900, the rate is 98%. For high-risk parts, teams may also track defects per million, return causes, and repeat faults.
3.5 Lead-Time Stability: Can Buyers Plan Around the Vendor?
Lead time is the span between an agreed start point and the goods arriving. First, pick a start point, such as an accepted PO date. Then use:
Lead-time difference = Actual lead time – Agreed lead time
A vendor that promises 14 days but takes 19 days is five days late against that target. Over time, look at the average absolute gap. This avoids early and late arrivals canceling each other out.
3.6 Price Variance and Invoice Accuracy
Price variance shows whether actual comparable unit costs match the agreed price.
Price variance (%) = ((Actual unit price – Agreed unit price) / Agreed unit price) x 100
For example, an item priced at $20 and billed at $20.60 has a 3% unfavorable gap. Before scoring, set rules for currency, unit size, tax, freight, and approved changes.
Invoice accuracy can be found by dividing invoice lines with no supplier-caused match issue by all eligible invoice lines. However, keep internal entry errors out of the vendor’s result.
3.7 Keep the Supplier KPI Dashboard Focused
| Primary KPI | Main business question |
|---|---|
| OTIF | Did we get the full order on time? |
| Quality acceptance | Was the received stock usable? |
| Cost control | Did pricing match agreed terms? |
| Lead-time stability | Could we plan around delivery times? |
| Invoice accuracy | Did the vendor bill us correctly? |
4. Build a Weighted Supplier Scorecard in Seven Steps
4.1 Step 1: Set the Goal and Review Period
Start with the business risk you need to reduce. For example, a wholesaler may want fewer stockouts. A factory may need more stable parts supply, while an online seller may care most about stock before a promotion.
Next, choose a monthly, quarterly, or rolling period that fits the order count. Keep that period the same for vendors you compare. Also, set a minimum order count so small samples do not seem as firm as long records.
4.2 Step 2: Pick the Five Main Supplier KPIs
A good starting mix is OTIF, quality acceptance, cost control, lead-time stability, and invoice accuracy. Together, they cover the main ways a vendor can help or hurt daily work.
4.3 Step 3: Link the ERP Source Records
Match PO lines to receipts, checks, and invoices using stable IDs. Also, keep the first due date and all valid changes. Make sure that one order with three receipts still counts as one line for a line-based OTIF test.
4.4 Step 4: Work Out Each Supplier Performance Rate
Use the formulas from section 3. Count only eligible, complete, on-time lines for OTIF. Next, measure quality by the share of inspected stock that passed. Finally, count supplier-caused billing errors against eligible invoice lines.
4.5 Step 5: Put Every KPI on a 0-100 Scale
A percentage such as OTIF already fits a 0-100 scale. However, measures such as lead-time gaps need a conversion rule.
For instance, a business might give a cost-control score of 100 for no unfavorable price gap and reduce it in steps as the gap grows. Under that rule, a 5% unfavorable gap earns zero, while a 1% gap earns 80. Still, this is only a sample; choose limits that fit your terms.
4.6 Step 6: Apply Weights and Calculate the Total Score
A weighted score gives more value to the KPIs that matter most for the business. Here is an example:
| KPI | Weight |
|---|---|
| OTIF | 30% |
| Quality acceptance | 25% |
| Cost control | 20% |
| Lead-time stability | 15% |
| Invoice accuracy | 10% |
| Total | 100% |
Overall supplier score = Sum of (KPI score x KPI weight)
Take a vendor with scores of 92 for OTIF, 98 for quality, 80 for cost, 85 for lead-time stability, and 95 for invoice accuracy. Its total is:
(92 x 0.30) + (98 x 0.25) + (80 x 0.20) + (85 x 0.15) + (95 x 0.10) = 90.35 out of 100.
In every case, weights must add up to 100%. However, if a KPI cannot be scored, show how the other weights were handled.
4.7 Step 7: Set Rating Bands and Agree on Action
A score has value only when the team knows what to do with it. Your firm might use these sample bands:
| Score | Rating | Next step |
|---|---|---|
| 90-100 | Preferred | Keep service steady; review order share |
| 80-89.99 | Approved | Watch known weak areas |
| 70-79.99 | Watchlist | Agree on a fix and due date |
| Below 70 | Review needed | Check risk and raise the issue |
However, these are sample limits, not rules for every industry. A supplier of vital parts may need far tighter service terms than a vendor of low-risk packing goods.
Next, name an owner, a fix, and a review date for each issue. Ultimately, the scorecard should guide vendor talks, not just create another report.
5. Supplier Scorecard Example: Compare Three Vendors
Suppose a wholesale firm buys similar items from three vendors. Then it uses the five weights from section 4 to score each vendor for the same period. All figures below are made up to show the math.
5.1 Calculate Each Supplier’s Weighted Score
| KPI score (0-100) | Weight | Supplier A | Supplier B | Supplier C |
|---|---|---|---|---|
| OTIF | 30% | 92 | 85 | 95 |
| Quality | 25% | 98 | 99 | 94 |
| Cost control | 20% | 80 | 90 | 75 |
| Lead-time stability | 15% | 85 | 75 | 90 |
| Invoice accuracy | 10% | 95 | 92 | 90 |
| Total score | 100% | 90.35 | 88.70 | 89.50 |
5.2 Read the KPIs, Not Just the Final Rank
Supplier C has the best OTIF score, so it may be a strong fit for urgent stock needs. By contrast, Supplier B leads on quality and cost but has weaker lead-time stability. Across the five KPIs, Supplier A scores well without leading every measure.
5.3 Show Sample Size and Supplier Risk
A vendor with five orders and a score of 95 does not have the same proof of steady service as one with 500 orders and a score of 92. Therefore, show order counts, spend, item group, and risks next to each score.
6. Use ERP Reports to Keep Supplier Scorecards Current
6.1 Excel vs. ERP Supplier Performance Reports
| Area | Spreadsheet | Connected ERP |
|---|---|---|
| Data entry | Often manual or scripted | Tied to daily records |
| PO and receipt links | Built by the user | May use shared record IDs |
| Multi-site view | Takes extra work | Depends on system setup |
| KPI updates | Manual or scheduled | Can be set up in reports |
| Source checks | Separate files may be needed | Users may drill into records |
ERP software does not make every source record correct by itself. However, teams still need rules for dates, errors, and missing data. In addition, some systems need extra setup for a weighted score.
6.2 Build a Supplier KPI Dashboard That Leads to Action
Keep the top of the dashboard clear: supplier name, overall score, five core KPIs, order count, and change from the last review. Below that, show late lines, short orders, rejected stock, and invoice issues.
Each result should link back to a PO, receipt, or invoice when possible. As a result, buyers can check a disputed score fast. In addition, a monthly trend helps separate one bad week from a lasting service drop.
6.3 Where Xorosoft Fits Into Connected Purchasing Data
Inventory-led firms often need purchasing, stock, warehouse, and finance data to work as one. XoroONE brings these daily tasks together in a cloud ERP setting. The goal is a more consistent record of orders, stock moves, and costs.
XoroERP also covers core purchasing, vendor, warehouse, accounting, and reporting work. Xorosoft can provide the base data for supplier reviews, while a specific weighted scorecard may need a set-up report or added logic. Therefore, confirm the features in a demo before buying.
6.4 Review ERP Options Against Real Buying Needs
Businesses looking at Xorosoft and other ERP tools can use the Xorosoft vs. NetSuite comparison as a starting point. Also, check current terms, fit, costs, and demo results. The best system is the one your team can use to make sound daily decisions.
7. Set Supplier Scorecard Priorities for Your Industry
7.1 Supplier Scorecards for Wholesale and Multi-Warehouse Teams
Wholesale firms often need stock at several sites. For example, one vendor may deliver well to the main warehouse but miss dates at a smaller depot. Therefore, track scores by site to find route, order, or receipt issues.
Tools such as XoroWMS support warehouse receipt and stock tasks that feed a clear view of goods on hand. Then use those records to check supplier results while separating vendor faults from internal delays.
7.2 Supplier KPI Tracking for Manufacturing
For key parts, review accepted units, late deliveries, and material shortages as a group. In particular, give weight to issues that stop work. Also, discuss the impact of each failure without making up financial claims.
7.3 Supplier Scorecards for Shopify and Amazon Sellers
Online sellers often have sharp demand peaks during a launch or sale. For example, a late inbound order may cause stockouts across channels, even when online data looks fine.
A supplier scorecard can track the vendors behind those risks. For businesses exploring a link between storefront orders and ERP stock data, the Xorosoft ERP app on the Shopify App Store offers more detail about its Shopify link. However, check the app’s current features before adopting it.
7.4 Fit the Supplier Rating Model to Product Risk
Apparel firms may care most about seasonal delivery and complete size and color sets. Meanwhile, furniture teams may focus on damage, missing parts, and long lead times. Likewise, food sellers may need lot details, shelf life, and safe handling.
For a wider view of how these needs differ, see ERP solutions by industry. The same data rules can serve many sectors, but the KPI weights and pass levels should fit each item group.
8. Frequently Asked Questions About Supplier Scorecards
8.1 What Is a Supplier Scorecard?
A supplier scorecard is a report that shows how well a vendor meets agreed needs. It often covers delivery, goods quality, costs, and invoice accuracy. As a result, buyers use the scores to find weak areas, compare vendors, and plan next steps.
8.2 Why Use ERP Data for a Supplier Scorecard?
ERP records show what was ordered, what arrived, and what was billed. That makes a scorecard easier to check than one built from memory or email notes. For example, you can link PO lines with receipts and invoices to find late, short, or costly orders. Even so, clear rules matter when data comes from one system.
8.3 Which ERP Fields Are Needed for a Supplier Scorecard?
Start with vendor ID, PO and line ID, item, ordered units, first due date, arrival date, and accepted units. Next, add quality results and invoice prices if those measures are included. Also, keep warehouse site, order status, and reason codes to trace issues.
8.4 Which Supplier KPIs Should a Scorecard Track?
Five useful core measures are OTIF, quality acceptance, cost control, lead-time stability, and invoice accuracy. They cover how well a vendor supplies usable stock at the agreed time and price. For example, you can add fill rate or on-time delivery as detail. Choose KPIs that affect buying choices, not simply those that are easy to export.
8.5 Who Should Use Supplier Performance Reports?
Purchasing leads, warehouse teams, finance staff, and quality teams all gain from a clear view of vendor results. In particular, the need is highest when poor goods can stop work or delay orders.
8.6 Does Every Business Need a Complex Supplier Scorecard?
No. A small firm with a few steady vendors may do well with a short spreadsheet and a monthly check. Still, the method matters more than the software at that stage. As order count, item range, or site count grows, a linked report may save time and reduce errors. Keep the model as simple as the risk allows.
8.7 How Much Purchase History Should You Include?
Use enough orders to show a fair pattern. For example, a high-volume vendor may have useful monthly data, while a vendor that ships twice a year needs longer. Therefore, show the count of eligible orders next to each score. A result based on five lines should not be treated as firm proof in the same way as one based on hundreds.
8.8 How Do You Work Out On-Time Delivery?
Count the eligible PO lines that arrived by the agreed due date. Then divide that count by eligible lines due and multiply by 100. If 92 of 100 lines were on time, the rate is 92%. Finally, define the arrival date and keep overdue open lines in the report.
8.9 How Is Supplier OTIF Calculated?
OTIF means on time in full. Count order lines where the full accepted amount arrived by the due date, then divide by all eligible due lines and multiply by 100. However, a short shipment fails the in-full test unless the rest arrives by the cutoff. OTIF is useful because a shipment can be on time but still leave buyers short of stock.
8.10 What Is the Supplier Fill Rate Formula?
Divide the accepted units received by the cutoff by the units due, then multiply by 100. For example, 950 usable units against 1,000 due gives a 95% fill rate. Next, decide whether you are checking the first shipment or the full period. Those are different measures, and the same term should not switch meaning across reports.
8.11 How Can You Measure Vendor Quality?
One basic test is the share of inspected goods that passed. Divide accepted inspected units by all inspected units and multiply by 100. In addition, you can track damaged units, repeat faults, and supplier-caused returns. Therefore, match the measure to product risk.
8.12 How Do You Measure Lead-Time Variance?
Find the actual number of days from the agreed start date to arrival. Then subtract the promised lead time to find the gap. To compare how steady vendors are, use the average absolute gap across eligible orders. That stops early and late shipments from canceling each other out. Finally, use the same date rule for every vendor in a group.
8.13 Should Price Variance Affect a Supplier Rating?
Yes, when the gap comes from a vendor breaking agreed price terms. First, compare the actual price with the agreed price using the same currency and units. Leave out approved changes, tax effects, and errors made by your team. A good cost score should show real vendor behavior rather than noise from the books.
8.14 Should Invoice Errors Count Against Vendors?
They can, if the error came from the vendor. For example, wrong billed units, repeat bills, and unapproved price changes create extra work. First check whether a mismatch came from an internal PO error or a valid change. Reason codes help make the score fair and point the team toward the right fix.
8.15 What Is a Weighted Supplier Scorecard?
A weighted scorecard gives each KPI a share of the total. For example, OTIF may count for 30%, quality for 25%, and the rest for cost, lead time, and billing. Next, convert each KPI to a 0-100 score, apply its weight, and add the results. All weights should total 100%, with clear rules for missing measures.
8.16 How Should You Choose KPI Weights?
Start with what a vendor failure costs the business in time, stock, or risk. For example, a factory may give quality more weight. Let buyers, warehouse staff, finance, and quality teams help set the mix. Do not change weights just to raise a favored vendor’s rank.
8.17 What Counts as a Good Supplier Score?
There is no single score that fits every firm. For example, a score above 90 may suit one item group but be too weak for a vital part. Set bands based on the risk, past data, and agreed terms. Always check the KPIs behind the total, along with order count and recent trends, before you label a vendor good or bad.
8.18 How Should Partial Shipments Be Scored?
For strict OTIF, a line passes only when the full required amount arrives by the due date. However, fill rate still shows what share arrived in time. If 700 of 1,000 units arrive before the cutoff, the line fails OTIF but has a 70% on-time fill rate. Keep both views so buyers can see the size of the shortfall.
8.19 Do Canceled POs Count as Vendor Failures?
That depends on why the order was canceled. For example, a buyer may drop an order before the vendor has a firm duty to ship. That should not be scored like a vendor who accepted the work and then could not supply it. Therefore, save the reason, date, and approval trail. Use the same rule for all vendors with similar orders.
8.20 How Do You Compare Vendors With Different Order Volumes?
Use rates instead of raw late-order counts, then show how many orders support each rate. For example, five late lines out of ten is far worse than five out of 500. Also, compare similar item groups where possible. Order size, lead time, product risk, and source limits may also affect what a fair rating looks like.
8.21 Can You Track Supplier Scores by Warehouse?
Yes, when PO and receipt records show the right site. For example, this can reveal whether a vendor struggles on one route or location. It can also show issues caused inside a warehouse, such as late posting. First, check the source before blaming the vendor. Site-level scores should add detail, not create a second set of unfair rules.
8.22 How Often Should a Supplier Scorecard Be Updated?
High-volume or high-risk vendors may need weekly checks, while many firms can use a monthly report and a deeper review each quarter. Therefore, pick a pace that fits your buying cycle. An automatic data refresh can help, but someone still needs to review unusual results, raise issues, and track whether agreed fixes actually work.
8.23 Is Excel Good Enough for Supplier Tracking?
It often is for a small vendor group with clean, easy-to-export data. For example, Excel can work out KPI rates, weights, and simple charts. However, the work grows with many PO lines, split receipts, sites, and exports. At that stage, linked ERP reports may save time and make each result easier to trace.
8.24 Can ERP Software Build Supplier Scorecards on Its Own?
ERP software can hold much of the data a scorecard needs, but the ready-made features vary. For example, some tools include vendor scoring, while others need custom reports. Therefore, ask to see KPI rules, date fields, receipt links, and source detail in a demo. Do not assume a weighted score is built in just because a system has purchasing reports.
8.25 What Are the Biggest Supplier Scorecard Mistakes?
Common mistakes include using revised due dates as if they were original promises, calling short orders complete, and giving missing data a perfect mark. In addition, giving OTIF, on-time delivery, and fill rate too much weight can distort scores. Poor source links and warehouse delays can skew results as well. Clear rules and sample checks help prevent these errors.
8.26 When Should a Team Move From Spreadsheets to ERP Reports?
Consider a change when buyers spend hours joining PO, receipt, and invoice exports or cannot trace a score back to an order. Also, several sites, high order volume, and repeat data errors are signs. First list the reports and date rules you need. Then test real supplier cases in the new system before you commit.
9. Put Supplier Scorecard Results to Work Over 90 Days
The value of a supplier scorecard comes from what changes after the review. First, start small, prove the rules, and use scores to guide better orders and supplier talks.
9.1 Days 1-30: Set the Data Rules
Pick the key vendors and five core KPIs. Next, check vendor IDs, first due dates, receipt links, and quality records. Decide how to handle canceled orders, partial receipts, and missing fields. Finally, give each data source an owner.
9.2 Days 31-60: Test the Supplier Scorecard
Run a pilot with a small vendor group. Then check sample PO lines by hand and compare results with staff feedback. Where a score looks wrong, find the cause before changing the report rule. Afterward, document each fix so the next review uses the same method.
9.3 Days 61-90: Review Results and Set Next Steps
Share the scorecard with vendors, starting with the facts behind the lowest measures. Next, agree on fixes, owners, and follow-up dates. Finally, keep tracking the same KPIs to see whether service gets better.
If the process still needs hours of manual exports, it may be time to review the ERP reporting set-up. Xorosoft is one option for firms that want linked purchasing, stock, warehouse, and finance records, but the best choice depends on real needs and verified features.
9.4 Make Supplier Reviews a Routine, Not a One-Time Report
Monthly or quarterly reviews help buyers catch weak trends before they affect customers. However, do not move all spend because of a small score gap or a few orders. Instead, look at volume, risk, stock needs, and the cause of each issue.
A strong supplier scorecard gives teams a shared view of what was promised, what arrived, and what must improve. When the rules are fair and the records can be checked, the score becomes a tool for better buying rather than just another chart.
Talk to Xorosoft about your purchasing workflow. If your team spends too much time joining PO, receipt, and invoice reports, contact Xorosoft to discuss ERP, stock, and warehouse needs. For example, bring a real supplier case to test how the system fits your work.
Frequently Asked Questions
What is a supplier scorecard?
A supplier scorecard tracks delivery, quality, cost, and other vendor results against agreed targets. Buyers use it to compare suppliers and spot problems.
How do you build a supplier scorecard using ERP data?
Select KPIs, join ERP purchase orders with receipts and invoices, verify the data, calculate scores, apply weights, and review results with suppliers.
Which ERP purchasing records are needed?
Use vendor IDs, PO lines, promised dates, quantities, receipt records, inspection outcomes, and invoice prices. Keep original delivery dates to identify delays.
What KPIs should a supplier scorecard include?
Track OTIF, quality acceptance, lead-time stability, cost control, and invoice accuracy. Choose weights based on business risk and avoid duplicate delivery metrics.
How do you calculate a weighted supplier score?
Convert each KPI to a 0–100 score, multiply by its weight, and total the results. Weights must add up to 100%.
Can ERP software automate supplier scorecards?
ERP systems can connect purchase orders, receipts, and invoices for regular reports. Some platforms need custom setup for weighted supplier scoring.
How often should supplier performance be reviewed?
Review key suppliers monthly, investigate urgent issues sooner, and conduct quarterly improvement discussions. Match the schedule to purchasing volume and supplier risk.
Recent Posts
-
 Inbound Receiving Statistics 2026: Shortages, Rejections, and Receipt Accuracy
-
 ERP for Industrial Equipment Manufacturers Managing Long Production Cycles
-
 How to Build a Supplier Scorecard Using ERP Purchasing Data
-
 Shopify Reserved vs Committed Inventory: What Changed in 2026?
-
 What Is a Forward-Pick Location and When Should Stock Be Replenished?