If you want to understand inventory management, it’s important to learn about weeks of supply.
1. Weeks of Supply Turns Inventory Into Time
Weeks of supply tells you how long your available inventory can support expected demand. Therefore, instead of looking at 2,000 units and wondering whether that amount is high or low, you can translate inventory into time. That makes purchasing decisions much easier to understand.
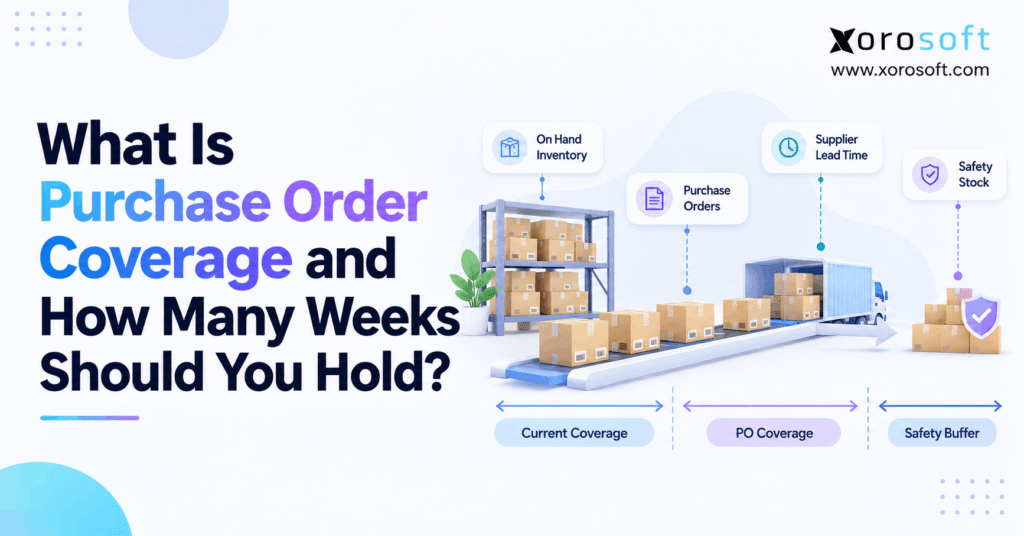
However, current stock tells only part of the story. Buyers also need to know what is already on order, when those purchase orders should arrive, how quickly customers will consume stock, and whether demand will change before the next shipment reaches the warehouse.
As a result, purchase order coverage is more useful when it combines current inventory with future supply and expected demand.
The goal is not to hold the highest possible weeks of supply. Instead, the goal is to keep enough coverage to protect availability while avoiding unnecessary stock, warehouse pressure, and working-capital exposure.
1.1 Why a Fixed Number of Weeks Can Mislead Buyers
Eight weeks of inventory can be healthy for one SKU and dangerous for another.
For example, a domestic supplier may replenish a product within seven days. Therefore, eight weeks could represent unnecessary inventory.
Meanwhile, an imported item may require 12 weeks for production, freight, customs, and receiving. Consequently, the same eight weeks could leave the business exposed to a shortage.
Because of this difference, buyers should never ask only, “How many weeks should we hold?”
Instead, they should ask:
“How many weeks do we need to remain covered until reliable replenishment arrives?”
1.2 Weeks of Supply vs Purchase Order Coverage
Weeks of supply usually begins with inventory that is already available.
The basic formula is:
Weeks of Supply = Available Inventory ÷ Average Weekly Demand
Purchase order coverage goes further. Specifically, it asks whether current stock and confirmed future supply can support demand across the replenishment timeline.
Therefore:
- Current coverage measures inventory available now.
- Projected coverage considers confirmed inbound supply.
- Future coverage also considers changing demand.
This distinction becomes increasingly important as purchasing complexity grows.
2. How to Calculate Weeks of Supply Correctly
2.1 The Basic Weeks of Supply Formula
Suppose a distributor has 1,200 available units of a product. Meanwhile, customers buy approximately 150 units each week.
The calculation is:
1,200 ÷ 150 = 8 weeks of supply
Therefore, current inventory should support approximately eight weeks of demand if the sales rate remains stable.
However, the calculation becomes unreliable when either input is wrong.
For that reason, buyers need a clear definition of both available inventory and weekly demand.
2.2 Which Inventory Should Count?
Physical inventory does not always equal sellable inventory.
For example, imagine the warehouse contains:
| Inventory Status | Units |
|---|---|
| Physical on hand | 1,400 |
| Damaged | 100 |
| Reserved | 150 |
| Quality hold | 50 |
| Available inventory | 1,100 |
Therefore, using 1,400 units would overstate coverage.
At 150 units of weekly demand, 1,400 units suggests 9.3 weeks of supply. However, 1,100 available units provide only about 7.3 weeks.
Consequently, buyers should calculate coverage using inventory that can realistically satisfy demand.
2.3 Which Demand Period Should You Use?
The demand window matters just as much.
For example, a four-week average reacts quickly to recent changes. However, one promotion can distort it.
In contrast, a 13-week average creates more stability. Nevertheless, it may react too slowly when demand begins accelerating.
Therefore, stable products may work well with recent historical demand. Meanwhile, seasonal or rapidly changing products usually need a forecast.
Shopify’s inventory planning guide also explains weeks of supply as an inventory-planning metric based on current inventory and average weekly units sold.
3. Weeks of Supply Changes When Purchase Orders Are Added
3.1 Current Weeks of Supply vs Projected Coverage
Once open purchase orders enter the calculation, timing becomes critical.
A useful planning formula is:
Projected Inventory Position = Available Inventory + Confirmed Inbound Supply − Committed Demand
Then:
Projected Coverage = Projected Inventory Position ÷ Forecast Weekly Demand
However, this formula should never hide arrival dates.
For example, suppose you have:
- 500 available units
- 100 units of demand per week
- 1,000 units on a purchase order
At first glance, total inventory appears to provide 15 weeks of coverage.
However, if the PO arrives in eight weeks, current stock will run out after five weeks.
Therefore, the business still faces a three-week shortage.
3.2 Open POs Should Not Automatically Count as Available Stock
An approved PO does not guarantee immediate availability.
Instead, buyers should consider:
- promised ship date
- expected arrival date
- supplier reliability
- freight time
- customs delays
- receiving time
- partial shipments
- quantity changes
Consequently, a PO arriving tomorrow should carry much more weight in a near-term decision than one arriving three months from now.
Likewise, an overdue PO should not create false confidence simply because the quantity still appears in the purchasing system.
3.3 Committed Demand Can Reduce Weeks of Supply Quickly
Sales commitments matter as well.
Suppose a wholesaler has 4,000 available units and normally sells 500 units each week.
Initially:
4,000 ÷ 500 = 8 weeks
However, a customer has already committed to purchasing 1,500 units.
Therefore, only 2,500 units remain available for other demand.
Now:
2,500 ÷ 500 = 5 weeks
As a result, the purchasing position changes immediately even though physical inventory has not changed yet.
4. How Many Weeks of Supply Should You Hold?
4.1 Start Weeks of Supply With Supplier Lead Time
There is no universal four-, eight-, or twelve-week target.
Instead, supplier lead time should form the starting point.
Suppose a supplier needs six weeks from PO placement to warehouse availability. Therefore, waiting until three weeks remain before ordering creates a likely shortage unless other inventory is already inbound.
By contrast, a supplier that replenishes in five days creates much less exposure.
Consequently, target coverage should reflect how long replacement stock actually takes to become usable.
4.2 Add Safety Stock to Weeks of Supply
Lead time alone is not enough because supply chains rarely behave perfectly.
For example, production can run late. Likewise, freight can slow down, demand can spike, or suppliers can ship fewer units than expected.
Therefore, businesses often maintain safety stock or an equivalent time buffer.
A useful planning relationship is:
Target Coverage ≈ Replenishment Lead Time + Appropriate Safety Buffer
However, the safety buffer should reflect actual risk.
Stable products from reliable nearby suppliers may need less protection. In contrast, volatile products with long international lead times may require more.
4.3 Reorder Frequency Also Changes the Target
Purchasing cadence matters as well.
For example, a team that reviews replenishment every day can respond quickly. Meanwhile, another business may consolidate supplier orders once per month.
Therefore, the second business may need more inventory coverage even when both companies use the same supplier.
Similarly, minimum order quantities can force coverage above the theoretical target.
As a result, the correct answer depends on both inventory risk and commercial purchasing constraints.
5. Weeks of Supply vs Forward Weeks of Supply
5.1 Historical Weeks of Supply Looks Backward
Traditional weeks of supply commonly uses recent sales history.
For example:
Current Inventory ÷ Historical Average Weekly Demand
That works well when demand remains stable.
However, historical averages can become misleading before seasonal peaks, large promotions, launches, or channel expansion.
Therefore, buyers should not assume that last month’s sales rate represents next month’s demand.
5.2 Forward Weeks of Supply Looks Ahead
Forward weeks of supply uses forecast demand rather than relying only on historical velocity.
For example:
- Current inventory: 600 units
- Historical demand: 100 per week
- Historical WOS: 6 weeks
- Forecast demand: 150 per week
- Forward WOS: 4 weeks
Therefore, historical coverage looks comfortable while future coverage indicates more urgency.
As a result, businesses that face promotions, seasonal patterns, or fast growth should combine inventory coverage with demand planning and broader operational solutions rather than relying on one backward-looking metric.
5.3 Weeks of Supply Should Reflect the Demand You Expect
The key principle is simple.
If future demand should resemble historical demand, traditional WOS can work well.
However, when the future looks different, the forecast should influence the purchasing decision.
For example, apparel teams may need to account for seasonality. Meanwhile, wholesale distributors may know that a large customer order will arrive next month.
Consequently, coverage should follow expected demand rather than blindly repeating historical averages.
6. Set Minimum, Target, and Maximum Weeks of Supply
6.1 Minimum Weeks of Supply
A single exact target can create false confidence.
Instead, businesses can define a minimum coverage level.
The minimum represents the point at which purchasing should investigate the SKU.
For example, coverage below the supplier’s replenishment window may indicate a growing shortage risk.
Therefore, the buyer should review open POs, expected dates, demand forecasts, available transfers, and expedite options.
6.2 Target Weeks of Supply
The target range represents the normal operating position.
Ideally, it protects customer availability without creating unnecessary inventory.
However, the target should differ across product groups when lead times, demand patterns, margins, or supplier reliability differ.
Therefore, buyers may set separate policies for:
- stable replenishment items
- seasonal items
- imported products
- high-value goods
- slow movers
- critical manufacturing materials
This approach creates more useful purchasing rules than one company-wide target.
6.3 Maximum Weeks of Supply
Maximum coverage acts as an excess-stock warning.
When inventory rises above that point, teams should investigate the cause before ordering more.
For example, demand may have slowed. Alternatively, a supplier may have delivered too much.
Likewise, duplicate POs, forecast errors, cancelled customer orders, or oversized minimum order quantities may push stock above target.
Therefore, the maximum level protects cash as well as warehouse capacity.
| Coverage Zone | Meaning | Typical Action |
|---|---|---|
| Below minimum | Shortage exposure | Review, expedite, reorder, transfer |
| Near minimum | Reorder window | Validate demand and PO timing |
| Target range | Balanced position | Monitor |
| Above maximum | Excess exposure | Delay, reduce, or rebalance supply |
7. Weeks of Supply Examples for Real Inventory Decisions
7.1 Weeks of Supply for a Stable Ecommerce SKU
Suppose an ecommerce business has:
- 1,000 available units
- 100 units of weekly demand
- four-week supplier lead time
Therefore:
1,000 ÷ 100 = 10 weeks of supply
Because current coverage exceeds lead time, the buyer may not need another PO immediately.
However, the team should still consider safety stock, upcoming promotions, and current inbound supply.
Moreover, if the business sells across several channels, inventory should remain synchronized before the buyer trusts the number.
For Shopify merchants, Xorosoft’s Shopify App Store listing provides an external reference for its ERP integration and inventory-sync capabilities.
7.2 Weeks of Supply for Seasonal Apparel
Consider an apparel SKU approaching peak season.
- Inventory: 800 units
- Historical demand: 100 per week
- Historical WOS: 8 weeks
- Forecast demand: 200 per week
- Forward WOS: 4 weeks
Therefore, using only historical demand overstates usable coverage by half.
Additionally, apparel teams need to consider size and color.
A style may look healthy in total while popular variants approach zero.
Consequently, effective inventory planning should drill below the style level when customer demand occurs at the SKU level.
7.3 Weeks of Supply for an Imported Product
Now consider a product with a 12-week replenishment cycle.
Current inventory equals eight weeks of demand. Meanwhile, another eight weeks of supply should arrive six weeks from now.
Although current WOS sits below total lead time, the incoming PO arrives before existing inventory should run out.
Therefore, the timeline may still be healthy.
However, a two-week supplier delay would reduce that protection sharply.
Consequently, supplier reliability matters alongside the mathematical coverage number.
8. Multi-Warehouse Weeks of Supply Needs Location-Level Analysis
8.1 Company-Wide Weeks of Supply Can Hide a Stockout
Suppose a company has two warehouses.
| Warehouse | Inventory | Weekly Demand | Weeks of Supply |
|---|---|---|---|
| East | 200 | 100 | 2 |
| West | 1,400 | 100 | 14 |
| Total | 1,600 | 200 | 8 |
Overall, eight weeks appears healthy.
However, the East warehouse will run out in only two weeks.
Therefore, the company does not necessarily need another purchase order. Instead, it may need a transfer from West to East.
As a result, purchasing teams should calculate coverage where fulfillment decisions happen.
8.2 Warehouse Execution Affects Coverage Accuracy
Even a strong planning formula fails when warehouse records are inaccurate.
For example, missed receipts, delayed transfers, picking errors, or incorrect adjustments can distort available inventory.
Therefore, accurate warehouse management through XoroWMS can support a cleaner inventory picture when warehouse operations become complex.
Similarly, Xorosoft can connect warehouse activity with inventory and purchasing data rather than leaving teams to reconcile separate files.
Consequently, the operational system behind WOS matters once scale increases.
9. Common Weeks of Supply Mistakes
9.1 Counting Every Open PO as Guaranteed Inventory
One of the biggest errors is treating every open PO as if the goods were already available.
However, supplier delays, partial shipments, freight changes, and receiving issues can shift arrival dates.
Therefore, buyers should include expected timing when calculating projected coverage.
Moreover, overdue supply should trigger attention rather than quietly extending theoretical WOS.
9.2 Ignoring Reserved or Allocated Inventory
Physical on-hand inventory may already belong to customers.
For example, wholesale orders, marketplace allocations, reservations, and sales orders can reduce what remains available.
Consequently, teams should distinguish physical stock from available stock.
Otherwise, the business may believe it has more coverage than it can actually use.
9.3 Using Stockout Weeks as Normal Demand
Historical sales can also understate real demand when the product was unavailable.
For example, a SKU cannot record 100 units of sales during a week when inventory was zero.
Therefore, including the zero without context can reduce the average demand rate.
As a result, future WOS may look artificially high, which can cause repeated under-ordering.
9.4 Giving Every SKU the Same Target
Products do not share identical economics.
For example, imported furniture and locally sourced accessories can have completely different replenishment cycles.
Likewise, food has shelf-life concerns while apparel carries markdown and seasonality risk.
Therefore, one company-wide WOS target usually sacrifices useful detail.
Instead, classify SKUs by demand, lead time, value, risk, or supplier profile.
10. Weeks of Supply Across Ecommerce, Wholesale, and Manufacturing
10.1 Ecommerce Coverage Changes Quickly
Ecommerce demand can change because of promotions, paid media, viral products, launches, or seasonal events.
Therefore, buyers should refresh coverage frequently for fast-moving SKUs.
Additionally, businesses selling through several storefronts need consistent inventory data across channels.
Xorosoft’s integration ecosystem can help connect commerce and operational workflows when businesses need inventory, orders, purchasing, and ERP data to move between systems.
10.2 Wholesale Weeks of Supply Must Include Commitments
Wholesale demand often arrives in larger blocks.
For example, one EDI order may consume several weeks of normal inventory.
Therefore, confirmed orders should influence available coverage before the warehouse ships them.
Likewise, customer-specific allocation policies can affect which inventory is truly available to other buyers.
As a result, wholesale teams should monitor both average demand and known future commitments.
10.3 Manufacturing Coverage Includes Material Demand
Manufacturers need coverage for raw materials as well as finished goods.
For example, finished-goods inventory may show six weeks of supply while a critical component has only three.
If that component requires seven weeks to replenish, production can stop before finished goods run out.
Therefore, purchasing needs visibility into BOM demand, production plans, work orders, and incoming materials.
For businesses with broader operational needs, XoroERP connects inventory, purchasing, manufacturing, financials, and related ERP workflows.
10.4 Different Industries Need Different Coverage Policies
Coverage targets should also reflect industry conditions.
For example:
- Apparel must consider seasons and variants.
- Furniture must consider long lead times and storage.
- Food must consider expiry and shelf life.
- Sporting goods may face seasonal peaks.
- Wholesale distributors must consider customer commitments.
- Manufacturers must protect critical materials.
Therefore, companies should align coverage rules with the realities of the industries they operate in.
11. When Weeks of Supply Outgrows Spreadsheets
11.1 The Formula Is Simple, but the Inputs Become Complex
A spreadsheet can calculate weeks of supply easily.
However, consider a company managing:
- 8,000 SKUs
- four warehouses
- Shopify
- Amazon
- wholesale
- EDI
- hundreds of open POs
- variable supplier lead times
- forecasts
- manufacturing demand
At that point, the company is not managing 8,000 calculations.
Instead, it is managing thousands of SKU-location-demand-supply combinations that change continuously.
Therefore, maintaining trustworthy coverage becomes a data problem rather than a spreadsheet-formula problem.
11.2 Every Inventory Event Can Change Coverage
Coverage changes when the business:
- sells inventory
- reserves inventory
- receives a PO
- transfers stock
- adjusts inventory
- creates a sales order
- changes a forecast
- updates a delivery date
- consumes material in production
Therefore, static spreadsheets can fall behind quickly.
Additionally, manual exports create timing gaps between operations and purchasing decisions.
As a result, teams can place new POs while another department is already receiving, transferring, or allocating the inventory they need.
11.3 Connected ERP Becomes More Useful at Scale
This is where a connected ERP can reduce manual reconciliation.
For example, XoroONE brings inventory, purchasing, accounting, ecommerce, reporting, and other operational workflows into one cloud ERP environment.
Moreover, Xorosoft can support replenishment decisions using shared operational data instead of isolated purchasing sheets.
Therefore, the value is not that ERP changes the WOS formula. Rather, ERP can improve the freshness and consistency of the inputs behind the formula.
12. What Your System Should Track for Accurate Weeks of Supply
12.1 Inventory Status
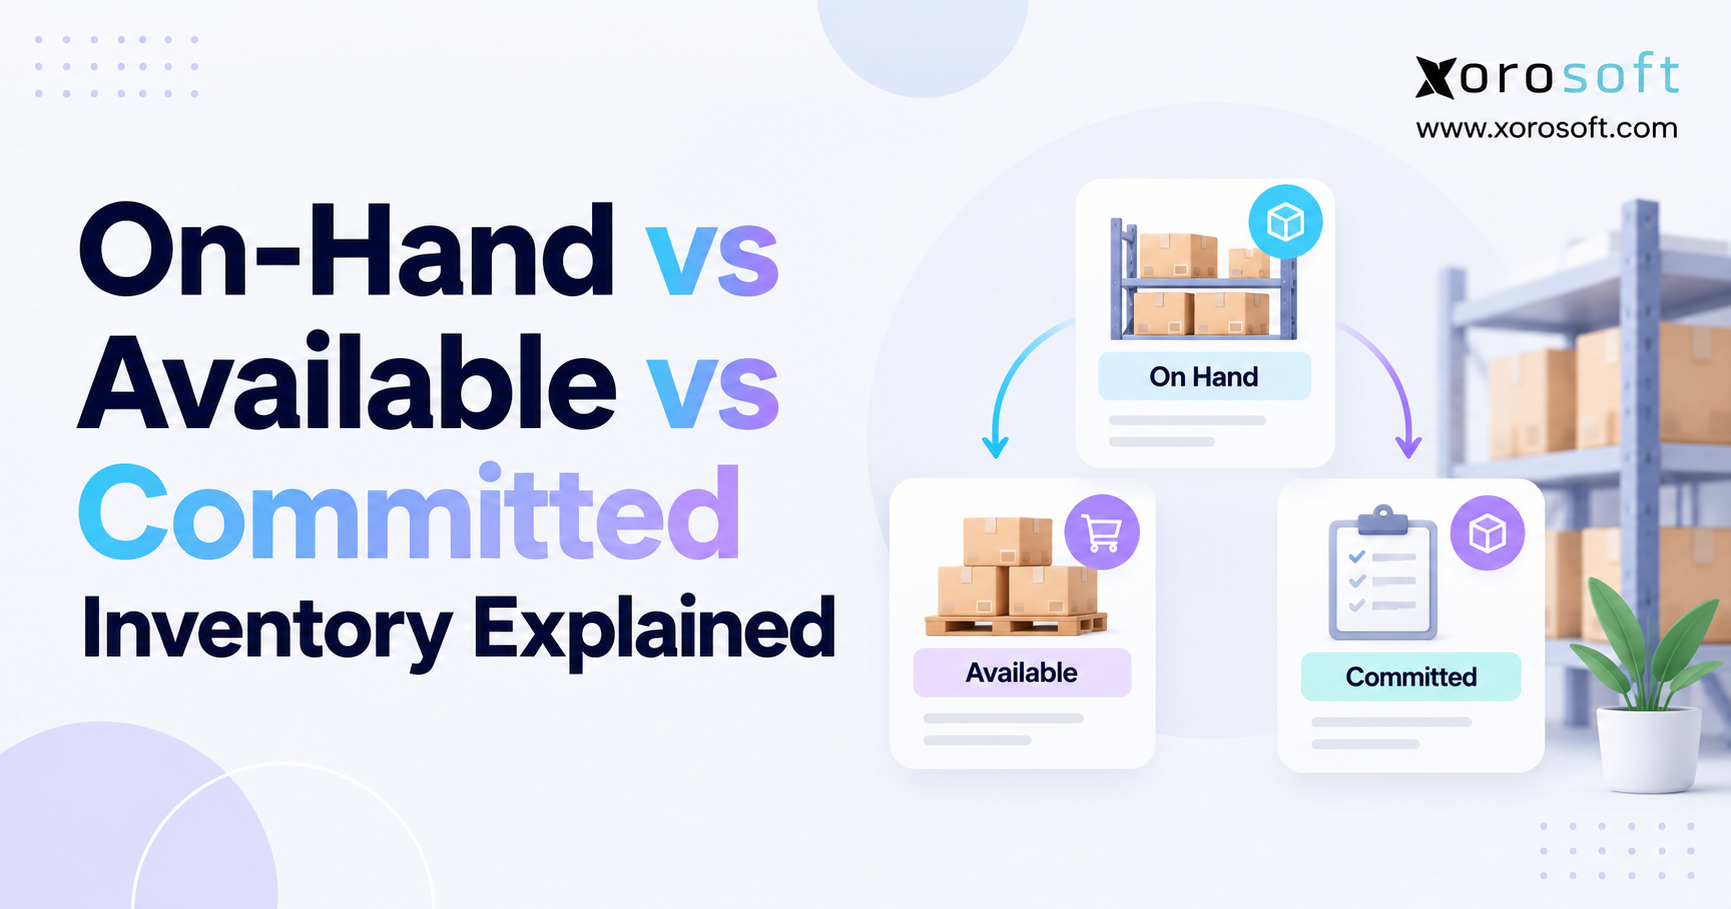
First, the system should distinguish between:
- on hand
- available
- allocated
- reserved
- damaged
- in transit
- on purchase order
Therefore, purchasing teams avoid treating every physical unit as sellable.
Likewise, location-level visibility helps prevent excess inventory in one warehouse from hiding shortages elsewhere.
12.2 Purchase Order Status
Second, buyers need more than the original PO quantity.
Instead, they should see:
- quantity ordered
- quantity received
- remaining quantity
- supplier
- destination
- expected delivery
- current status
Consequently, projected inventory reflects what should actually arrive.
12.3 Forecast and Lead-Time Data
Third, buyers need expected demand and replenishment timing.
Without those inputs, WOS stays descriptive rather than predictive.
Therefore, a strong system should connect inventory planning with forecasts, supplier lead times, safety stock, and purchasing rules.
Xorosoft’s broader operational solutions are designed around connected inventory-driven workflows rather than separate departmental data sets.
13. Turn Weeks of Supply Into an Action Framework
13.1 When Coverage Falls Below Lead Time
If WOS falls below the replenishment window, investigate immediately.
However, do not automatically create another PO.
First, check:
- existing inbound POs
- expected delivery dates
- warehouse transfers
- forecast changes
- available supplier stock
- expedite options
Therefore, the right response may be to transfer, expedite, reorder, or adjust demand plans.
13.2 When Coverage Sits Inside the Target Range
When coverage stays inside the target band, avoid unnecessary action.
Instead, continue monitoring demand, supplier timing, and future commitments.
Meanwhile, review upcoming promotions or large wholesale orders because they can change forward coverage quickly.
Consequently, “healthy” should mean healthy against the next planning period, not merely healthy today.
13.3 When Weeks of Supply Becomes Too High
High WOS deserves attention as well.
For example, excess coverage may result from:
- slowing sales
- duplicated purchasing
- oversized MOQ
- cancelled orders
- forecast error
- supplier overdelivery
Therefore, buyers should review future POs before adding more inventory.
In some cases, delaying a PO or transferring stock may protect working capital more effectively than another purchase.
14. Build Coverage Around Risk, Not a Universal Number
Weeks of supply works best when it turns inventory into a clear time-based planning signal.
However, a useful coverage model must go beyond one formula. It should connect available stock, committed demand, forecast demand, open POs, supplier lead times, safety stock, and warehouse location.
Therefore, an eight-week target should never become a rule simply because it worked for another business.
Instead, build minimum, target, and maximum coverage ranges around each SKU’s real replenishment conditions.
Moreover, refresh those assumptions when demand, suppliers, seasons, channels, or fulfillment networks change.
For smaller operations, spreadsheets may remain adequate. However, once inventory spans multiple warehouses, channels, suppliers, purchasing teams, or manufacturing requirements, a connected ERP can reduce the manual work required to maintain a trustworthy planning picture.
Xorosoft brings inventory, purchasing, warehouse management, forecasting, ecommerce, manufacturing, and accounting into connected workflows for inventory-driven businesses.
Therefore, if your team spends more time reconciling inventory data than making purchasing decisions, it may be time to evaluate a more connected process.
Book a Demo to see how Xorosoft can support inventory, purchasing, forecasting, and multi-warehouse operations.
FAQs
What is weeks of supply?
Weeks of supply measures how many weeks available inventory can support expected demand. Divide available stock by average weekly demand to calculate the basic figure.
What is purchase order coverage?
Purchase order coverage considers current inventory, expected inbound POs, committed demand, and future consumption to determine whether stock can support demand through the replenishment period.
How many weeks of supply should I hold?
There is no universal target. Instead, base coverage on supplier lead time, safety stock, demand variability, reorder frequency, MOQ, shelf life, and supplier reliability.
Should open purchase orders count in weeks of supply?
Open POs can count toward projected coverage. However, keep them separate from current available inventory and consider their expected receipt dates before relying on them.
What is forward weeks of supply?
Forward weeks of supply uses forecast demand instead of only historical sales. Therefore, it becomes especially useful for seasonal products, promotions, launches, and changing demand.
Can weeks of supply be too high?
Yes. Excessive coverage can indicate overbuying, slowing demand, oversized MOQs, or forecast errors. Consequently, it can tie up cash and increase aging risk.
Can ERP software calculate inventory coverage?
Yes. When ERP connects inventory, purchasing, forecasts, lead times, sales commitments, and locations, it can support more reliable current and projected inventory coverage.
Recent Posts
-
 Inventory Close Benchmarks 2026: Reconciliations, Adjustments, and Processing Time
 -
 B2B E-Commerce Platform for U.S. and Canadian Wholesale Operations: Accounts, Currency, Tax Status, and Ship-Tos
 -
 One Inventory Pool for Shopify and Amazon: Rules for Availability, Reservations, and Reconciliation
 -
 On-Hand vs Available vs Committed Inventory Explained
 -
 Dock Scheduling: How a Distributor Cut Dock Congestion With Scheduled Receiving and Cross-Docking