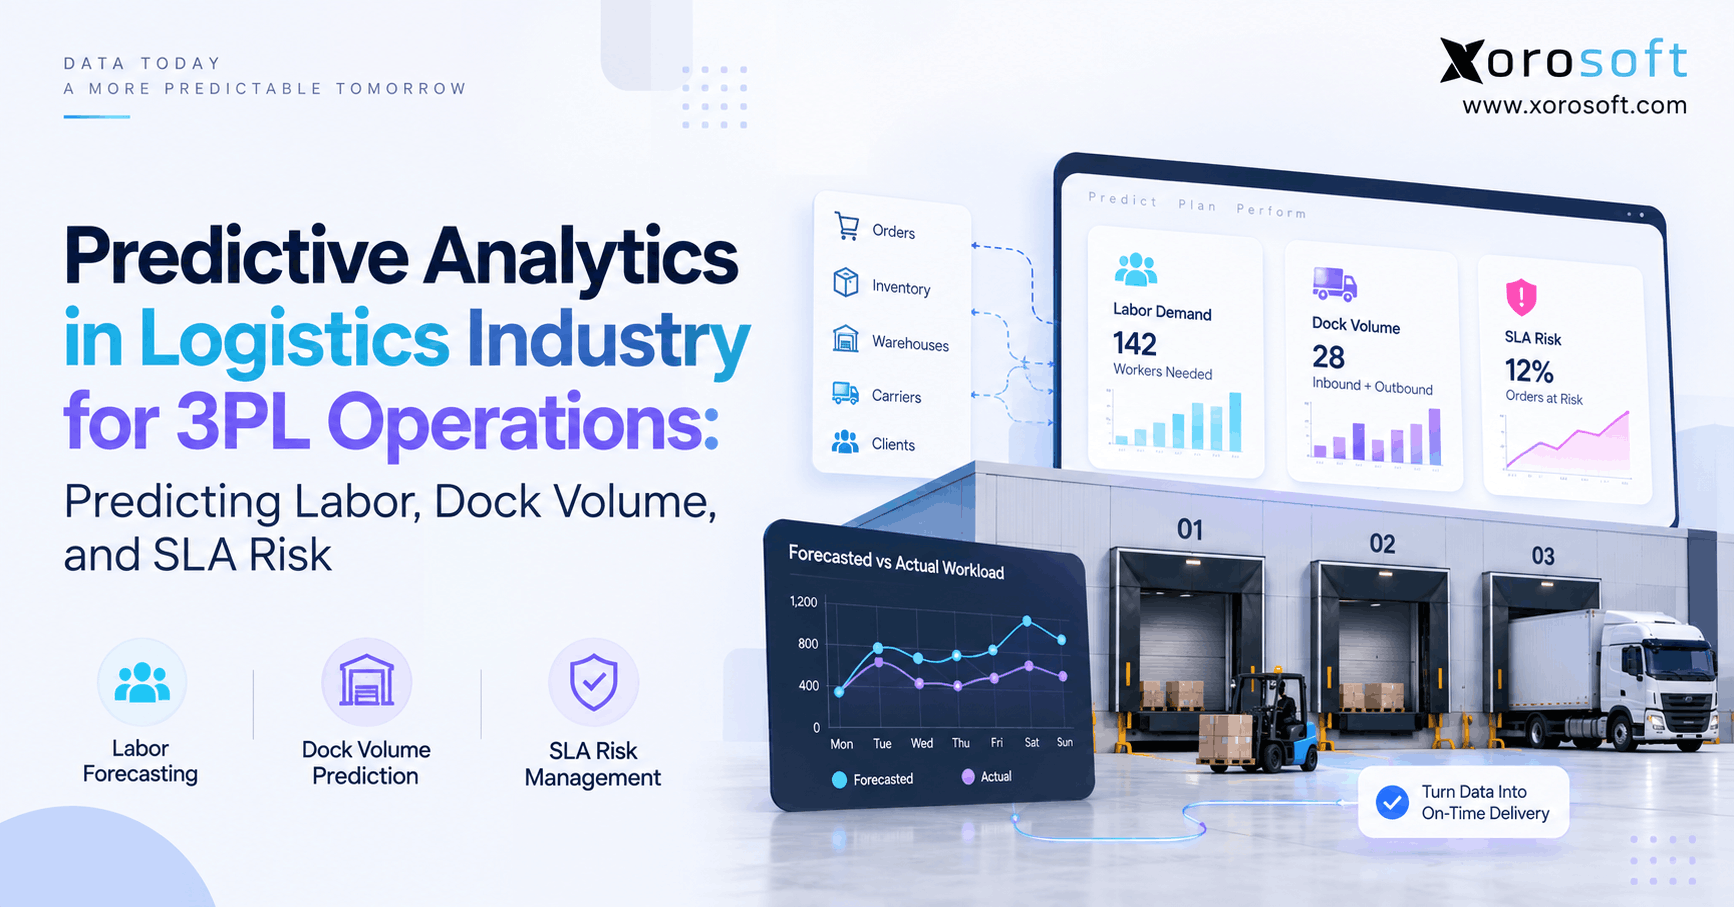
Predictive analytics in logistics is transforming the way companies manage supply chains and operations.
1. Predictive Analytics in Logistics Gives 3PL Teams Earlier Warning
Predictive analytics in logistics helps 3PL teams see likely workload, labor pressure, dock demand, and service risk before those issues become urgent. Therefore, instead of learning about a problem after a shift falls behind, managers can spot warning signs while there is still time to act.
For example, a warehouse may know that tomorrow will bring 14,000 order lines, six large receipts, and several carrier cutoffs. However, those numbers alone do not show where the operation may fail. Predictive models add context by comparing expected work with labor, dock space, processing speed, and past patterns.
As a result, the 3PL can plan around expected pressure rather than react to it later.
1.1 Why 3PL Predictive Analytics Matters Before the Shift Starts
Traditional reports are still useful because they show what happened. However, they often arrive after the best time to make a change has passed.
For instance, a report may show that yesterday’s packing team missed its target. Predictive logistics asks a different question: Is today’s packing workload likely to exceed the team’s available capacity?
Therefore, prediction changes the timing of the decision.
Instead of waiting for a queue to grow, a supervisor may move trained workers earlier. Likewise, instead of waiting for trucks to stack outside, the dock team may adjust door plans before the busiest period begins.
1.2 From Logistics Reporting to Forward-Looking Planning
A strong reporting system explains the past and the present. In contrast, predictive analytics tries to estimate what may happen next.
According to IBM’s supply chain analytics guidance, predictive analytics uses past and current data to forecast future demand, lead times, and possible risks. Therefore, prediction builds on good reporting rather than replacing it.
In practice, a 3PL needs both.
First, teams need trusted warehouse data. Then, they can use that data to forecast workload and risk. Finally, they can compare the forecast with what actually happened and improve the next plan.
2. What Predictive Analytics in Logistics Really Means
Predictive analytics in logistics uses past data, current events, and forecasting models to estimate future warehouse or transport conditions. Therefore, the output may be a predicted volume, processing time, labor need, delay risk, or chance of missing a service target.
However, prediction does not mean certainty.
Instead, it gives managers a better view of what is likely to happen. Because conditions can change during the day, forecasts should also change when new orders, delays, staffing gaps, or carrier events appear.
For a 3PL, that forward-looking view can support labor planning, receiving, picking, packing, shipping, dock planning, and SLA control.
2.1 Predictive, Descriptive, and Prescriptive Analytics
Different types of analytics answer different questions.
| Analytics type | Main question | 3PL example |
|---|---|---|
| Descriptive | What happened? | How many orders shipped yesterday? |
| Diagnostic | Why did it happen? | Why did picking fall behind? |
| Predictive | What may happen next? | Which orders may miss cutoff? |
| Prescriptive | What should we do? | Where should labor move? |
Therefore, predictive analytics sits between understanding the problem and choosing the response.
IBM also describes predictive analytics as looking ahead, while prescriptive analytics adds recommended actions. As a result, mature operations may use both rather than treating them as competing methods.
2.2 When Predictive Logistics Is Most Useful
Predictive logistics becomes more useful as warehouse work becomes harder to plan manually.
For example, a single-client warehouse with stable demand may work well with basic forecasting. However, a multi-client 3PL may deal with different order types, cutoffs, labels, carriers, item sizes, and service terms at the same time.
As complexity rises, yesterday’s average becomes less useful.
Therefore, prediction creates more value when demand changes often, service rules differ by client, and one delay can create pressure somewhere else in the warehouse.
3. How 3PL Predictive Analytics Turns Data Into Forecasts
3PL predictive analytics starts with events that already happen inside the operation. Therefore, teams do not need to begin with a huge AI project.
Instead, they should begin with clear business questions.
For example:
- How much picking work will arrive tomorrow?
- How many labor hours will receiving need?
- When could dock demand exceed available doors?
- Which orders may miss the carrier cutoff?
- Which client SLA needs attention first?
Once the question is clear, the business can identify which data actually matters.
3.1 Predictive Logistics Data Starts With Real Events
Useful signals often come from orders, receipts, labor records, scans, appointments, shipments, and inventory changes.
For example, picking history can show how long different order types usually take. Meanwhile, dock records can show whether certain carriers tend to arrive early, late, or in clusters.
Therefore, the model gains value from real work patterns.
In addition, current data matters because tomorrow may not look like last month. Open orders, promotions, scheduled receipts, staff availability, and client demand can all change the expected result.
3.2 Forecasts Should Update as Conditions Change
A morning forecast is useful. However, a forecast that never changes can become stale by noon.
For example, an inbound truck may arrive three hours late. As a result, receiving labor may become available for another task. At the same time, an unexpected ecommerce surge may increase outbound pressure.
Therefore, good predictive analytics in logistics should refresh as key events change.
This feedback loop turns prediction into part of daily work rather than a report that managers read once.
4. Predictive Analytics in Logistics for Labor Planning
Labor is one of the strongest use cases for predictive analytics in logistics because workload rarely arrives at a steady rate.
Therefore, a warehouse should forecast work before it forecasts headcount.
For example, 10,000 order lines do not always require the same number of labor hours. One day may involve easy each-picks from nearby bins. Meanwhile, another day may include large items, case picks, replenishment, and long travel paths.
As a result, labor plans need more context than total order count.
4.1 Warehouse Labor Forecasting Starts With Work
A simple starting point is:
Forecast labor hours = expected workload ÷ expected productivity
For example, if a zone expects 12,000 pick lines and normally completes 120 lines per labor hour, the base need is 100 labor hours.
However, managers should then adjust the plan for real conditions.
For instance, productivity can change by client, zone, item type, pick method, equipment, and shift. Therefore, a strong warehouse labor forecast uses work type as well as volume.
4.2 Add Order and Task Complexity
Not every line requires the same effort.
Therefore, forecasting can improve when the system includes:
- lines per order
- units per line
- case or each picking
- item size
- warehouse zone
- client rules
- pack steps
- replenishment needs
- equipment limits
As a result, two days with the same order count may create very different staffing needs.
In addition, this approach helps managers find where labor will be needed instead of only showing a total warehouse number.
4.3 Predict Labor by Shift, Role, and Zone
Daily totals can hide short periods of high pressure.
For example, receiving may need more people at 9 a.m., while packing may need more support at 3 p.m. Therefore, the forecast should break labor into useful time blocks.
Current warehouse forecasting tools also move in this direction. For instance, Blue Yonder describes resource forecasting by role, task, work area, and zone.
Meanwhile, U.S. Bureau of Labor Statistics data shows why labor planning matters financially. In July 2026, average hourly earnings in warehousing and storage were a preliminary $26.74, with average weekly hours at 40.4. Therefore, poor staffing choices can quickly affect cost. Review the BLS warehousing data.
5. Predictive Logistics Analytics for Dock Volume
Predictive logistics analytics can also help a 3PL see dock pressure before trucks start to queue.
However, dock forecasting should not stop at counting scheduled trucks.
A useful forecast should also consider arrival time, load size, unload or load time, available doors, staging space, equipment, and labor.
Therefore, the real question becomes:
How much dock capacity will this work consume, and when?
5.1 Dock Forecasting for Inbound and Outbound Work
Inbound and outbound activity create different needs.
For example, inbound volume may require unloaders, inspection space, receivers, and putaway labor. Meanwhile, outbound volume may require staging space, loaders, ready inventory, and carrier coordination.
Therefore, teams should forecast both flows separately.
However, those flows may still compete for the same doors or staff.
As a result, predictive analytics can help show when combined demand is likely to create a bottleneck.
5.2 Carrier Behavior Changes the Dock Forecast
Appointments are plans, not guarantees.
For example, four carriers may have four separate appointment times. However, past records may show that three often arrive within the same hour.
Therefore, arrival history can improve the dock forecast.
In addition, processing time matters. A truck that stays at a door for 90 minutes creates more pressure than one that leaves in 20 minutes.
As a result, predictive dock planning should look at door-hours, not only truck counts.
6. Predictive Analytics in Logistics for SLA Risk
Predictive analytics in logistics becomes especially useful when a 3PL needs to protect customer service levels.
Traditional SLA reporting tells managers whether a target was missed. However, predictive SLA analysis asks whether an active order appears likely to miss the target.
Therefore, teams gain time to act before the service failure becomes final.
6.1 SLA Risk Prediction Combines Time and Remaining Work
A simple risk view can combine:
remaining work + available capacity + remaining time + active exceptions
For example, an order may need replenishment, picking, packing, and staging before a 4 p.m. cutoff.
If it is still waiting for replenishment at 1 p.m., the system can compare its remaining steps with normal task times and current queues.
Therefore, that order may receive a higher risk score than one that is already packed.
6.2 Predict Completion Time Before the Carrier Cutoff
Order time prediction is already becoming part of modern WMS technology.
For example, Oracle’s warehouse management documentation describes forecasts for order cycle time, processing time, and waiting time. Oracle also connects those forecasts with labor planning, dock congestion, and SLA risk.
Therefore, the goal is not simply to label an order “late.”
Instead, the goal is to identify the likely delay while managers can still change labor, priority, or workflow.
7. Data Needed for 3PL Predictive Analytics
3PL predictive analytics depends on clean and connected data.
Therefore, adding a better model will not solve poor source data.
A 3PL may need signals from:
- customer orders
- receipts
- purchase orders
- inventory
- WMS tasks
- labor activity
- dock appointments
- carriers
- shipments
- client SLA rules
- exceptions
- task timestamps
However, businesses do not need every possible data field on day one.
Instead, they should start with the inputs that explain the chosen problem.
7.1 ERP, WMS, and Labor Data Play Different Roles
A WMS shows what is happening inside the warehouse. Meanwhile, ERP data adds orders, inventory, purchasing, customers, and wider business context.
Therefore, the systems work best when they share a common view of the operation.
For example, XoroWMS can support warehouse execution across receiving, inventory, picking, packing, and shipping. Meanwhile, a connected ERP can add the order and inventory context needed for better planning.
As a result, the forecast can reflect both expected demand and current warehouse work.
7.2 Bad Data Creates Bad Predictions
Missing scans, wrong task times, duplicate orders, and poor inventory records can weaken a model.
Therefore, data quality should be checked before teams judge forecast accuracy.
For example, if workers complete a task but the system records it 40 minutes later, the model may learn a false process time.
As a result, better predictive analytics often starts with better process control.
That is why clean execution data matters as much as advanced AI.
8. Predictive Analytics vs Traditional Logistics Reporting
Traditional reporting and predictive analytics solve different problems.
Therefore, 3PLs usually need both.
A dashboard can show yesterday’s dock wait, labor use, order count, and SLA performance. However, predictive analytics asks what those patterns may mean for tomorrow.
| Area | Traditional reporting | Predictive analytics |
|---|---|---|
| Time view | Past and present | Future |
| Labor | Actual productivity | Expected labor need |
| Dock | Past dwell time | Future congestion risk |
| Orders | Current status | Predicted completion |
| SLA | Missed target | Risk before failure |
| Capacity | Used capacity | Expected shortfall |
8.1 Logistics Predictive Analytics Needs Good Reporting First
Prediction should not replace basic controls.
Instead, reliable reports create the base that predictive models need.
For example, if the warehouse cannot trust its task times, inventory records, or shipment status, forecast output will also be weak.
Therefore, teams should first fix the data they already use.
Then, they can add predictive layers where forward-looking insight creates a clear business benefit.
8.2 Predictive vs Prescriptive Logistics Analytics
Predictive analytics answers what may happen.
In contrast, prescriptive analytics answers what should we do next.
For example, a predictive model may show that packing will be short by 25 labor hours. A prescriptive system may then suggest moving three trained workers from another zone.
Therefore, prediction gives the warning, while prescription helps shape the response.
However, people should still review the recommendation because warehouse limits, client needs, and safety rules may not be fully captured by a model.
9. 3PL Predictive Analytics Use Cases
3PL predictive analytics becomes easier to understand when it is tied to daily warehouse problems.
Therefore, operators should begin with use cases that have a clear action.
A useful prediction should answer two questions:
What may happen?
What can the team change because it knows earlier?
9.1 Predictive Logistics for an Ecommerce Order Surge
An ecommerce client runs a promotion over the weekend.
As a result, Monday’s open orders are far above normal.
Instead of using only the average Monday schedule, the 3PL can review actual orders, lines, SKU mix, past task rates, and available labor.
Therefore, managers may see that picking capacity is enough but packing will fall behind after 2 p.m.
They can then shift labor before the queue forms.
9.2 Forecasting Complex Wholesale Work
Wholesale orders often create different work from direct-to-consumer orders.
For example, one order may need case picking, customer labels, EDI steps, pallet building, and special shipping rules.
Therefore, order count alone can understate the workload.
A better model can use order type, units, lines, client rules, and past task time.
As a result, the warehouse plans for actual work rather than treating every order as equal.
9.3 Predicting Peak-Season Warehouse Pressure
Peak season creates pressure across several areas at once.
For example, order volume may rise while receipts also increase to rebuild stock.
Meanwhile, carrier cutoffs remain fixed.
Therefore, predictive logistics analytics can compare expected outbound work, inbound demand, labor, doors, and shipping limits in one planning view.
As a result, the 3PL can identify which constraint is most likely to create a service problem first.
10. Systems That Support Predictive Logistics Operations
Predictive logistics operations need more than a dashboard.
Instead, they need systems that capture the work, share clean data, and support action.
For most inventory-driven operations, the main layers include ERP, WMS, labor data, integrations, and analytics.
Therefore, the value comes from how those layers work together.
10.1 Xorosoft as a Connected Data and Execution Layer
For inventory-driven businesses, Xorosoft brings ERP, warehouse, inventory, purchasing, accounting, order management, and reporting into a connected cloud environment.
For example, XoroONE can centralize core operating data, while warehouse work can flow through the WMS layer.
Therefore, teams can reduce the gaps that often appear when orders, stock, labor, and financial data sit in separate tools.
In addition, connected data gives forecasting models a more consistent base.
However, software alone does not guarantee useful predictions. Teams still need clear goals, clean events, and a process for acting on risk.
10.2 Integrations Keep Predictive Logistics Data Current
3PL and ecommerce operations often receive data from many systems.
For example, orders may come from marketplaces, ecommerce channels, EDI partners, carriers, or client systems.
Therefore, Xorosoft integrations can help connect the systems that feed the wider workflow.
As a result, planning does not have to rely on data copied manually between spreadsheets and warehouse tools.
Current data is especially important because a forecast can lose value quickly when new orders or shipment changes are missing.
11. Why Predictive Analytics in Logistics Can Fail
Predictive analytics in logistics can create strong insight. However, it can also create false confidence when the process around the model is weak.
Therefore, teams should treat prediction as a business system, not only as a technical project.
11.1 Poor Data Weakens the Forecast
A model learns from the data it receives.
Therefore, bad task records, missing scans, wrong inventory, and duplicate orders can create bad results.
For example, an inaccurate task completion time may make a slow process appear normal.
As a result, the business may plan too little labor.
11.2 A Black-Box Score Can Be Hard to Use
A supervisor may see that an order has an 82% risk score. However, that number is not enough if nobody knows why.
Therefore, useful alerts should show the reason behind the risk.
For example:
Replenishment delayed + high pick queue + 90 minutes until cutoff
That message gives the supervisor a clearer place to start.
11.3 Prediction Without Action Adds Another Dashboard
Even a good forecast can fail if it does not change work.
Therefore, every prediction should connect to a decision.
For example, a labor warning may trigger a schedule change. Meanwhile, an SLA warning may raise task priority.
As a result, teams should define the response before they automate the alert.
12. Who Needs Predictive Logistics Analytics?
Predictive logistics is not required for every warehouse.
For example, a small site with stable volume, simple flows, and flexible service times may do well with good reports and basic forecasts.
However, prediction becomes more useful as work becomes harder to plan by experience alone.
12.1 Signs a 3PL Is Ready for Predictive Analytics
Common signs include:
- frequent overtime
- changing daily volume
- multiple clients
- several SLA rules
- dock queues
- repeated labor moves
- many warehouse zones
- high order mix
- manual report merging
- regular cutoff risk
Therefore, complexity matters more than company size alone.
If managers spend much of the day reacting to surprises, the operation may benefit from earlier warning.
12.2 When Simpler Forecasting May Be Enough
Not every planning problem needs machine learning.
For example, a simple seasonal forecast may work well for stable demand.
Likewise, basic productivity standards may be enough for a small picking team.
Therefore, businesses should use the simplest method that gives a useful decision.
As complexity grows, they can then add more data, more frequent updates, and stronger models.
13. How to Implement 3PL Predictive Analytics
A 3PL should not begin by trying to predict everything.
Instead, it should start with one costly and clear problem.
For example:
Can we predict next-day picking labor well enough to reduce emergency staffing changes?
That question has a clear input, output, and action.
13.1 Start With One Predictive Logistics Use Case
First, choose a workflow with enough history.
Next, define the result you want to forecast.
Then, identify the action managers will take.
For example, a dock project may predict door demand in 30-minute blocks.
Therefore, the action may be to change appointment times, labor, or door assignments.
A focused use case makes it easier to test whether prediction adds value.
13.2 Build a Baseline Before Adding AI
Teams need something to compare the model against.
Therefore, start with the current method.
For example, compare a new labor forecast with last week’s average, a supervisor’s plan, or a simple volume-based formula.
Then measure actual results.
As a result, the business can see whether the new method is truly better rather than simply more advanced.
13.3 Expand Only After the First Forecast Works
Once one forecast performs well, expand carefully.
For example, a 3PL may start with picking labor, then add packing, receiving, dock demand, and SLA risk.
Meanwhile, Xorosoft solutions can support the wider inventory, warehouse, order, and finance processes around that data.
Therefore, prediction can grow with the operation instead of becoming a separate project that does not connect with daily work.
14. How to Measure Predictive Logistics Results
Predictive logistics should be measured by more than model accuracy.
Of course, forecast error matters. However, the business also needs to know whether earlier warning improved the operation.
Therefore, useful measures can include:
- workload forecast error
- labor forecast error
- planned versus actual hours
- overtime
- dock wait
- order cycle time
- high-risk orders found early
- SLA performance
- emergency labor moves
- forecast accuracy by client
14.1 Measure the Decision, Not Only the Number
A forecast can be slightly wrong and still be useful.
For example, a model may predict that a workload spike will start at 2 p.m., while it actually starts at 2:30 p.m.
However, if that warning gave the supervisor time to add labor, the forecast still created value.
Therefore, teams should ask whether the prediction arrived early enough to support action.
14.2 Keep Checking the Model Over Time
Warehouse work changes.
For example, new clients, new layouts, different carriers, new products, and new staff can change old patterns.
Therefore, forecast accuracy should be reviewed on a regular basis.
In addition, businesses can use AI tools more safely when systems expose current data and clear rules. Xorosoft’s AI MCP Server is one example of how business data can be made available to AI-driven workflows in a controlled system context.
15. Build a 3PL Operation That Sees Risk Earlier
Predictive analytics in logistics is most useful when it gives managers enough time to change the outcome.
Therefore, the goal is not to add another complex dashboard.
Instead, the goal is to answer practical questions earlier:
How much work is coming?
Where will labor become tight?
When could dock demand exceed capacity?
Which order or client is most likely to miss an SLA?
When those answers come early, teams can move labor, adjust schedules, change priorities, and protect customer commitments.
However, reliable prediction requires reliable data. Therefore, businesses that still depend on disconnected spreadsheets, warehouse apps, accounting tools, and manual reports should first improve the data foundation.
Xorosoft helps inventory-driven businesses connect ERP, WMS, orders, inventory, purchasing, accounting, and reporting in one cloud platform. As a result, teams can build a clearer base for better forecasting and faster decisions.
If your operation is ready to connect its warehouse data and improve forward planning, Book a Demo to review how the workflow could fit your business.
Frequently Asked Questions
What is predictive analytics in logistics?
Predictive analytics in logistics uses past and current data to estimate future workload, delays, labor needs, capacity limits, and service risks. Therefore, teams can plan earlier instead of reacting after problems occur.
How can predictive analytics help a 3PL?
It can help a 3PL forecast labor, inbound volume, outbound work, dock pressure, order completion, and SLA risk. As a result, managers can make staffing and priority decisions earlier.
Can predictive analytics forecast warehouse labor?
Yes. It can combine expected workload, task type, order mix, productivity, shift data, and past performance. Therefore, labor plans can reflect expected work rather than simple daily averages.
Can predictive logistics predict dock congestion?
Yes. Dock forecasts can compare expected arrivals, processing time, door space, labor, and carrier patterns. As a result, managers can spot busy periods before queues start to form.
How does predictive analytics identify SLA risk?
It compares remaining work, expected task time, available capacity, current delays, and the service deadline. Therefore, orders with a higher chance of missing the target can receive attention earlier.
Does predictive analytics require AI?
Not always. Simple forecasts can use averages, rules, or statistical methods. However, machine learning may help when many changing factors affect workload, task time, or risk.
When should a 3PL use predictive analytics?
A 3PL should consider it when volume changes often, labor moves are frequent, clients have different SLAs, dock pressure is common, or managers spend too much time reacting to problems.
Recent Posts
-
 How Inventory Status Tracking Clarified Damaged, Reserved, and Available Stock
 -
Predictive Analytics in Logistics for 3PL Operations: Predicting Labor, Dock Volume, and SLA Risk
-
 Should a B2B Ecommerce Platform Calculate Inventory Availability or Read It From ERP?
 -
 Distributor ERP Software for Unifying Inventory, Purchasing, Warehousing, Orders, and Accounting
 -
 Multichannel Inventory Statistics 2026: Growth, Overselling, and Operational Complexity