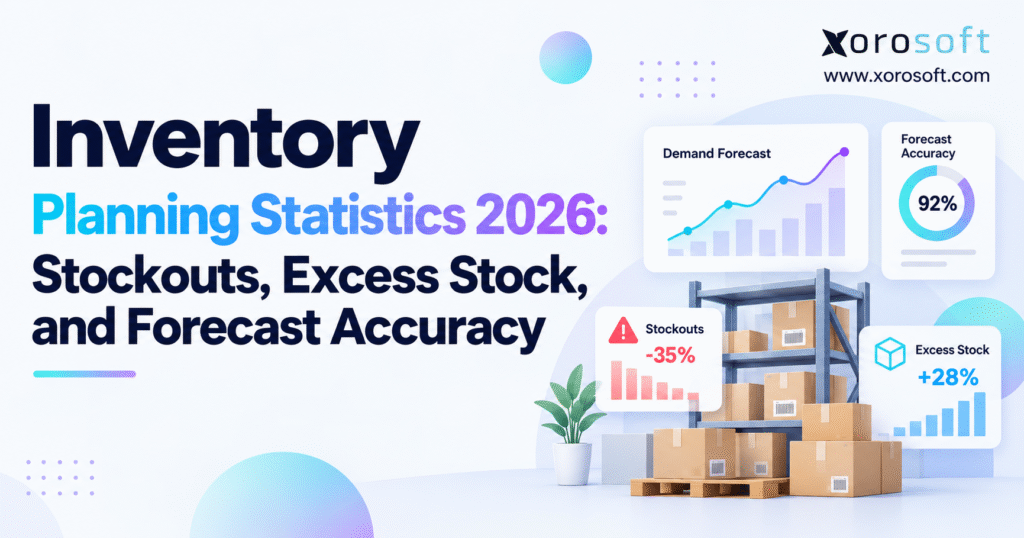
This article will discuss important 2026 inventory planning data your business needs to know.
1. 2026 Inventory Planning Data Shows a Costly Stock Imbalance
Inventory problems rarely come down to simply having too much or too little stock. The more common issue is having the wrong quantity of the wrong product in the wrong place at the wrong time.
Current 2026 inventory planning data shows why this matters. Businesses can carry large inventory balances while still losing sales because fast-moving SKUs are unavailable. Meanwhile, slow-moving goods may remain in storage for months and keep working capital tied up.
According to the U.S. Census Bureau, manufacturers and trade businesses held about $2.7647 trillion in inventories in July 2026, up 3.8% from the prior year. Combined sales and manufacturers’ shipments reached about $2.1207 trillion, rising 8.9% year over year.
The total inventory-to-sales ratio stood at 1.30, compared with 1.37 in July 2025. That national ratio provides useful market context, but it cannot show whether one company owns the right mix of products.
For operators, a more useful question is whether available stock can meet expected demand without locking unnecessary cash into inventory.
1.1 Stockouts and Excess Stock Can Exist Together
Stockouts and overstock often appear inside the same business.
IHL Group estimates that worldwide retail inventory distortion from out-of-stocks and overstocks totals about $1.7 trillion in 2026. Shortages represent the larger share, while excess stock remains a major financial burden.
Consider an apparel business with thousands of units in inventory. Overall stock may look healthy, yet popular sizes can still be unavailable.
Wholesale distributors face a similar problem when one warehouse holds too much inventory while another site cannot fill customer orders.
Manufacturers may experience the same imbalance. Healthy total inventory does not prevent one missing component from stopping a production run.
These examples show why inventory value alone cannot define inventory health.
1.2 How 2026 Inventory Planning Data Improves Buying Decisions
Useful 2026 inventory planning data should support decisions rather than simply report inventory value.
Which items may run out first? Where is excess inventory starting to build? Which suppliers are arriving later than expected? What should purchasing order today?
Sales history provides only one part of the answer. Planners also need open purchase orders, customer commitments, supplier lead times, warehouse stock, safety stock, incoming inventory, forecast error, and expected channel demand.
Finance matters as well.
A low stockout rate may look positive until the company realizes it achieved that result by carrying months of extra safety stock. High inventory turns can also look efficient while customers regularly face unavailable products.
Good planning balances availability, service, inventory cost, and working capital.
2. Stockout Trends in 2026 Inventory Planning Data
A stockout occurs when a business cannot meet demand because the required item is unavailable at the location and time where it is needed.
Demand may simply exceed expectations. In other cases, shortages result from supplier delays, poor stock records, allocation problems, outdated lead times, or purchasing decisions made too late.
Finding the root cause matters because buying additional stock is not always the correct response.
2.1 Stockouts Still Create a Large Business Cost
Stockout trends remain one of the most important parts of 2026 inventory planning data.
IHL’s current research estimates that out-of-stocks represent the majority of worldwide retail inventory distortion. Empty shelves alone account for hundreds of billions of dollars in estimated impact.
A missed transaction is only the most visible cost.
Customer-service teams may need to handle substitutions or backorders. Warehouse staff can spend additional time splitting shipments, while buyers may place urgent orders with expensive freight.
Marketplace sellers face another problem. Losing availability during a high-demand period can reduce sales momentum when it matters most.
Wholesale businesses can experience a wider effect. One missing line may delay an entire shipment because the customer prefers to receive a complete order.
For manufacturers, the financial impact can grow quickly when a low-cost component prevents completion of a high-value product.
2.2 Inventory Accuracy Can Create Hidden Stockouts
Forecasting is often blamed first when inventory runs out. Yet a demand plan cannot fully compensate for an incorrect starting stock position.
Suppose an ERP reports 80 units in inventory while warehouse employees can locate only 55. Any purchasing recommendation based on 80 units begins with bad data.
More advanced forecasting will not repair that gap.
Stock differences can start during receiving, picking, transfers, returns, cycle counts, or manual adjustments. Shrinkage creates another possible source of error.
Before increasing safety stock, businesses dealing with repeated shortages should confirm whether system inventory matches physical inventory.
Reliable stock records make every later planning calculation more useful.
2.3 Location-Level 2026 Inventory Planning Data Reveals Hidden Shortages
Strong 2026 inventory planning data must show where stock is located.
Suppose a company holds 5,000 units of a product nationwide. At first glance, availability looks healthy.
However, 4,000 units may sit in warehouses where near-term demand is weak. Another region could have only a few days of supply remaining.
A company-wide inventory number hides that problem.
Multi-location businesses should review stock by SKU and warehouse while also considering transfers, customer allocations, inbound purchase orders, and regional demand.
Location-level planning becomes more important when a business adds marketplaces, third-party logistics providers, regional fulfillment sites, or wholesale warehouses.
3. Excess Inventory Data Shows Where Working Capital Gets Trapped
Excess inventory is stock above the amount reasonably needed to cover expected demand and an appropriate buffer for uncertainty.
Those products may still sell in the future. The real problem is timing.
Cash has already been spent even though the goods may not be needed for weeks or months.
That limits financial flexibility. Money held in slow inventory cannot easily support faster-selling products, hiring, marketing, equipment, new launches, or other business needs.
3.1 Overstock Creates Costs Before a Markdown Happens
Excess stock creates costs even when the product eventually sells at full price.
Warehouse space remains occupied. Teams must continue counting, storing, transferring, and handling the goods. Insurance, finance, and storage expenses can continue throughout that period.
Age adds another layer of risk.
Fashion products may become less desirable. Food can expire. Consumer electronics can lose value as new products arrive. Replacement parts may become obsolete after equipment changes.
As a result, overstock should not be treated only as a warehouse concern.
It affects cash, margins, buying capacity, and future inventory decisions.
3.2 Carrying Cost Goes Beyond Warehouse Rent
Inventory carrying cost includes more than the physical space used to store goods.
Capital tied up in inventory has a cost. Businesses may also pay for insurance, handling, stock counts, damage, shrinkage, administration, and eventual write-downs.
Different industries experience those costs in different ways.
Furniture businesses may hold bulky, high-value products for long periods. Apparel companies face seasonal and markdown risk, while food operations must manage shelf life.
Industrial distributors may intentionally keep slower products because customers expect parts to be available when needed.
The right inventory level therefore depends on both service expectations and product economics.
3.3 Purchasing Rules Can Distort 2026 Inventory Planning Data
Purchasing policies can materially affect 2026 inventory planning data.
Overforecasting is one cause of surplus stock, but it is not the only one.
Suppliers may require high minimum order quantities. Importers often buy several months ahead because overseas shipping takes time. Purchasing teams may increase quantities to secure lower unit costs.
Each decision can make sense on its own.
The risk appears when the planning process does not show the complete future inventory position.
A buyer may see eight weeks of available stock without noticing another ten weeks already on purchase orders. Elsewhere, a planner could still use a 90-day lead time even though the supplier now delivers in about 55 days.
Good planning combines current stock, inbound inventory, supplier timing, and expected demand.
4. Forecast Accuracy in 2026 Inventory Planning Data
Forecast accuracy is one of the most visible inventory planning measures.
Yet one percentage cannot explain the full state of inventory performance.
A high-volume core SKU may be fairly easy to predict. An occasional replacement part can be much harder.
Promotions, seasonality, new product launches, customer changes, and channel growth all add uncertainty.
For that reason, no universal forecast-accuracy target works for every business or product.
4.1 Better Forecasts Do Not Always Create Better Inventory
An improved forecast does not automatically create a better inventory position.
Purchasing policies still influence the final result.
Lead times, safety stock, review periods, order minimums, supplier pack sizes, and service targets all shape the quantity that buyers actually order.
Consider a company that improves its forecast model but leaves its purchasing settings unchanged.
Buyers may continue ordering the same case quantities. Meanwhile, safety-stock values can remain fixed, and supplier minimums may still determine final order quantities.
As a result, forecast accuracy improves while inventory levels barely change.
The value appears only when better forecasting leads to better replenishment decisions.
4.2 MAPE Gives a Simple View of Forecast Error
MAPE means Mean Absolute Percentage Error.
The metric compares forecast error with actual demand and presents the result as a percentage.
Managers often like MAPE because the number is easy to understand.
Problems appear when actual demand is very low or zero.
A replacement part may sell nothing for several weeks and then receive several orders at once. Percentage errors become harder to interpret under that demand pattern.
For items with regular demand, MAPE can still provide a useful planning measure.
4.3 WMAPE Helps With Large SKU Portfolios
WMAPE means Weighted Mean Absolute Percentage Error.
Rather than giving every SKU the same influence, WMAPE gives more weight to higher-volume demand.
That can help businesses managing thousands of products.
However, high-volume items may dominate the result.
A low-volume SKU that is vital to a major customer could forecast poorly without materially changing the company-wide WMAPE score.
Portfolio-level metrics should therefore be supported by more detailed SKU analysis.
4.4 Forecast Bias Adds Context to 2026 Inventory Planning Data
Forecast bias makes 2026 inventory planning data more useful.
Bias shows whether forecasts tend to run above or below actual demand.
Consistent overforecasting can lead to excessive buying. Persistent underforecasting creates the opposite risk by causing purchasing teams to fall behind demand.
Average error may still appear reasonable even when a clear directional issue exists.
Teams should therefore review forecast error and forecast bias together.
The strongest analysis then connects both measures with stockouts, fill rates, excess inventory, and inventory turns.
5. 2026 Inventory Planning Data Should Balance Service and Cash
No single KPI defines healthy inventory performance.
A business can reduce stockouts by carrying a very large safety buffer. That choice may hurt cash flow.
Another company might increase inventory turns by operating with extremely lean stock. Customer availability may suffer as a result.
Good inventory planning sits between these two extremes.
5.1 Inventory Turns Show How Quickly Stock Moves
Inventory turnover normally compares annual cost of goods sold with average inventory.
APQC reports a cross-industry median of about eight total inventory turns in its benchmark data.
That figure is useful for context, but it should not become a universal target.
Food distributors may move goods far faster than furniture importers. Apparel businesses face seasonal risk, while industrial suppliers often hold slower items because customers expect availability.
Companies should compare turnover with similar businesses and their own past results.
A higher turnover rate is valuable only when service remains healthy.
5.2 Inventory-to-Sales Ratios Add Wider Context
The U.S. total business inventory-to-sales ratio stood at 1.30 in July 2026, compared with 1.37 one year earlier.
Wholesale data provides another useful view.
Merchant wholesalers held about $958.9 billion in inventory at the end of July 2026. Sales reached roughly $801.3 billion, while the inventory-to-sales ratio stood at 1.20.
These figures help operators understand broader market conditions.
Company-level planning, however, needs more detail.
A business must still know which products are moving, which warehouses are short, and where inventory is building faster than demand.
5.3 Balanced 2026 Inventory Planning Data Creates Better Decisions
Balanced 2026 inventory planning data should combine service, stock, forecast, and supplier measures.
| KPI | What It Shows |
|---|---|
| Forecast error | How far planned demand differs from actual demand |
| Forecast bias | Whether forecasts usually run high or low |
| Stockout rate | How often needed products are unavailable |
| Fill rate | How much demand is filled immediately |
| Inventory turns | How quickly inventory moves |
| Weeks of supply | How long current inventory may last |
| Excess inventory | How much stock sits above expected need |
| Inventory accuracy | Whether system stock matches physical stock |
| Lead-time variance | How consistent supplier delivery timing is |
| Expedite rate | How often buyers need urgent action |
These metrics become more valuable when reviewed together.
A strong fill rate paired with very high inventory may still signal weak planning. Likewise, high turnover alongside repeated shortages is not a healthy result.
6. Industry Inventory Planning Benchmarks Need Different Targets
Inventory planning changes by industry.
Demand, product life, margins, supplier location, storage needs, order quantities, and customer expectations all influence how much stock is appropriate.
That makes broad comparisons risky.
Companies should use benchmarks from similar operating models whenever possible. Xorosoft’s overview of inventory-driven industries shows how requirements can differ across apparel, wholesale, furniture, sporting goods, consumer products, food, and manufacturing.
6.1 Ecommerce 2026 Inventory Planning Data Needs SKU Detail
For ecommerce businesses, 2026 inventory planning data needs to reach the variant and channel level.
Demand can change quickly.
A promotion may increase sales within hours. Social attention can shift product demand, while returns put previously sold stock back into availability.
Variant-level planning is particularly important for apparel and footwear.
A style can perform well overall while certain colors or sizes remain overstocked.
Shopify merchants must also distinguish physical stock from inventory that is truly available to sell.
Reservations, orders, returns, bundles, and several fulfillment locations can all affect that number.
Businesses exploring a direct ERP connection can review the Xorosoft ERP app for Shopify as one example of linking ecommerce activity with broader inventory operations.
6.2 Wholesale 2026 Inventory Planning Data Needs Customer Context
Wholesale 2026 inventory planning data must include customer-level demand.
Distributors often manage EDI orders, contract demand, case quantities, customer allocations, backorders, and supplier rules.
Warehouse location adds another layer.
A distributor may own enough inventory across its network but still lack goods in the facility serving an important account.
Supplier terms also influence buying.
Large minimum quantities and overseas lead times can push purchase quantities above near-term demand.
For wholesale businesses, good planning connects customer demand, warehouse stock, inbound goods, and supplier timing.
6.3 Manufacturing Planning Needs Component-Level Visibility
Manufacturing creates another layer of inventory complexity.
Finished goods cannot be completed unless required components and raw materials arrive on time.
A small missing part may stop a high-value production order.
Sales forecasts therefore need to connect with bills of material, work orders, material requirements, supplier lead times, and open purchase orders.
Manufacturing planning should track component shortages alongside finished-goods availability.
A company can appear well stocked financially while remaining constrained operationally.
7. Multi-Warehouse 2026 Inventory Planning Data Needs Location Detail
One warehouse creates a relatively simple inventory picture.
Multiple sites turn stock into a network problem.
A business may own enough inventory overall while one location repeatedly runs short.
Location-level 2026 inventory planning data therefore becomes essential as the network grows.
7.1 Total Inventory Can Hide Regional Risk
Assume a company owns 2,000 units of one product.
Of that total, Warehouse A holds 900 units, Warehouse B carries 850, and Warehouse C has only 250.
At company level, inventory appears healthy. However, Warehouse C may serve the region expected to generate most of next week’s sales.
The planner now needs to choose between moving goods, placing another purchase order, changing fulfillment rules, or reducing channel availability.
A total inventory number cannot make that decision.
7.2 Warehouse Transactions Must Reach Planning Quickly
Receiving, picking, transfers, stock adjustments, and shipments change usable inventory throughout the day.
Planning from yesterday’s export creates risk.
A buyer may place an unnecessary order because a large receipt is not yet included in the planning workbook.
Shortages can appear for the opposite reason when customer allocations rise after the most recent export.
A connected warehouse platform such as XoroWMS can help align warehouse activity with wider inventory and purchasing workflows.
Current data does not remove demand risk, but it creates a much stronger starting point.
7.3 Channel Data Improves 2026 Inventory Planning Data
Channel integration makes 2026 inventory planning data more reliable.
Shopify, marketplaces, wholesale customers, EDI orders, and other sales sources may all draw from the same inventory pool.
Separate systems make real availability harder to trust.
A connected integration environment can move order and stock updates between systems instead of relying only on manual exports.
Better data flow gives planners a clearer view of real demand and real available inventory.
8. 2026 Inventory Planning Data Can Expose Spreadsheet Limits
Spreadsheets remain useful planning tools for many businesses.
A company with a small catalog, one warehouse, steady demand, and only a few suppliers may manage inventory effectively in Excel or Google Sheets.
Problems begin when the workbook becomes a daily data-integration project.
8.1 Buyers Can Spend More Time Preparing Data Than Planning
Before placing an order, buyers may need sales history, current inventory, customer commitments, open purchase orders, transfers, supplier lead times, marketplace sales, Shopify demand, wholesale orders, and manufacturing needs.
When each number comes from a different export, planning begins with data preparation.
Rows must be merged. Formulas need checking, while duplicate or old records may need to be removed.
During that work, new orders continue arriving and warehouse balances continue changing.
By the time the spreadsheet is ready, some information may already be stale.
The calculations might be correct while the underlying inventory position is no longer current.
8.2 Connected ERP Creates Better 2026 Inventory Planning Data
Connected ERP can improve 2026 inventory planning data by reducing repeated exports and manual reconciliation.
The main benefit is not simply replacing Excel.
XoroONE connects inventory, purchasing, warehouse activity, accounting, ecommerce operations, forecasting, and reporting inside one cloud environment.
Planning teams still make the decisions.
However, they can spend less time rebuilding the latest inventory position before each buying decision.
A shared inventory record also makes it easier for purchasing, warehouse, sales, and finance teams to work from the same numbers.
8.3 Complexity Is a Better Upgrade Signal Than Revenue
Revenue alone is a weak reason to adopt ERP.
A smaller company with several warehouses, thousands of SKUs, Shopify, Amazon, wholesale demand, EDI, and manufacturing can face more inventory complexity than a much larger company with a simple catalog.
Recurring errors provide stronger warning signs.
Common symptoms include spreadsheet purchasing, duplicate data entry, frequent stock adjustments, poor warehouse visibility, and stockouts occurring alongside excess inventory.
Once those problems become routine, the current operating model may have outgrown its tools.
9. ERP Connects 2026 Inventory Planning Data With Purchasing
Forecasts create value only when they lead to better operating decisions.
Expected demand must eventually affect purchase orders, warehouse inventory, production plans, and cash needs.
Separate applications make those connections harder.
9.1 Purchasing Needs More Than Historical Sales
Sales history is useful, but it is not enough for a complete buying decision.
Current inventory matters. Customer commitments, open purchase orders, supplier timing, safety stock, order minimums, and expected demand also influence the result.
Ignoring incoming inventory can lead to duplicate buying.
Assuming a delayed purchase order will arrive on schedule produces a different risk.
A system such as XoroERP connects inventory, purchasing, sales, warehouse activity, and accounting so buyers can work from a broader operating view.
9.2 Finance Needs the Same Inventory Picture
Inventory is both stock and cash.
Every purchase uses working capital or credit. Slow-moving goods may keep that money tied up for months, while shortages can lead to missed revenue.
Finance and operations therefore need a shared inventory picture.
When accounting uses one number and warehouse teams use another, planning meetings often become reconciliation meetings.
Connected records reduce that gap.
They also make the financial impact of buying decisions easier to understand.
9.3 ERP Fit Affects 2026 Inventory Planning Data
Reliable 2026 inventory planning data depends partly on whether the operating system fits the business.
Companies should begin with practical questions.
Can the platform support several warehouses? Does it connect Shopify and wholesale orders? Can purchasing see inbound goods? Will manufacturing requirements feed material buying? Does accounting update from the same inventory transactions?
Those questions matter more than a generic feature checklist.
Businesses comparing broader ERP platforms can also review the Xorosoft vs NetSuite comparison to consider operating fit, scope, and implementation needs.
The right system should improve decision quality rather than simply produce additional reports.
10. Planning Errors That Distort 2026 Inventory Planning Data
Poor inventory performance rarely comes from one isolated mistake.
Several small issues usually combine.
An outdated supplier lead time may work alongside too much safety stock. Incorrect inventory can appear at the same time as a delayed purchase order.
Company-wide forecast scores may also hide problems inside one warehouse or product group.
These issues make 2026 inventory planning data more useful as a diagnostic tool than as a simple scorecard.
10.1 Revenue Forecasts Cannot Replace Unit-Level Planning
Revenue forecasts help management create budgets and growth targets.
They do not tell buyers exactly which products to order.
A company can hit its quarterly sales goal while carrying the wrong inventory mix.
Apparel businesses may require forecasts by style, size, and color. Furniture operations often need product and location detail.
Manufacturers must eventually turn finished-goods demand into raw-material and component quantities.
Inventory purchasing ultimately happens in units, even when management plans in dollars.
10.2 Old Lead Times Create Weak Reorder Decisions
Supplier lead times often remain unchanged in software long after real performance shifts.
One supplier may be configured with a 45-day lead time even though deliveries now arrive consistently in 35 days.
By contrast, another vendor might also average 45 days but range anywhere from 25 to 80 days.
Although their averages are identical, the two suppliers create very different planning risks.
Teams should therefore compare planned lead times with actual delivery history on a regular basis.
10.3 Safety Stock Should Change When Risk Changes
Safety stock protects against uncertainty.
When demand becomes more stable, a smaller buffer may be enough.
If supplier reliability declines, additional protection could become necessary.
Keeping the same safety-stock quantity for years can create hidden excess inventory or repeated shortages.
The rule should be reviewed whenever demand patterns, service goals, or supplier performance change.
10.4 Open Purchase Orders Must Be Part of the Plan
Current on-hand inventory shows only today’s position.
A product may look low even though a large delivery is due next week.
Buying again without seeing that incoming quantity can create future overstock.
The reverse situation can also happen.
A purchase order may appear on time in the system even though the supplier has already warned of a delay.
Planners need accurate quantities and realistic arrival dates.
10.5 SKU-Level Data Improves Inventory Forecast Benchmarks
Company-wide forecast scores can hide weak products.
A few high-volume SKUs may dominate the total result.
Smaller but important products can continue performing poorly without materially changing the company average.
Breaking results down by product group, warehouse, channel, or demand pattern can reveal those gaps.
Businesses evaluating process or software changes can also review relevant case studies to understand how inventory and ERP improvements work in real operating environments.
11. A Practical Framework for Better 2026 Inventory Planning Data
The best response to planning statistics is not chasing one target.
Start by finding the products and processes creating the greatest service or financial risk.
Then improve planning rules around those areas.
11.1 Segment Products Before Changing Forecast Models
Not every product needs the same forecasting method.
High-value products, best sellers, and critical components generally deserve closer control.
Slow-moving products may need simpler rules and less frequent review.
Seasonal goods should also be treated differently from steady year-round demand.
Segmentation helps teams spend time where mistakes produce the greatest business impact.
It also prevents planners from trying to manage every SKU with one method.
11.2 Forecast Error and Bias Strengthen 2026 Inventory Planning Data
Forecast error and bias make 2026 inventory planning data more useful.
Error shows how far the plan missed actual demand.
Bias indicates whether forecasts tend to miss high or low.
Persistent overforecasting can create excess stock even when average error appears acceptable.
Frequent underforecasting may produce shortages and urgent buying.
Both measures should therefore be reviewed together.
The next step is understanding the reason behind the error.
A promotion may have changed demand. A previous stockout could have reduced recorded sales, while a large one-time customer order may create a short-term spike.
Forecast measurement should lead to action rather than simply generate a score.
11.3 Check Inventory Accuracy Before Adding Safety Stock
Teams often respond to uncertainty by increasing inventory.
That approach may reduce some shortages, but it can also hide weak stock control.
If system quantities regularly differ from physical inventory, correct that issue first.
Receiving, transfers, returns, picking, and inventory adjustments are common areas to review.
Accurate inventory provides a stronger base for every later planning calculation.
11.4 Use Actual Supplier Performance
Lead times should reflect real delivery history wherever possible.
Average timing helps, but variation matters as well.
A supplier that reliably delivers in 50 days may be easier to plan than one averaging 45 days but sometimes taking 80.
Stable supply can reduce the amount of protective inventory required.
Unstable suppliers may justify extra stock, alternative sourcing, or earlier ordering.
11.5 Set Service Goals Based on Product Economics
Not every SKU needs the same availability target.
A high-margin bestseller may justify greater protection.
A slow product with low margin and fast supplier access may not.
The cost of a shortage should be compared with the cost of carrying additional stock.
This is where inventory planning moves beyond forecasting and becomes a business decision.
11.6 Measure What Changes After the Planning Update
Planning improvements should eventually appear in operating results.
When forecast accuracy improves, check whether stockouts decline.
After reducing safety stock, review fill rate and lost sales.
If inventory turns increase, confirm that service remains healthy.
The final question is straightforward: did the planning change improve availability, inventory levels, or working capital?
12. AI and Automation Can Improve 2026 Inventory Planning Data
Modern planning tools can review more information and identify changes faster.
The real benefit is not another forecast chart.
Technology creates value when it helps planners decide what to do next.
Should purchasing order now? Does stock need to move between warehouses? Is one supplier becoming less reliable? Has safety stock become too high?
These questions connect data with action.
12.1 AI Still Needs Reliable Inventory Data
AI can process more information than planners can review manually.
It may detect demand shifts, identify unusual patterns, compare products, and support different planning scenarios.
Poor source data still weakens the result.
Incorrect stock balances, missing sales history, outdated supplier records, and delayed channel updates can all reduce the quality of recommendations.
Reliable operational data should therefore come before advanced automation.
12.2 Exception-Based 2026 Inventory Planning Data Helps Teams Scale
Exception-based workflows make 2026 inventory planning data easier to use as a business grows.
A planner cannot manually inspect thousands of products every morning.
Instead, the system should highlight the items that require attention.
Products likely to stock out may be flagged first. Late purchase orders, unusually high weeks of supply, sudden demand changes, and warehouses approaching shortages can also receive attention.
Routine products can continue through standard rules.
People then spend their time on the cases where human judgment adds the most value.
12.3 Connected Systems Make Automation More Useful
Automation works best when orders, inventory, purchasing, warehouse activity, and accounting share reliable data.
Disconnected tools force planning systems to depend on imports and delayed updates.
That creates the same problem found in old spreadsheets.
A recommendation can be technically correct for an inventory position that no longer exists.
Connected transactions allow planning tools to react more quickly to real operational changes.
Technology helps, but data quality still determines how much value the business receives.
13. Turn 2026 Inventory Planning Data Into Better Decisions
The strongest lesson from current 2026 inventory planning data is not that companies need more stock.
Reducing inventory everywhere is not the answer either.
Businesses need the right quantity of the right product in the right location while keeping enough working capital available for the rest of the company.
U.S. businesses continue to hold trillions of dollars in inventory. At the same time, worldwide retail research still identifies major losses caused by both stockouts and overstock.
Those facts show why total inventory value is a weak measure of planning quality.
13.1 Start With the Inventory Problems That Cost the Most
Management should know which SKUs create the most shortages and which products hold the most cash.
Forecast direction should also be clear.
If forecasts repeatedly run high, the business needs to understand why.
When shortages occur despite reasonable forecasts, stock accuracy, supplier performance, warehouse allocation, and buying rules should be reviewed.
Supplier lead times must also match actual delivery history.
Finally, purchasing, warehouse, sales, ecommerce, and finance teams should work from the same basic inventory position.
Without that shared view, valuable planning time gets lost to reconciliation.
13.2 Improve the Process Before Simply Adding Stock
Before adding inventory, identify what actually caused the shortage.
Perhaps demand was higher than expected. A supplier delay may also be responsible, or the system inventory could simply be wrong.
In other cases, stock may exist in another warehouse or an outdated reorder rule may be creating the gap.
For smaller businesses, cleaner inventory records, updated lead times, better reorder rules, and stronger spreadsheet control may solve a large part of the problem.
Different causes require different fixes.
Adding more inventory without understanding the source of the shortage can simply replace a stockout problem with an overstock problem.
13.3 Know When Connected ERP Becomes the Practical Next Step
Growing companies often reach a point where process changes alone are not enough.
Multiple warehouses, Shopify and wholesale demand, EDI, manufacturing, large SKU catalogs, and complex purchasing can make disconnected systems difficult to manage.
At that stage, a connected ERP can bring inventory, purchasing, warehouse activity, ecommerce, forecasting, and finance into one operating view.
Businesses reviewing that next step can explore Xorosoft’s broader ERP solutions to understand how those workflows can connect.
The objective should remain practical.
Better 2026 inventory planning data should help companies reduce avoidable stockouts, detect excess inventory earlier, make stronger buying decisions, and use working capital more effectively.
When recurring shortages, overstock, manual purchasing, or disconnected systems continue to limit performance, contact Xorosoft to review whether a connected ERP approach fits the operation.
Frequently Asked Questions
What does 2026 inventory planning data show about stockouts?
It shows that stockouts often result from forecast error, poor inventory accuracy, supplier delays, weak allocation, or stock being held in the wrong warehouse.
How can businesses reduce excess inventory?
Improve forecast bias tracking, update supplier lead times, include open purchase orders, review safety stock, and segment slow-moving SKUs before placing new orders.
What is a good inventory forecast accuracy level?
There is no universal target. Accuracy depends on demand volume, seasonality, forecast horizon, product life cycle, and whether the SKU has stable or intermittent demand.
How can stockouts and overstock happen at the same time?
A business may hold too much inventory overall while lacking the specific SKUs, sizes, components, or warehouse stock needed to meet actual demand.
Which inventory planning KPIs matter most?
Track forecast error, forecast bias, stockout rate, fill rate, inventory turns, weeks of supply, excess inventory, inventory accuracy, lead-time variance, and expedite rate.
When should a business move beyond spreadsheet inventory planning?
Consider upgrading when multiple warehouses, growing SKU counts, ecommerce channels, wholesale demand, manual purchasing, duplicate data entry, or recurring inventory errors make spreadsheets difficult to control.
How can ERP improve inventory planning?
ERP can connect demand, inventory, purchasing, warehouse activity, incoming stock, and finance in one system, helping planners make replenishment decisions from more current and consistent data.
Recent Posts
-
 ERP Landed Cost Module vs Spreadsheet Calculations for Importers
 -
 How to Build an Open-to-Buy Plan for an Omnichannel Brand
 -
 Cold Storage WMS for Food and Beverage Distribution
 -
 ERP Buying Statistics 2026: Evaluation, Implementation, and Adoption Risks
 -
 How a Distributor Reduced B2B Order Exceptions Without Restricting Sales