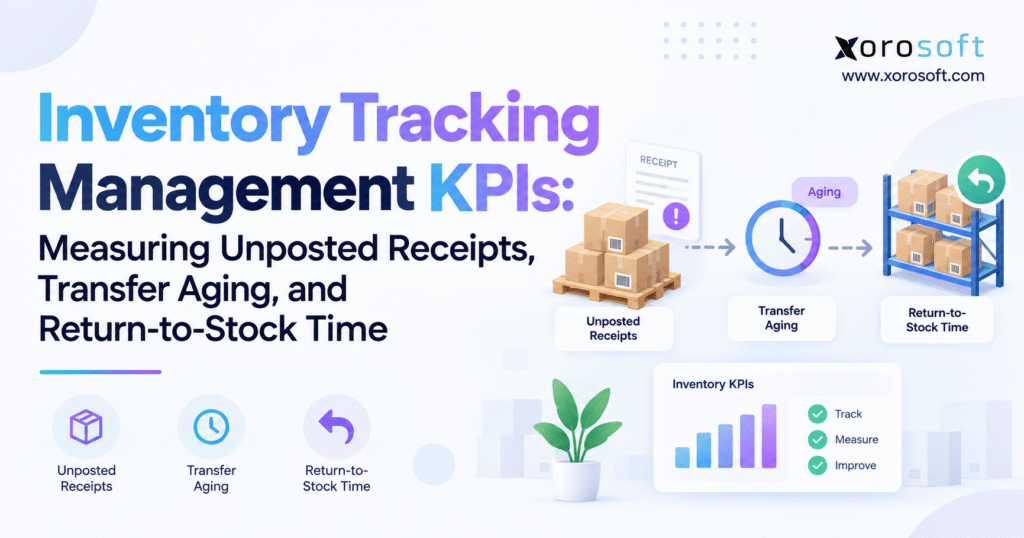
To effectively manage your warehouse or business operations, it’s crucial to understand the most important inventory tracking KPIs.
1. When Physical Inventory and System Inventory Stop Telling the Same Story
Inventory problems are usually described as stockouts, overstocks, count variances, or poor forecasting. Yet many operational failures begin earlier. Inventory exists physically, but the system does not reflect its real status quickly enough.
A shipment may already be sitting at the receiving dock while the purchase receipt remains unposted. Products may have left one warehouse but still show as in transit well after arrival at the destination. Customer returns may physically sit inside the warehouse while remaining unavailable to ecommerce, wholesale, replenishment, and customer service teams.
These timing gaps are difficult to identify when a business looks only at inventory accuracy.
A warehouse may achieve excellent cycle-count accuracy and still struggle with delayed receiving, unresolved transfers, or returns waiting for inspection. The total quantity can eventually reconcile, while the organization spends hours or days making decisions from incomplete inventory information.
That is where inventory tracking KPIs become more useful than a simple count-accuracy percentage. They measure how efficiently inventory moves from one operational state to the next.
1.1 Why Inventory Tracking KPIs Reveal Problems Inventory Accuracy Misses
Inventory accuracy answers an important question: does the inventory recorded in the system match the physical quantity?
It does not always answer whether that inventory is usable right now.
Suppose a company physically owns 10,000 units and its ERP also reports 10,000. The total looks correct. However, 500 units may still be marked as in transit even though they arrived yesterday. Another 200 units may be waiting for return inspection. Some inbound inventory may have reached the building but not yet been posted.
In that situation, the total is accurate while operational availability is not.
Inventory tracking KPIs focus on these state changes. They measure how long it takes a real-world warehouse event to become a reliable system transaction.
1.2 Inventory Transaction Latency Becomes More Expensive as a Business Grows
A small warehouse may fix a delayed receipt manually because someone notices it. At larger scale, dozens or hundreds of similar exceptions can accumulate every day.
The consequences spread quickly.
Purchasing may reorder inventory that already arrived. Ecommerce channels may continue showing products as unavailable. Warehouse teams may create unnecessary replenishment transfers. Finance may spend additional time investigating differences between physical activity and system records.
The problem is not simply that information arrives late. The problem is that other processes act on that delayed information.
As operations scale, inventory latency becomes an operating-control issue rather than a reporting inconvenience.
2. Inventory Tracking KPIs Need Precise Event Definitions
Strong inventory measurement starts with clear event definitions, not dashboards.
Terms such as “received,” “transferred,” and “returned” can mean different things to different teams. Warehouse staff may consider a purchase order received when the truck is unloaded. Finance may consider it received only after the transaction posts. Ecommerce teams may care most about the moment inventory becomes available for sale.
Without consistent start and end events, KPI comparisons become unreliable.
2.1 Inventory Tracking Metrics Should Separate Physical Events From System Events
Every important inventory workflow should identify at least two points: the physical event and the corresponding system event.
For receiving, the first point might be physical receipt confirmation. The second may be the final posted receipt.
For warehouse transfers, the first event is shipment from the source warehouse. The second is receipt at the destination.
For returns, the first event is arrival at the returns area. The final event depends on disposition. Restockable inventory may end when it becomes sellable again, while damaged inventory may end in quarantine, repair, vendor return, or write-off.
This distinction is the foundation of reliable inventory tracking KPIs.
2.2 Measure Backlog, Rate, and Age Separately
One number rarely tells enough of the story.
Backlog shows how many transactions remain unresolved, while rate shows how frequently transactions become exceptions. Age reveals how long those exceptions have been waiting.
Consider two warehouses. One location may have 30 unposted receipts while another has only five. If the first facility processes thousands of receipt lines every day and the second has five receipts open for four days, the smaller backlog may represent the greater operational risk.
For that reason, inventory tracking metrics should combine volume, rate, and age.
2.3 Use the Same Timestamp Definitions Across Locations
Consistency matters more than finding a theoretically perfect timestamp.
If receipt posting latency begins when warehouse staff confirm physical receipt, use that definition everywhere. If transfer aging starts when the transfer shipment posts, use the same rule across all routes.
Once definitions are standardized, managers can compare facilities, suppliers, teams, and time periods without debating what each number means.
3. Inventory Tracking KPIs for Unposted Receipts
Receiving is one of the first places inventory visibility can break.
Products can physically arrive without becoming available digitally. When this happens regularly, a warehouse may appear understocked in the system even though the required inventory is already inside the building.
3.1 What an Unposted Receipt Really Means
An unposted receipt represents inventory that has physically arrived but has not completed the system transaction required to update inventory records.
That does not automatically mean someone forgot to enter data.
A purchase order may not match the shipment. Quantities may require verification. Products may need inspection. A unit-of-measure mismatch may block processing. An ASN may contain incorrect information. A new item may not be configured properly.
The metric therefore measures both receiving efficiency and exception complexity.
3.2 Inventory Tracking KPIs for Unposted Receipt Count
The simplest measure is the current number of physically received transactions that have not been fully posted.
However, document count alone can be misleading. One receipt might contain two items while another contains 150 SKU lines.
For that reason, businesses can track open receipt documents, lines, units, and inventory value separately.
A small number of unposted receipts may represent significant financial exposure if those transactions contain high-value inventory.
3.3 Calculate the Unposted Receipt Rate
A normalized calculation is:
Unposted Receipt Rate = Unposted Receipt Lines ÷ Total Receipt Lines × 100
If a warehouse processes 2,500 receipt lines during a week and 50 remain unresolved, the unposted receipt rate is 2%.
The rate helps compare locations and time periods with different transaction volumes. Yet it should never be interpreted without age.
A low percentage can still hide a serious operational issue if the remaining transactions are extremely old.
3.4 Receipt Posting Latency as an Inventory Tracking KPI
Receipt posting latency measures how long inventory waits between physical receipt and system posting.
Receipt Posting Latency = System Posting Timestamp − Physical Receipt Timestamp
Managers should review more than the average. Median latency shows normal performance. The 75th and 90th percentiles expose slower transactions, while the oldest open receipt identifies the most extreme current exception.
This gives a much clearer picture of receiving health than one average number.
3.5 Age the Receiving Backlog
Aging turns a list of unposted transactions into an operational management tool.
Instead of reporting only “27 open receipts,” classify those transactions by internal SLA status. Categories may include normal, approaching SLA, overdue, and critically overdue.
The actual threshold should reflect the business.
A high-volume ecommerce warehouse may expect straightforward receipts to post quickly. A food, manufacturing, or quality-control environment may require additional validation.
The objective is not to copy someone else’s benchmark. It is to identify inventory that is taking materially longer than expected.
3.6 Find the Root Cause Behind Unposted Receipts
Once delayed receipts are visible, the next step is reason-code analysis.
Supplier discrepancies, missing purchase orders, incorrect pack quantities, damaged goods, barcode issues, quality holds, integration failures, approval requirements, and manual data entry can all cause delays.
The solution depends on the cause.
If most aged receipts come from one supplier, adding warehouse labor will not fix the issue. If transactions consistently stall after quantity verification, the problem may sit in system posting or workflow design.
Strong inventory tracking KPIs reveal where managers should investigate instead of forcing them to guess.
4. Inventory Tracking KPIs for Transfer Aging Between Warehouses
Multi-warehouse operations create a second major visibility gap.
Once stock leaves the source warehouse, it should no longer appear available there. However, it should not become available at the destination until the receiving process confirms arrival.
That period represents legitimate in-transit inventory. Risk begins when inventory remains in that state longer than expected.
4.1 Measure Transfer Aging From Shipment to Receipt
For an open transfer:
Transfer Age = Current Timestamp − Transfer Shipment Timestamp
For a completed transfer:
Transfer Cycle Time = Destination Receipt Timestamp − Transfer Shipment Timestamp
The first calculation identifies current exposure. The second helps establish normal historical performance.
Both belong in a mature set of inventory tracking KPIs.
4.2 Use Transfer Aging Metrics to Track Open Quantity
Document status can hide partial receipts.
Suppose a warehouse ships 1,000 units and the destination receives 960. The transfer is mostly complete, but 40 units remain unresolved.
If reporting focuses only on whether the document was received, those 40 units can disappear inside an otherwise normal-looking transaction.
Transfer reporting should therefore show shipped quantity, received quantity, outstanding quantity, shipment date, expected receipt date, current age, and inventory value.
4.3 Use Route-Specific Transfer Aging
Transfer expectations should reflect the actual route.
A same-city warehouse transfer should not necessarily use the same SLA as inventory moving across the country.
If every transfer uses one company-wide threshold, managers can generate false alarms on longer routes while hiding slow local transfers.
A better approach compares each transfer against the expected cycle time for its specific source-destination pair.
This makes warehouse inventory KPIs more accurate and operationally fair.
4.4 Add Inventory Value to Transfer Aging
Unit count alone does not always show the real risk.
A transfer containing 25 high-value products may matter more than one containing several hundred inexpensive units.
A useful calculation is:
In-Transit Inventory Value = Outstanding Transfer Quantity × Inventory Cost
Combining age and value helps management prioritize the exceptions with the greatest operational or financial impact.
4.5 Transfer Aging Can Reveal More Than Transportation Problems
Aged transfers are not always caused by the carrier.
Inventory may already be at the destination while receiving remains incomplete. Partial quantities may be waiting for investigation. Damaged cartons may be on hold. A barcode issue can stop confirmation. Integration errors can prevent receipt posting.
Repeated aging on one route may indicate a logistics problem. Repeated issues with one SKU could point to packaging or master-data problems.
This is why transfer aging works best as both a transportation metric and a transaction-control metric.
5. Inventory Tracking KPIs for Return-to-Stock Time
Returns create another category of inventory that exists physically but may not yet be usable.
A returned product can sit in a returns cage, inspection queue, quality-control area, repacking station, or quarantine location. Until disposition is completed, the inventory may contribute nothing to sellable availability.
5.1 Define Return-to-Stock Time Carefully
Return-to-stock time measures how long an eligible return takes to move from physical warehouse receipt to sellable inventory.
Return-to-Stock Time = Sellable Release Timestamp − Return Receipt Timestamp
This KPI should be applied only to products that can actually return to sellable stock.
Items routed to repair, refurbishment, vendor return, scrap, or damage disposition follow different workflows and should not automatically be included in the same calculation.
5.2 Do Not Combine Every Return Into One Average
Different return types require different work.
A sealed apparel product may need a simple condition check. Furniture may require damage inspection. Sporting goods or electronics may need functional testing. Food products may face restrictions that prevent resale.
Combining these workflows into one average makes the number difficult to interpret.
Return-to-stock performance should therefore be segmented by product category, condition, return reason, disposition, and warehouse.
5.3 Use Return Inventory KPIs to Measure the Inspection Queue
One of the most useful return inventory KPIs is the number of units waiting for inspection.
Age matters as much as count.
If the queue rises because return volume doubled after a promotion, the issue may be temporary capacity. If return volume stays stable while age increases, process performance may be deteriorating.
The business should also monitor the percentage of returns that eventually become sellable again. That information helps purchasing and planning teams estimate how much inventory is likely to return to availability.
5.4 Balance Return-to-Stock Speed With Inventory Control
Faster processing does not mean releasing every item immediately.
Poor inspection can create a different operational problem: damaged, incomplete, or incorrect products return to available stock.
The correct objective is controlled speed. The warehouse should remove unnecessary waiting without bypassing checks that protect product quality.
6. Inventory Tracking KPIs Reveal Inventory Transaction Latency
Unposted receipts, aging transfers, and return-to-stock time look like separate processes. Operationally, they describe the same condition.
Inventory is waiting between states.
Inbound stock waits between arrival and posting. Transfer stock waits between source shipment and destination receipt. Returned stock waits between arrival and sellable release.
6.1 Physical Inventory Is Not the Same as Available Inventory
As businesses scale, distinguishing ownership from availability becomes more important.
A product may physically be under company control while remaining allocated, damaged, quarantined, under inspection, reserved for production, or waiting for a system transaction.
Inventory systems therefore need to distinguish operational states such as on-hand, available, allocated, incoming, in transit, held, damaged, and returned.
Businesses that need one operating layer across inventory, purchasing, warehouse activity, finance, and reporting can evaluate platforms such as XoroONE when disconnected tools no longer provide enough transaction visibility.
6.2 Inventory Latency Can Distort Purchasing
Inventory visibility delays can create false demand signals.
If an inbound shipment has physically arrived but remains unposted, purchasing may see an artificially low available balance and reorder unnecessarily.
Transfer delays can create the same problem. A destination warehouse may appear short even though inventory already arrived and is simply waiting for receipt confirmation.
Over time, these delays can create unnecessary purchasing, avoidable transfers, and overstock.
6.3 Inventory Tracking Metrics Support Better Forecasting Inputs
Forecasting systems depend on reliable inventory states.
A sophisticated forecast cannot fully compensate for inaccurate available, incoming, in-transit, and returned quantities.
For this reason, inventory tracking KPIs support forecasting indirectly by improving the timeliness and quality of the inventory data being used.
7. Build an Inventory Tracking KPI Dashboard Around Exceptions
An inventory dashboard should do more than display total inventory value and units on hand.
Those numbers are useful, but they do not show where inventory is stuck.
A stronger dashboard puts exceptions at the center.
7.1 Warehouse Managers Need Actionable Inventory Tracking KPIs
Warehouse managers should be able to see current unposted receipts, median receipt latency, oldest open receipt, aging transfers, incomplete destination receipts, returns awaiting inspection, and return-to-stock time.
These metrics should be filterable by warehouse, supplier, product, user, transaction type, reason code, and age.
A connected warehouse management system can support this type of event visibility by capturing activity closer to the physical warehouse process rather than depending on spreadsheets updated later.
7.2 Finance Needs Inventory Tracking Metrics in Financial Context
Finance looks at the same operational events through a different lens.
The team may care about unposted receipt value, aged inventory in transit, adjustments created by timing differences, open transactions near period-end, and returned inventory awaiting disposition.
When warehouse and finance teams use the same transaction history, reconciliation becomes easier.
Instead of comparing disconnected exports, both teams can investigate the same receipt, transfer, adjustment, or return.
7.3 Inventory Control KPIs Need Clear Exception Ownership
Visibility alone does not improve operations.
If a dashboard identifies an 11-day-old transfer but nobody owns transfer reconciliation, the problem remains unresolved.
Different exceptions may belong to different teams. Supplier discrepancies might require purchasing. Quality holds belong to quality control. Posting failures may require ERP administration. Returns inspection may belong to warehouse operations.
Every exception category should have a clear owner and escalation path.
8. Inventory Tracking KPIs Improve With Source-Level Warehouse Data
Inventory latency is difficult to measure accurately when warehouse activity is entered after the fact.
If employees complete physical work and update the system hours later, management cannot easily separate operational processing time from delayed data entry.
The strongest transaction data is captured as close as practical to the physical event.
8.1 Barcode Scanning Strengthens Warehouse Inventory KPI Data
Barcode scanning can create timestamps around receiving, movement, putaway, transfers, picking, packing, and returns.
Scanning does not automatically guarantee accuracy. Teams still need correct labels, item setup, device availability, and consistent work instructions.
However, a disciplined scanning process creates a stronger audit trail than reconstructing movements later.
That becomes important when inventory tracking KPIs are expected to represent actual process time.
8.2 ERP and WMS Should Preserve Transaction History
The operating system should make basic questions easy to answer.
When was inventory received? Who processed it? When did it move? What quantity remained open? When did the destination confirm receipt? Why was the transaction delayed? When did a return become available?
If those questions require multiple exports and manual cross-referencing, the technology stack itself may be contributing to poor visibility.
An integrated ERP platform becomes more useful when inventory events need to connect directly with purchasing, accounting, sales, manufacturing, and reporting.
9. Inventory Visibility Metrics for Multi-Warehouse and Ecommerce Operations
Inventory timing matters even more when several systems depend on the same stock position.
One warehouse may simultaneously support a Shopify storefront, wholesale customers, marketplaces, EDI partners, and other distribution centers.
A delayed inventory transaction can therefore affect several channels at once.
9.1 Inventory Visibility Metrics Depend on Meaningful Integrations
Integration design should not focus only on synchronizing one final inventory quantity.
Operational states matter.
The connected environment may need purchase receipts, allocations, cancellations, transfer status, fulfillment activity, returns, and adjustments to remain aligned.
A stronger integration framework reduces the need for manual reconciliation when ecommerce platforms, marketplaces, warehouses, shipping systems, and accounting tools all rely on the same inventory data.
9.2 Shopify Inventory Depends on Timely Operational Data
Shopify can only display and sell inventory based on the information available to it.
If a return has reached the warehouse but remains under inspection, that unit should not necessarily become available online. Conversely, fully processed inbound inventory should not remain unavailable simply because someone has not updated a separate spreadsheet.
Businesses evaluating an ERP connection can review the Xorosoft ERP app on the Shopify App Store as part of their broader integration research.
The objective should be controlled synchronization rather than simply faster synchronization.
9.3 Multi-Channel Inventory Tracking KPIs Should Share One Definition
Different sales channels should not create different definitions of availability.
If wholesale, Shopify, marketplaces, and other channels all depend on different inventory logic, overselling and reconciliation problems become much harder to diagnose.
The operational system should establish one consistent definition of available inventory and then distribute that information to downstream channels.
This becomes especially important when safety stock, allocations, quality holds, and in-transit inventory affect different channels differently.
10. Inventory Tracking KPIs Should Reflect Industry and Product Complexity
The formulas behind inventory tracking metrics may remain similar across industries, but expected processing times can vary substantially.
That is why universal targets should be treated carefully.
10.1 Apparel Inventory Tracking KPIs
Apparel businesses frequently manage large style-color-size matrices, seasonal demand, ecommerce returns, wholesale commitments, and rebalancing between locations.
Return-to-stock time can be commercially important because seasonal products lose value quickly.
A return that sits unresolved for two weeks near the end of a selling season may have a very different impact from the same delay on an evergreen product.
Transfer aging also matters when companies rebalance fast-selling styles between warehouses or markets.
10.2 Wholesale Distribution Inventory Metrics
Wholesale distributors depend heavily on receiving, allocation, transfers, EDI, purchasing, and customer-specific commitments.
An unposted inbound shipment can make a product appear unavailable even when the warehouse physically has it.
Transfer aging becomes equally important when several distribution centers support different customer territories.
Businesses comparing requirements across wholesale, apparel, furniture, sporting goods, consumer products, food, and manufacturing can use industry-specific ERP requirements as part of system evaluation.
10.3 Furniture and Bulky-Goods Inventory KPIs
Furniture and bulky-goods operations often involve longer handling times, larger storage locations, damage inspection, and slower physical transfers.
These businesses should not compare their cycle times with lightweight parcel inventory without accounting for the difference in work.
A transfer might involve specialized handling, appointments, additional inspection, or multiple physical moves.
The goal is predictable processing with visible exceptions, not necessarily the shortest absolute cycle time.
10.4 Food and Beverage Inventory Visibility Metrics
Food and beverage workflows may add lot tracking, expiry controls, inspection, quarantine, and traceability.
Those controls can legitimately extend receiving or release time.
A useful KPI distinguishes required control time from unnecessary waiting.
Reducing cycle time by bypassing quality or traceability requirements would produce the wrong operational outcome.
For these environments, reason codes are particularly valuable because they show whether inventory is waiting for a valid compliance or quality reason.
10.5 Manufacturing Inventory Tracking Metrics
Manufacturing adds raw materials, components, work in progress, production issues, production receipts, and finished goods.
Inventory latency can therefore occur between warehouse and production processes as well as between warehouses.
If material physically moves to production while the system still treats it as available in storage, planning and replenishment can be distorted.
For manufacturers, inventory tracking KPIs may eventually need to extend into production transactions as well as warehouse transactions.
11. Set Inventory Tracking KPI Targets From Internal Baselines First
External benchmarks can provide context, but the most reliable starting point is the company’s own operating data.
A warehouse should understand its current performance distribution before setting improvement targets.
11.1 Analyze Inventory Tracking KPIs With Median and Percentiles
For receipt latency, transfer aging, and return-to-stock time, measure more than the average.
The median shows typical performance. The 75th and 90th percentiles reveal how slower transactions behave. Maximum age identifies the most extreme current exception.
Together, these measures provide a clearer picture of process health than a simple average.
They also help management separate widespread process issues from a smaller group of unusually difficult exceptions.
11.2 Compare Similar Inventory Workflows
Do not compare simple inbound receiving with receiving that requires inspection.
Likewise, avoid comparing local warehouse transfers with long-distance transfers or sealed returns with products that require testing.
A benchmark becomes useful only when the underlying workflows are sufficiently similar.
The same principle applies across facilities. A distribution center processing full pallets may have a very different receiving profile from a facility handling mixed cartons and individual units.
11.3 Improve the Slow Tail of Inventory Tracking Metrics
Improving an average does not always mean the underlying problem is solved.
A receiving team might reduce average processing time while several unusually old transactions remain unresolved.
Those aged exceptions often matter most. One of the strongest uses of inventory tracking KPIs is identifying the slow tail of the process, where missing ownership, supplier problems, poor master data, integration failures, or outdated workflows tend to surface.
The business should therefore measure both typical flow and exception resolution.
12. When Inventory Tracking Metrics Reveal a Process Problem
A technology change should not be the first response to every inventory issue.
Sometimes the software is capable, but operating discipline is inconsistent.
12.1 Software Cannot Replace Clear Inventory Processes
Missing scans, poor receiving ownership, weak master data, inconsistent return policies, incorrect units of measure, and unmanaged supplier discrepancies remain process problems even after new software is implemented.
Technology can help enforce controls and expose exceptions. It cannot replace clear operating rules.
Before replacing systems, businesses should confirm whether employees are following the existing process and whether that process is documented clearly enough to follow.
12.2 Recognize When the Software Stack Is Creating Friction
Technology becomes a more likely constraint when employees repeatedly enter the same transaction into several applications, transfer status lives in spreadsheets, returns are managed outside inventory, or finance needs manual exports to explain warehouse activity.
These are architecture problems rather than isolated user errors.
At that point, businesses can evaluate broader ERP solutions instead of continuing to add spreadsheets or disconnected point applications around the problem.
12.3 Inventory Control KPIs Should Separate Process and System Causes
Every exception should be classified by cause wherever practical.
A late receipt caused by missing supplier documentation is different from one delayed by an integration failure. A transfer held because of carrier disruption is different from inventory that arrived but was never received in the system.
This classification prevents companies from investing in software to solve a process problem or redesigning a workflow when the real limitation sits in the technology stack.
13. How ERP and WMS Support Inventory Tracking KPIs
Inventory software, warehouse management systems, and ERP platforms overlap in several areas, but they address different levels of operational complexity.
Understanding those differences helps businesses avoid buying more software than they need or expecting a lightweight application to manage processes it was never designed to handle.
13.1 Inventory Software Handles the Core Stock Layer
Standalone inventory applications can work well when the main requirements are item quantities, purchase orders, sales orders, and basic multi-location visibility.
They are often a significant improvement over spreadsheets.
Limitations tend to appear when inventory must connect with deeper warehouse execution, accounting, manufacturing, EDI, advanced purchasing, forecasting, or more complex reporting.
The transition point is usually operational complexity rather than one specific company size.
13.2 WMS Provides Warehouse Inventory KPI Data
A warehouse management system goes deeper into physical warehouse execution.
Receiving, directed putaway, bin control, replenishment, picking, packing, barcode scanning, warehouse movement, transfers, and returns are common WMS responsibilities.
For inventory tracking KPIs, this execution layer often provides the physical-event timestamps needed to measure warehouse latency accurately.
The WMS can show what happened on the warehouse floor, while other systems may provide the financial or commercial context around the same transaction.
13.3 ERP Connects Inventory Tracking Metrics to the Wider Business
ERP becomes more important when inventory events need to affect accounting, purchasing, sales, manufacturing, planning, and reporting.
An unposted purchase receipt is not simply a warehouse problem. It can affect inventory valuation, supplier reconciliation, available stock, replenishment, and period-end reporting.
The right architecture depends on the business. A smaller operation may need only inventory software. A warehouse-intensive organization may prioritize WMS. A growing multi-function business may require both warehouse execution and ERP-level control.
14. Avoid Common Inventory Tracking KPI Mistakes
Poorly designed metrics can create misleading confidence.
The objective should be better operating decisions, not simply more numbers.
14.1 Do Not Measure Only Completed Transactions
Completed transactions describe history. Open transactions describe current risk.
A report containing only completed transfers may show strong performance while several extremely old transfers remain unresolved.
Historical cycle time and current backlog aging should always be reviewed together.
That combination tells management whether the process normally performs well and whether unresolved exceptions are accumulating today.
14.2 Do Not Use Different KPI Definitions Across Warehouses
If one warehouse starts receipt timing when the truck arrives while another starts after quantity verification, the comparison is unreliable.
KPI definitions should be documented and standardized before management begins comparing locations.
Local operational differences can still be accommodated, but the underlying measurement logic should remain consistent.
14.3 Do Not Ignore Partial Inventory Transactions
Partial receipts and partial transfers deserve explicit attention.
A transaction that is 95% complete can still contain the specific SKU a customer needs.
Measure remaining quantity and remaining value rather than relying only on document status.
This approach also prevents partially processed transactions from disappearing from exception reports too early.
14.4 Do Not Turn Inventory KPIs Into Productivity Weapons
Inventory metrics work best as diagnostic tools.
If employees believe every exception will automatically be treated as an individual performance failure, they may rush transactions or choose inaccurate reason codes simply to improve the dashboard.
Management should first investigate process design, supplier behavior, integration reliability, capacity, and ownership.
The purpose of inventory tracking KPIs is to expose operational friction, not encourage people to hide it.
14.5 Do Not Track Exceptions Nobody Owns
A dashboard without accountability creates reporting work rather than operational improvement.
Every exception category should have an owner and escalation process.
That is what turns inventory tracking KPIs from passive reporting into an operating discipline.
15. Put Inventory Tracking KPIs Into a 90-Day Improvement Cycle
Businesses do not need dozens of metrics before they can improve inventory visibility.
A small set of clearly defined measurements is usually more effective than a large dashboard that nobody knows how to act on.
15.1 First 30 Days: Define Events and Build the Baseline
Start with receipt posting latency, transfer aging, and return-to-stock time.
For each metric, define the source transaction, start timestamp, end timestamp, responsible team, status field, and exception reason.
Then collect baseline data before changing the workflow.
This first stage establishes how the operation really performs today.
It also reveals whether the required data exists. If a business cannot reliably identify when a receipt physically occurred, that data gap must be addressed before the KPI can become trustworthy.
15.2 Days 31–60: Segment Inventory Tracking KPI Exceptions
Once the baseline is stable, segment delays by warehouse, supplier, SKU, employee, product category, transfer route, reason code, and transaction type.
Many businesses discover that a large percentage of their exceptions come from a relatively small number of recurring causes.
Instead of saying “receiving is slow,” management may find that most delays come from one supplier’s packaging inconsistencies. Rather than assuming all transfers are late, the data may reveal that one destination facility is not processing receipts on time.
That level of specificity creates a practical improvement plan.
15.3 Assign Ownership to the Correct Function
Different problems require different owners.
Supplier-documentation problems may belong to purchasing. Quality-control holds belong to the quality team. Warehouse scanning problems belong to operations. Integration failures may require systems or ERP administration.
Without ownership, accurate inventory tracking KPIs still have limited operational value.
The same exception should not move between teams for days because nobody knows who is responsible for resolving it.
15.4 Days 61–90: Set SLAs and Automate Exception Reporting
After the business understands normal performance, it can establish meaningful thresholds.
Alerts should focus on transactions approaching or exceeding the internal SLA.
The purpose is not to notify managers about every receipt or transfer. It is to surface the exceptions that require action.
Companies evaluating a larger technology change can review relevant ER`P case studies to understand how similar organizations approached inventory, warehouse, reporting, and system-integration problems.
15.5 Review Root Causes, Not Just KPI Scores
The monthly review should explain why performance changed.
Transfer aging might improve because transportation became faster, or because staff simply closed old transfers manually. Return-to-stock time could fall because inspection capacity increased, or because fewer returns entered the facility.
Good measurement preserves that context.
Organizations with more mature operational data may later make these metrics available to reporting automation or AI workflows. An ERP MCP server can become relevant when teams want governed AI access to ERP data rather than relying on disconnected exports.
16. Practical Takeaway: Use Inventory Tracking KPIs to Find Where Stock Waits
The most important inventory problems are not always visible in the inventory balance.
Sometimes the quantity is correct, but the transaction is late.
That is why inventory tracking KPIs should focus on the points where physical inventory and system inventory temporarily diverge.
16.1 Prioritize the Inventory Tracking Metrics That Expose Delay
For inbound inventory, monitor unposted receipt rate, receipt posting latency, and aged receiving exceptions.
Warehouse movements require open quantity, transfer aging, partial receipt, and in-transit value monitoring.
For customer returns, measure how long eligible products take to move from warehouse receipt through inspection and back into sellable inventory.
Together, these metrics cover three common latency points: inventory entering the business, inventory moving between locations, and returned stock re-entering availability.
16.2 Add Context to Every Inventory Tracking KPI
A KPI becomes far more useful when the business can explain why it changed.
Age, inventory value, supplier, warehouse, transfer route, reason code, product type, and ownership should provide context around the headline metric.
The objective is not to force every transaction to happen instantly. Different industries, products, routes, and quality-control requirements naturally require different processing times.
Instead, establish what normal looks like for each workflow. Identify transactions that fall outside that range and determine whether the delay comes from staffing, supplier behavior, warehouse execution, master data, integration failures, or system design.
16.3 Turn Inventory Visibility Into an Operating Discipline
As operations expand across multiple warehouses, Shopify, marketplaces, wholesale customers, EDI, purchasing, accounting, and manufacturing, delayed inventory information becomes more expensive.
The same stock position influences more teams and more systems.
Start by mapping the physical event and system event for receiving, transfers, and returns. Establish a baseline, measure the slow tail, and assign owners to recurring exceptions.
If inventory control increasingly depends on spreadsheets, duplicate entry, and manual reconciliation between warehouse and financial systems, the operating model may have outgrown its current tools.
Teams that want to review those workflows can contact Xorosoft to evaluate inventory, warehouse, purchasing, accounting, ecommerce, and multi-location requirements.
The most useful inventory dashboard is not the one with the greatest number of metrics. It is the one that identifies where inventory is waiting early enough for the business to act.
Frequently Asked Questions
What are inventory tracking KPIs?
Inventory tracking KPIs measure how accurately and quickly inventory moves between operational states, including receiving, transfers, returns, system posting, and sellable availability.
How do you calculate unposted receipt rate?
Divide unposted receipt lines by total receipt lines, then multiply by 100. Track the percentage alongside backlog age to identify receiving delays that need action.
What is receipt posting latency?
Receipt posting latency is the time between the defined physical receipt event and the system posting event. It shows how long inbound inventory remains operationally invisible.
How do you calculate inventory transfer aging?
Subtract the transfer shipment timestamp from the current time for open transfers. For completed transfers, measure from source shipment to destination receipt.
What is return-to-stock time?
Return-to-stock time measures how long a restockable return takes to move from warehouse receipt through inspection and back into sellable inventory.
Which inventory tracking KPIs matter most?
Start with receipt posting latency, unposted receipt rate, transfer aging, overdue transfer rate, return-to-stock time, and the age and value of unresolved inventory.
When should a business upgrade its inventory system?
Consider an upgrade when spreadsheets, duplicate entry, disconnected warehouse data, manual reconciliation, or poor multi-location visibility prevent teams from tracking inventory states reliably.
Recent Posts
-
 ERP Landed Cost Module vs Spreadsheet Calculations for Importers
 -
 How to Build an Open-to-Buy Plan for an Omnichannel Brand
 -
 Cold Storage WMS for Food and Beverage Distribution
 -
 ERP Buying Statistics 2026: Evaluation, Implementation, and Adoption Risks
 -
 How a Distributor Reduced B2B Order Exceptions Without Restricting Sales