Understanding and tracking inventory management KPIs is crucial for optimising your supply chain and operational efficiency.
1. Why Inventory Management KPIs Belong in the CEO Dashboard
Inventory management KPIs help CEOs understand how inventory affects cash flow, profit margins, fulfillment, forecasting, and operational control. Although inventory often looks like an operations issue, it quickly becomes a leadership issue when stockouts increase, overstock traps cash, or warehouse numbers stop matching accounting reports.
For many product businesses, inventory is the largest working capital investment after payroll. Therefore, a CEO cannot treat inventory visibility as a back-office concern. Every purchasing decision, warehouse movement, sales channel update, and supplier delay can affect revenue, customer experience, and financial reporting.
At the same time, inventory problems rarely appear as one clean issue. A business may have too much inventory overall while still running out of best-selling SKUs. Finance may report strong revenue while cash becomes trapped in slow-moving stock. Meanwhile, warehouse teams may keep fixing urgent fulfillment problems because the system does not show reliable availability.
That is why inventory management KPIs matter. They turn operational activity into business signals. More importantly, they help CEOs ask better questions before small inventory gaps become expensive growth problems.
1.1 How Inventory KPIs Connect Cash, Customers, and Operations
Inventory sits between finance, purchasing, sales, warehouse operations, and customer service. As a result, weak inventory reporting creates problems across the business. Cash flow becomes harder to manage. Sales teams lose trust in available stock. Purchasing teams reorder too early or too late. In addition, warehouse teams spend more time correcting errors instead of improving throughput.
1.2 Why CEOs Do Not Need Every Inventory Metric
A CEO does not need to review every warehouse scan, adjustment, or bin movement. However, leadership does need a clear inventory dashboard that shows whether the business has the right stock, in the right place, at the right time, at the right cost.
1.3 What This Inventory KPI Guide Covers
This guide explains the inventory management KPIs every CEO should track, how each KPI works, why the metric matters, and how the numbers connect to growth. It also shows when weak inventory reporting may signal that the business has outgrown spreadsheets, accounting-only tools, or disconnected inventory apps.
2. What Are Inventory Management KPIs?
Inventory management KPIs are performance measurements that show how well a business buys, stores, sells, moves, and reports inventory. These KPIs help leaders understand whether inventory is supporting growth or creating hidden financial and operational risk.
In simple terms, inventory KPIs answer questions such as:
- Is inventory moving fast enough?
- Is too much cash tied up in stock?
- Are customers facing stockouts?
- Can the warehouse trust system quantities?
- Are suppliers delivering on time?
- Are product margins strong enough to justify inventory investment?
Shopify’s guide to inventory metrics also highlights how inventory data helps businesses avoid stockouts, reduce costs, and understand product performance. Therefore, these metrics are not just useful for warehouse teams. They are also useful for CEOs, CFOs, COOs, and operators.
2.1 Inventory KPIs vs Inventory Metrics
Inventory metrics are data points. Inventory KPIs are the specific metrics that leadership uses to make decisions.
| Area | Inventory Metrics | Inventory KPIs |
|---|---|---|
| Meaning | General inventory data | Decision-driving performance indicators |
| Example | Units counted today | Inventory accuracy rate |
| Main user | Warehouse or operations team | CEO, CFO, COO, finance, operations |
| Purpose | Track activity | Guide action |
| Risk | Too much detail | Weak context if viewed alone |
For example, the number of units picked yesterday is a useful warehouse metric. However, pick accuracy becomes a KPI when it shows whether fulfillment quality is improving or declining.
2.2 Why Inventory Management KPIs Need Business Context
Inventory management KPIs should never be reviewed in isolation. A high inventory turnover ratio may look strong, but it may also mean the company is understocked. Similarly, low days inventory outstanding may improve cash flow, but it can create stockout risk if supplier lead times are long.
Therefore, CEOs should review inventory KPIs together. Turnover, DIO, stockout rate, fill rate, inventory accuracy, forecast accuracy, and carrying cost create a much clearer picture when they are viewed as one system.
3. Why Inventory Management KPIs Matter to CEOs
Inventory management KPIs matter because they show whether inventory is helping or hurting the business. Although revenue may look strong, inventory can quietly damage cash flow, margins, and customer satisfaction.
3.1 Inventory KPIs Reveal Working Capital Risk
Inventory is cash before it becomes revenue. Therefore, if stock sits too long, the business loses flexibility. Cash that could support marketing, hiring, product development, supplier discounts, or expansion stays locked inside warehouse shelves.
Days inventory outstanding, inventory turnover, carrying cost, and dead stock percentage help CEOs understand how much working capital is trapped in inventory.
3.2 Inventory KPIs Show Margin Leakage
Margin leakage often hides inside inventory. For instance, excess stock creates storage costs, markdowns, write-offs, emergency transfers, and warehouse congestion. In addition, shrinkage and inaccurate inventory valuation can reduce profit without showing up as an obvious sales problem.
Because of this, CEOs should review GMROI, carrying cost, shrinkage, dead stock, and sell-through rate together.
3.3 Inventory KPIs Expose Fulfillment Risk
Customers do not care that a system showed stock as available. They care whether the order ships correctly and on time. Therefore, stockout rate, fill rate, inventory accuracy, and order fulfillment accuracy are critical CEO inventory metrics.
When these numbers decline, the business may be losing trust before it sees the full revenue impact.
3.4 Inventory Metrics Improve Forecasting and Purchasing Decisions
Purchasing decisions become expensive when they rely on outdated reports. However, strong inventory management KPIs help teams plan with better demand signals, supplier lead times, sales velocity, warehouse availability, and channel-level stock data.
As a result, CEOs can see whether purchasing is disciplined or reactive.
4. CEO Inventory Dashboard: The Core Inventory KPIs to Track
A CEO inventory dashboard should include financial, operational, purchasing, forecasting, warehouse, and multi-location KPIs. Together, these inventory management KPIs show whether the business has healthy stock movement, reliable availability, and enough visibility to scale.
4.1 Financial Inventory KPIs
Financial inventory KPIs show how inventory affects cash and margin.
| KPI | What It Tells the CEO |
| Inventory turnover ratio | How efficiently inventory converts into sales |
| Days inventory outstanding | How long cash stays tied up in stock |
| Inventory carrying cost | How much it costs to hold inventory |
| GMROI | How much gross margin inventory generates |
4.2 Operational Inventory KPIs
Operational inventory KPIs show whether stock is available, accurate, and ready to fulfill demand.
| KPI | What It Tells the CEO |
| Inventory accuracy | Whether system inventory matches physical stock |
| Stockout rate | How often demand cannot be fulfilled |
| Fill rate | How much demand is fulfilled from available stock |
| Order fulfillment accuracy | Whether customers receive the right items |
4.3 Purchasing and Forecasting Inventory Metrics
Purchasing and forecasting inventory metrics show whether the business is planning inventory effectively.
| KPI | What It Tells the CEO |
| Forecast accuracy | Whether demand planning is reliable |
| Supplier lead time | How long replenishment takes |
| Reorder point accuracy | Whether reorder logic prevents stockouts |
| Safety stock effectiveness | Whether buffer stock protects demand without excess |
4.4 Warehouse and Multi-Location Inventory KPIs
Warehouse and multi-location inventory KPIs show whether stock is controlled across locations.
| KPI | What It Tells the CEO |
| Pick accuracy | Whether warehouse teams pick correctly |
| Cycle count accuracy | Whether counts validate system inventory |
| Transfer accuracy | Whether movement between locations is reliable |
| Warehouse stock availability | Whether each location can fulfill demand |
5. Inventory Turnover Ratio as a Core Inventory KPI
Inventory turnover ratio is one of the most important inventory management KPIs because it shows how often a business sells and replaces inventory during a period.
5.1 Inventory Turnover Formula
Inventory Turnover Ratio = Cost of Goods Sold / Average Inventory Value
5.2 Why Inventory Turnover Matters to CEOs
Inventory turnover tells leadership whether inventory is productive. A low turnover ratio may point to overbuying, slow-moving SKUs, weak demand, poor merchandising, or poor forecasting. However, a very high turnover ratio can also be risky if it leads to frequent stockouts.
5.3 How CEOs Should Interpret This Inventory Metric
The right turnover ratio depends on product type, margin, supplier lead time, and demand pattern. For example, food products, apparel basics, and consumables may turn quickly. However, furniture, specialty goods, and seasonal products may naturally move more slowly.
Therefore, CEOs should review turnover by SKU, category, location, and sales channel instead of relying only on one company-wide average.
6. Days Inventory Outstanding as a Cash Flow KPI
Days inventory outstanding, often called DIO, shows how many days inventory stays in the business before it sells. Because DIO connects directly to working capital, it is one of the most useful inventory management KPIs for CEOs.
6.1 DIO Formula for Inventory Reporting
Days Inventory Outstanding = Average Inventory / Cost of Goods Sold × 365
6.2 Why DIO Matters for Inventory Cash Flow
DIO shows how long cash remains locked in inventory. If DIO rises, the business may be buying faster than it sells. However, if DIO falls too low while stockout rate increases, the company may be understocked.
6.3 How to Use This Inventory KPI by Category
A company-wide DIO number can hide problems. For example, fast-moving SKUs may make the average look healthy while slow-moving categories quietly trap cash. Therefore, CEOs should review DIO by product category, supplier, warehouse, and channel.
7. Inventory Carrying Cost as a Profitability KPI
Inventory carrying cost measures the cost of holding inventory beyond the purchase price. This KPI matters because holding inventory creates hidden expenses even when products are not moving.
7.1 Inventory Carrying Cost Formula
Inventory Carrying Cost % = Total Carrying Costs / Average Inventory Value × 100
7.2 What This Inventory Metric Includes
Carrying cost may include warehouse rent, labor, insurance, financing, shrinkage, damage, obsolescence, depreciation, and opportunity cost. In addition, excess inventory can slow warehouse productivity because teams must handle, count, move, and manage unnecessary stock.
7.3 Why CEOs Should Watch Carrying Cost
Carrying cost turns inventory from an asset into a drag on cash flow. Therefore, CEOs should watch this KPI when warehouse space feels tight, markdowns increase, or slow-moving stock keeps growing.
8. GMROI as an Inventory Profitability KPI
Gross margin return on inventory, or GMROI, measures how much gross margin the business earns for every dollar invested in inventory. It is one of the strongest inventory management KPIs for connecting stock decisions to profit.
8.1 GMROI Formula for Inventory Performance
GMROI = Gross Margin / Average Inventory Cost
8.2 Why This Inventory KPI Matters More Than Revenue Alone
Revenue can hide poor inventory economics. For example, a product may sell well but require heavy discounting, expensive storage, frequent transfers, or high return rates. Therefore, GMROI helps CEOs understand whether inventory is creating profitable movement.
8.3 How CEOs Can Use GMROI in Inventory Decisions
CEOs can use GMROI to review SKU strategy, category investment, markdown decisions, purchasing priorities, and product expansion. As a result, the company can invest more confidently in products that generate strong margin from inventory dollars.
9. Stockout Rate as a Customer Service KPI
Stockout rate measures how often demand cannot be fulfilled because inventory is unavailable. Since stockouts affect revenue and customer trust, this is one of the inventory management KPIs CEOs should review often.
9.1 Stockout Rate Formula
Stockout Rate = Stockout Events / Total Demand Events × 100
9.2 Why Stockouts Make Inventory KPIs More Urgent
A stockout does not only delay one order. It can push customers to competitors, reduce repeat purchases, hurt marketplace performance, and damage wholesale relationships. In addition, stockouts often create internal pressure because teams must offer substitutions, split shipments, or rush purchase orders.
Shopify’s enterprise guide to streamlining inventory management also highlights stockout rate by SKU and location as an important inventory management KPI for improving operations.
9.3 Why CEOs Should Review This Inventory KPI by Channel
A blended stockout rate is not enough. Shopify, Amazon, wholesale, retail, and EDI customers may experience stockouts differently. Therefore, channel-level reporting helps CEOs see where lost sales and service issues are happening.
10. Fill Rate as an Inventory Service KPI
Fill rate measures how much demand is fulfilled from available inventory. It is especially important for wholesale, ecommerce, and multi-location businesses.
10.1 Fill Rate Formula
Fill Rate = Units Fulfilled / Units Ordered × 100
10.2 Why Fill Rate Matters in Inventory Reporting
Fill rate shows whether the business can meet demand without delays, partial shipments, or backorders. When fill rate drops, customer service issues usually increase. In addition, wholesale customers may lose confidence if orders regularly ship incomplete.
10.3 Fill Rate vs Stockout Rate
Stockout rate shows how often inventory is unavailable. Fill rate shows how much demand the company fulfills. Because these KPIs measure different parts of availability, CEOs should review both.
11. Inventory Accuracy as a Trust KPI
Inventory accuracy measures whether recorded inventory matches physical inventory. Without accurate inventory, every other inventory KPI becomes less reliable.
11.1 Inventory Accuracy Formula
Inventory Accuracy = Accurate Inventory Records / Total Inventory Records Checked × 100
11.2 Why Inventory Accuracy Matters
If the system says 500 units exist but the warehouse has 420, purchasing, sales, finance, and fulfillment all make decisions from the wrong number. Therefore, inventory accuracy affects stockouts, overselling, purchasing plans, month-end close, and customer experience.
11.3 How This Inventory KPI Affects Accounting
Accounting teams rely on inventory valuation. However, if receipts, transfers, shipments, adjustments, and counts are inaccurate, month-end close becomes harder to trust. Over time, finance may spend more time reconciling inventory than analyzing the business.
12. Sell-Through Rate as an Inventory Movement KPI
Sell-through rate measures how much received inventory sells during a specific period. It is one of the best inventory management KPIs for ecommerce, apparel, seasonal products, launches, and promotional planning.
12.1 Sell-Through Rate Formula
Sell-Through Rate = Units Sold / Units Received × 100
12.2 Why Sell-Through Matters in Inventory Management
Sell-through shows whether inventory is moving at the expected pace. If sell-through is weak early in a season, the business may need pricing changes, promotions, bundles, channel shifts, or purchasing adjustments.
12.3 How This Inventory KPI Reduces Markdown Risk
Markdowns often happen because teams react too late. However, sell-through rate gives leadership an earlier warning. As a result, teams can make changes before stock becomes dead inventory.
13. Forecast Accuracy as an Inventory Planning KPI
Forecast accuracy measures how closely projected demand matches actual demand. Since forecasting errors usually become stockouts or overstock, this is one of the most important inventory management KPIs for growing product businesses.
13.1 Forecast Accuracy Formula
Forecast Accuracy = 100 – Forecast Error Percentage
Forecast Error % = Absolute Forecast Error / Actual Demand × 100
13.2 Why Forecast Accuracy Matters for Inventory Management KPIs
Poor forecast accuracy creates two expensive outcomes. If demand is underestimated, the business loses sales through stockouts. If demand is overestimated, cash gets trapped in excess inventory. Therefore, CEOs should review forecast accuracy with purchasing, sales, and warehouse teams.
13.3 Common Causes of Poor Inventory Forecasting Metrics
Forecasts often fail because sales channels are disconnected, supplier lead times are changing, seasonality is ignored, or planning still happens in spreadsheets. In addition, promotions, marketplace shifts, and wholesale orders can distort demand if they are not included properly.
14. Supplier Lead Time as a Replenishment KPI
Supplier lead time measures how long it takes to receive inventory after a purchase order is placed. This KPI helps CEOs understand replenishment risk.
14.1 Supplier Lead Time Formula
Supplier Lead Time = Delivery Date – Purchase Order Date
14.2 Why Lead Time Variability Affects Inventory KPIs
Average lead time is useful. However, variability matters even more. A supplier that sometimes delivers in 20 days and sometimes in 45 days creates planning risk. Therefore, reorder points and safety stock should reflect actual supplier behavior.
14.3 How CEOs Should Review Supplier Inventory Performance
CEOs should review lead time by supplier, product category, country, season, and SKU. Then, they should compare lead time trends against stockout rate, purchase order changes, carrying cost, and excess inventory.
15. Dead Stock and Obsolete Inventory KPIs
Dead stock is inventory that has not sold or moved for a long period. Obsolete inventory is stock that no longer has realistic demand or usable value.
15.1 Dead Stock Formula
Dead Stock % = Dead Stock Value / Total Inventory Value × 100
15.2 Why Dead Stock Is a CEO Inventory Metric
Dead stock consumes cash, warehouse space, labor, and attention. In addition, it can distort inventory value if the business does not write down inventory properly.
15.3 How Dead Stock Affects Inventory Growth
Cash spent on dead stock cannot support new products, supplier discounts, hiring, marketing, or expansion. Therefore, CEOs should review dead stock with DIO, inventory turnover, GMROI, and sell-through rate.
16. Inventory Shrinkage as a Control KPI
Inventory shrinkage measures stock loss caused by theft, damage, miscounts, administrative errors, fraud, or weak controls. Because shrinkage reduces margin, it belongs in the CEO inventory dashboard.
16.1 Inventory Shrinkage Formula
Inventory Shrinkage % = Inventory Loss Value / Recorded Inventory Value × 100
16.2 Why Shrinkage Impacts Inventory Margins
Shrinkage turns purchased inventory into lost value. Although a small percentage may look harmless, the impact becomes serious when inventory volume grows. Therefore, rising shrinkage should trigger a process review.
16.3 What This Inventory KPI Usually Signals
Shrinkage may point to weak receiving, poor cycle counting, damaged goods, return issues, theft, transfer errors, or inaccurate adjustments. As a result, CEOs should ask where shrink happens and which process owns the fix.
17. Inventory KPIs by Business Model
Different businesses need different inventory management KPIs. Although the core metrics stay similar, the priority changes by sales channel, product type, warehouse structure, and operating model.
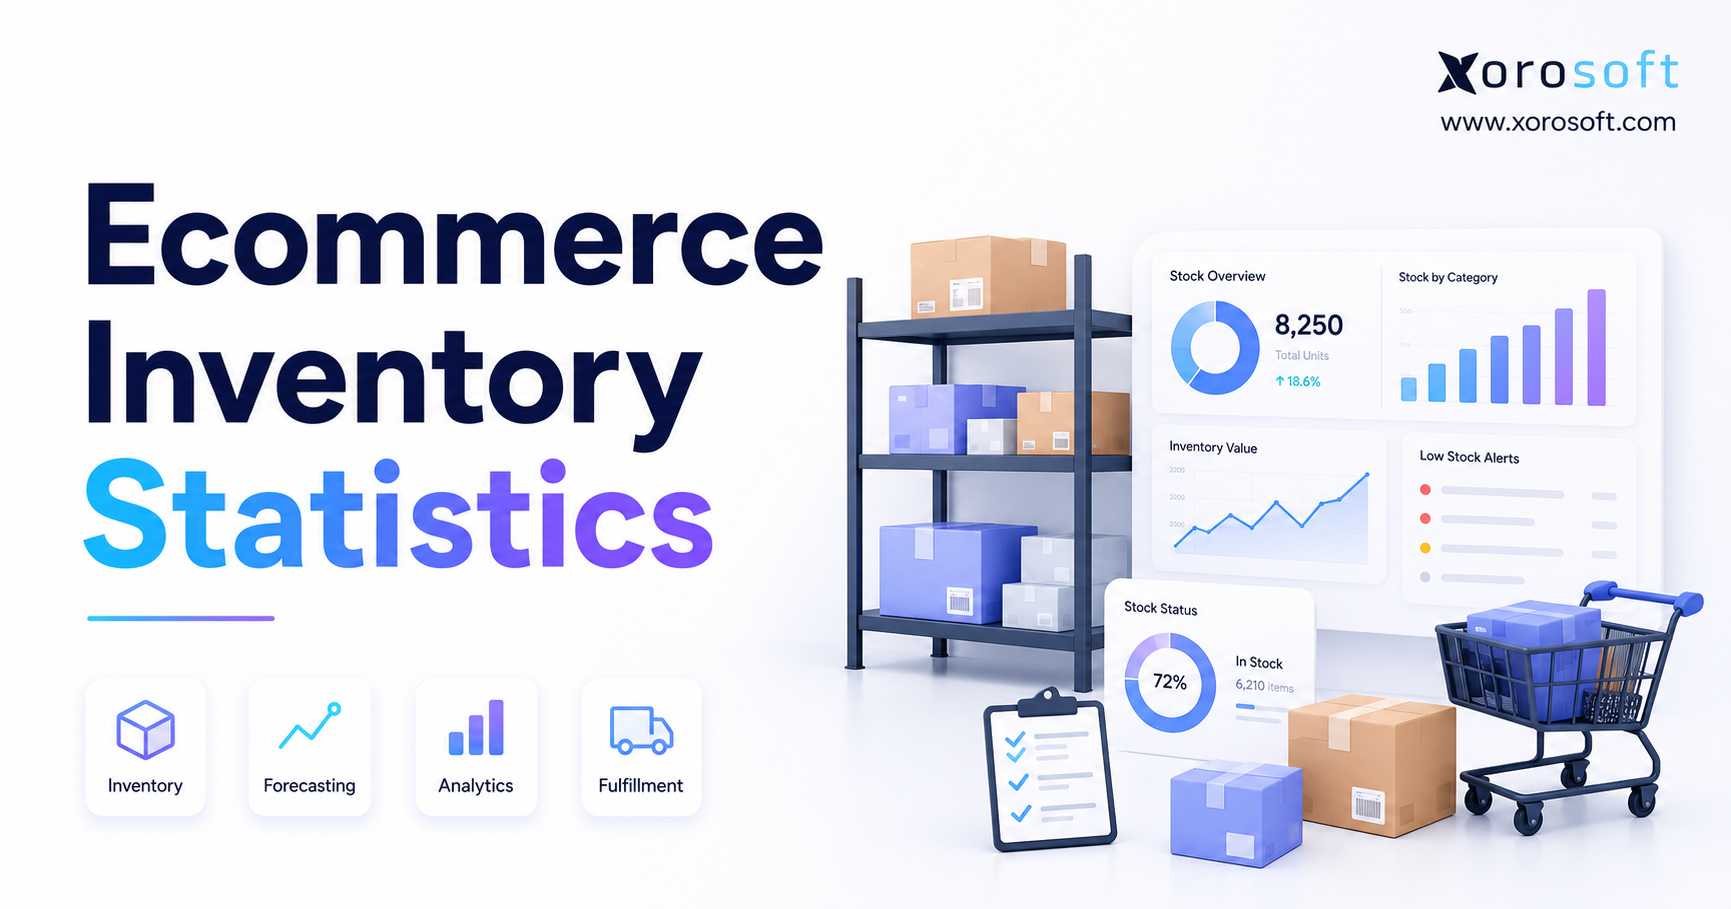
17.1 Ecommerce Inventory KPIs
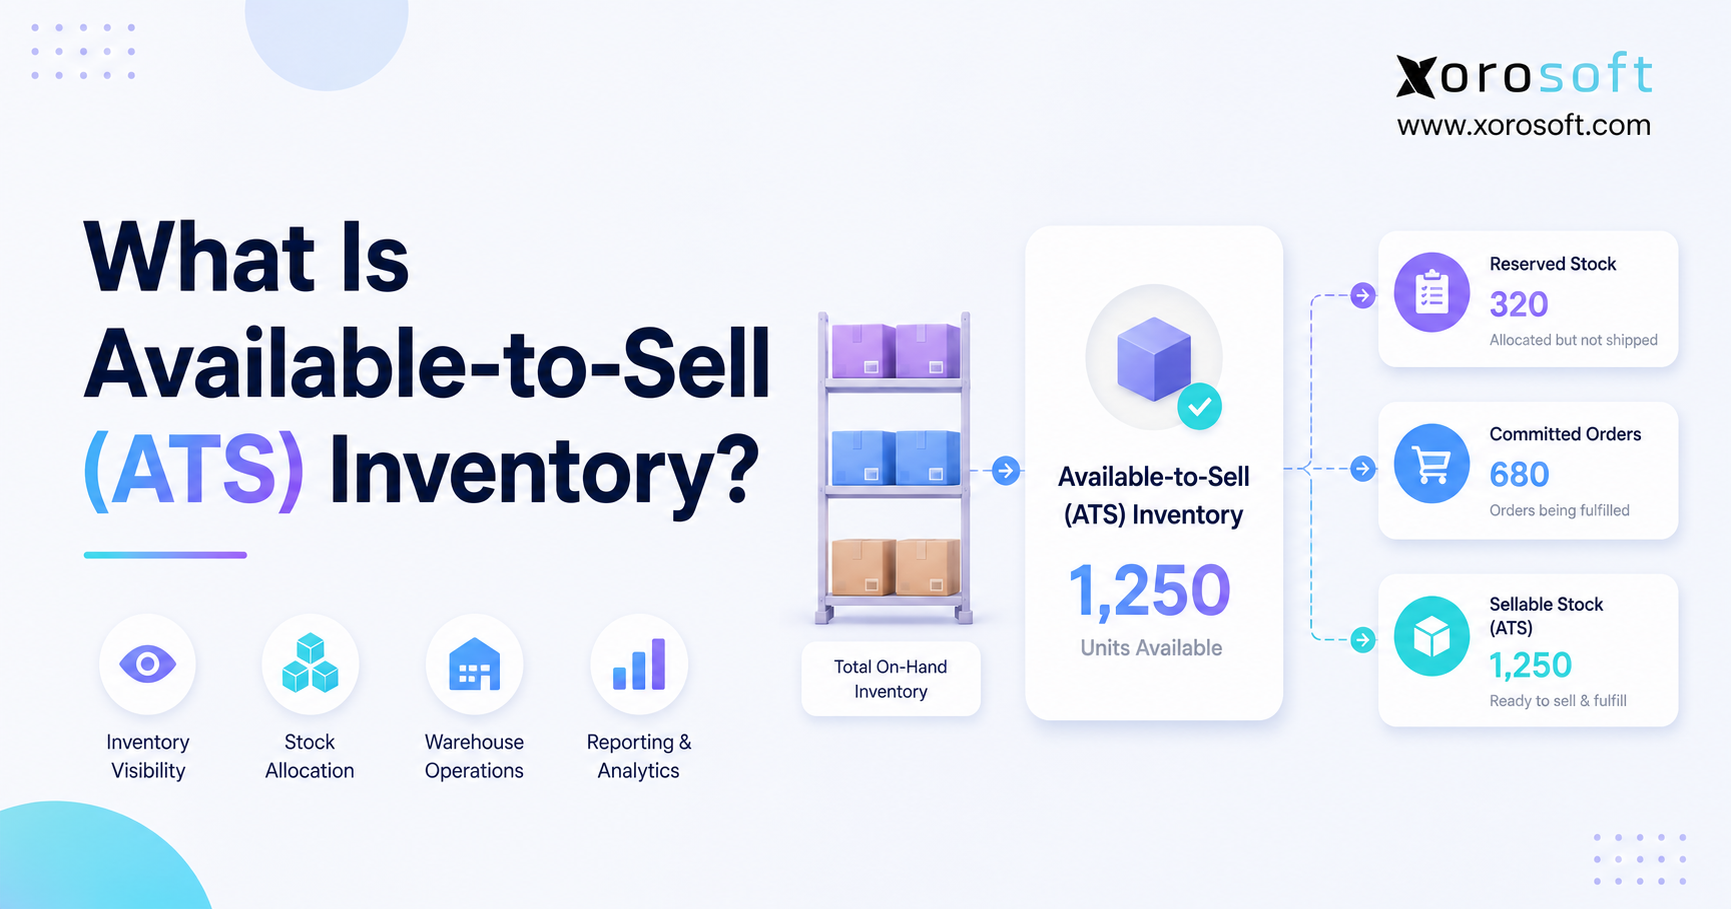
Ecommerce businesses should track stockout rate, sell-through rate, inventory accuracy, available-to-sell inventory, fulfillment accuracy, return rate, channel-level availability, and inventory turnover.
For Shopify brands, inventory performance is closely tied to conversion and fulfillment. Therefore, merchants should also monitor whether inventory is syncing properly across channels. Xorosoft is available on the Shopify App Store, which makes this especially relevant for Shopify merchants that need connected inventory, accounting, warehouse, and purchasing workflows.
17.2 Wholesale Inventory KPIs
Wholesale businesses should prioritize fill rate, order completeness, customer-level stock availability, allocation accuracy, supplier lead time, backorder rate, and EDI fulfillment accuracy.
Because wholesale customers often place larger orders, a small inventory issue can affect major accounts. Therefore, CEOs should review fill rate by customer, not only by total order volume.
17.3 Manufacturing Inventory KPIs
Manufacturers should track raw material availability, BOM accuracy, work order material variance, finished goods availability, supplier lead time, production schedule adherence, and inventory valuation accuracy.
When raw materials are unavailable, production slows down even if finished goods demand is strong. As a result, manufacturing inventory KPIs must connect purchasing, production, and warehouse data.
17.4 Multi-Warehouse Inventory KPIs
Multi-warehouse businesses should track location-level inventory accuracy, transfer accuracy, transfer time, pick accuracy, stock availability by warehouse, and stockout rate by location.
If the business is expanding across warehouses, regions, or fulfillment models, reviewing the industries we serve can help connect inventory KPI priorities to the needs of apparel, furniture, sporting goods, food, wholesale, and manufacturing companies.
18. Inventory KPI Benchmarks: What Is Good, Bad, or Risky?
Inventory KPI benchmarks depend on industry, product category, margin, demand volatility, supplier lead time, and channel mix. Therefore, CEOs should avoid using one universal benchmark for every SKU.
18.1 Why There Is No Universal Inventory KPI Benchmark
A high turnover ratio may be excellent for fast-moving products. However, the same ratio may be risky for imported goods with long lead times. Similarly, low DIO may support cash flow, but it can create stockouts if safety stock is too lean.
18.2 How to Set Internal Inventory KPI Benchmarks
Start with historical performance. Then, segment inventory management KPIs by SKU, category, supplier, channel, and warehouse. Over time, trend lines become more useful than generic industry averages.
18.3 Inventory KPI Warning Signs CEOs Should Watch
| Warning Sign | What It Usually Means | CEO Action |
| Rising DIO | Cash is staying in inventory longer | Review purchasing and demand planning |
| Low turnover | Stock is moving too slowly | Review slow SKUs and category strategy |
| High stockout rate | Demand is not being fulfilled | Review forecast accuracy and reorder points |
| Low inventory accuracy | System quantities do not match reality | Review warehouse processes and cycle counts |
| Rising shrinkage | Inventory control is weakening | Review receiving, transfers, returns, and adjustments |
19. Common Mistakes CEOs Make with Inventory KPIs
Most inventory KPI problems do not happen because companies lack data. Instead, they happen because teams lack clean, timely, and connected reporting.
19.1 Tracking Too Many Inventory Metrics
A CEO dashboard should not become a warehouse report. Instead, it should focus on the inventory management KPIs that affect cash, margin, service, and risk.
19.2 Looking at Revenue Without Inventory Efficiency
Revenue growth can hide poor inventory discipline. For example, sales may rise while carrying cost, dead stock, and markdowns also increase. Therefore, CEOs should review revenue alongside inventory turnover, GMROI, and DIO.
19.3 Reviewing Inventory KPIs Too Late
Monthly reporting is useful. However, stockout rate, forecast exceptions, supplier delays, and fulfillment issues may need weekly review. Otherwise, leadership may discover the problem only after customers feel it.
19.4 Trusting Spreadsheet Inventory Data Without Validation
Spreadsheets can work in the early stage. However, they become risky when the business operates Shopify, Amazon, wholesale, EDI, purchasing, warehouse, and accounting workflows separately.
19.5 Ignoring Warehouse and Accounting Inventory Alignment
Inventory reporting should match both physical movement and financial value. If warehouse records and accounting records disagree, leadership cannot trust margin, COGS, valuation, or availability.
19.6 Inventory Visibility Checkpoint
If your inventory management KPIs are hard to trust, it may be time to review whether your systems can support accurate inventory, purchasing, warehouse, and accounting visibility. A platform like XoroERP can help inventory-driven businesses connect these workflows more clearly.
20. How ERP Systems Improve Inventory KPI Reporting
ERP systems improve inventory KPI reporting by connecting inventory, purchasing, warehouse, accounting, manufacturing, ecommerce, and reporting data. As a result, CEOs can review inventory management KPIs from shared operational records instead of disconnected spreadsheets.
20.1 Real-Time Inventory Visibility
Real-time visibility matters because delayed inventory data creates delayed decisions. With XoroONE, inventory-driven teams can connect operational workflows in one system, which makes inventory reporting easier to trust as the business grows.
20.2 Connected Warehouse and Inventory Workflows
Warehouse activity affects every inventory KPI. Receipts, picks, transfers, adjustments, cycle counts, and shipments all change inventory performance. Therefore, a connected warehouse system is critical.
For teams that need stronger warehouse execution, XoroWMS supports inventory movement, warehouse visibility, and fulfillment workflows inside a broader operational system.
20.3 Better Forecasting and Inventory Replenishment Decisions
Forecasting improves when sales, purchasing, supplier, and warehouse data are connected. Otherwise, teams often reorder from outdated reports. Consequently, ERP reporting helps leaders understand whether purchasing decisions match actual demand.
20.4 Better Inventory Software Comparison During Evaluation
When companies compare systems, they should look beyond feature lists. They should ask whether the platform supports inventory, accounting, warehouse, purchasing, ecommerce, and reporting workflows together.
For businesses moving beyond accounting-first tools, the Xorosoft vs QuickBooks comparison can be useful. Meanwhile, brands evaluating inventory-focused platforms may also want to review Xorosoft vs Cin7. These comparisons fit this topic because inventory KPI reporting often breaks when companies outgrow disconnected tools.
21. When Should a Business Upgrade Inventory KPI Reporting?
A business should upgrade inventory KPI reporting when leadership can no longer trust the speed, accuracy, or completeness of its inventory data.
21.1 When Inventory Reports Take Too Long
If teams need days to prepare basic inventory reports, the business is already operating with delayed visibility. Therefore, leadership may be making decisions from outdated information.
21.2 When Teams Disagree on Inventory Numbers
Sales, warehouse, purchasing, and accounting should not work from different inventory numbers. If they do, the business likely has a system problem, not just a reporting problem.
21.3 When Stockouts and Overstock Happen Together
This is one of the clearest signs of weak inventory planning. The company may have too much stock overall, but not enough of the right products in the right locations.
21.4 When Accounting Cannot Trust Inventory Valuation
Inventory valuation affects COGS, margins, and month-end close. If finance cannot trust inventory movement, leadership cannot trust financial reporting either.
21.5 When Growth Creates Multi-System Inventory Complexity
Growth often adds more tools. A business may run Shopify, Amazon, wholesale orders, EDI, QuickBooks, warehouse apps, purchasing spreadsheets, and reporting exports at the same time. However, more tools do not automatically create better visibility.
For a broader view of platform options, the main Xorosoft comparison page can help teams understand how different ERP and inventory systems are positioned.
22. Inventory KPI Dashboard Example for CEOs
A strong CEO dashboard should separate weekly execution, monthly financial review, and board-level reporting. This structure keeps inventory management KPIs practical instead of overwhelming.
22.1 Weekly CEO Inventory KPI Dashboard
| KPI | Why It Matters |
| Stockout rate | Shows immediate revenue risk |
| Fill rate | Shows fulfillment reliability |
| Inventory accuracy | Shows whether teams can trust stock data |
| Forecast exceptions | Shows planning risk |
| Supplier delays | Shows purchasing risk |
22.2 Monthly CEO Inventory KPI Dashboard
| KPI | Why It Matters |
| Inventory turnover | Shows movement efficiency |
| DIO | Shows cash tied up in stock |
| GMROI | Shows inventory profitability |
| Carrying cost | Shows hidden inventory expense |
| Dead stock % | Shows trapped cash |
22.3 Board-Level Inventory KPI Dashboard
| KPI | Why It Matters |
| Inventory value | Shows capital allocation |
| Inventory-to-sales ratio | Shows inventory position versus revenue |
| Gross margin return on inventory | Shows return on inventory investment |
| Shrinkage | Shows control risk |
| Service-level trend | Shows customer fulfillment reliability |
23. Inventory Management KPI Table
The table below summarizes the inventory management KPIs CEOs should track most often.
| Inventory KPI | Formula | CEO Meaning |
| Inventory turnover ratio | COGS / Average inventory | Shows how efficiently stock converts into sales |
| Days inventory outstanding | Average inventory / COGS × 365 | Shows how long cash sits in inventory |
| Carrying cost % | Carrying costs / Average inventory × 100 | Shows cost of holding inventory |
| GMROI | Gross margin / Average inventory cost | Shows margin return on stock investment |
| Stockout rate | Stockout events / Demand events × 100 | Shows lost-sales risk |
| Fill rate | Units fulfilled / Units ordered × 100 | Shows service reliability |
| Inventory accuracy | Accurate records / Checked records × 100 | Shows whether system stock matches reality |
| Sell-through rate | Units sold / Units received × 100 | Shows product movement |
| Forecast accuracy | 100 – Forecast error % | Shows demand planning quality |
| Supplier lead time | Delivery date – PO date | Shows replenishment timing |
| Dead stock % | Dead stock value / Total inventory value × 100 | Shows trapped cash |
| Shrinkage % | Inventory loss / Recorded inventory value × 100 | Shows loss and control risk |
24. FAQs About Inventory Management KPIs
24.1 What are inventory management KPIs?
Inventory management KPIs are performance measurements that show how well a business buys, stores, sells, moves, and reports inventory. They help CEOs understand cash flow, stock availability, warehouse accuracy, purchasing quality, fulfillment risk, and profitability.
24.2 Which inventory KPIs should CEOs track?
CEOs should track inventory turnover, days inventory outstanding, carrying cost, GMROI, stockout rate, fill rate, inventory accuracy, sell-through rate, forecast accuracy, supplier lead time, dead stock, and shrinkage. Together, these inventory management KPIs show cash, margin, and service risk.
24.3 What is the most important inventory KPI?
There is no single most important inventory KPI for every business. However, inventory turnover, DIO, stockout rate, GMROI, and inventory accuracy are usually the most useful CEO inventory metrics because they connect stock performance to cash flow and profitability.
24.4 How often should CEOs review inventory KPIs?
CEOs should review urgent inventory KPIs weekly and financial inventory KPIs monthly. For example, stockout rate, fill rate, forecast exceptions, and supplier delays may need weekly review. Meanwhile, turnover, DIO, GMROI, carrying cost, and dead stock usually fit monthly reporting.
24.5 What is inventory turnover ratio?
Inventory turnover ratio shows how many times a business sells and replaces inventory during a period. It is calculated as cost of goods sold divided by average inventory value. Therefore, it helps CEOs understand whether inventory is moving efficiently.
24.6 What is a good inventory turnover ratio?
A good inventory turnover ratio depends on industry, product type, supplier lead time, and margin. Fast-moving products usually turn more often, while furniture, specialty goods, and seasonal items may move more slowly. Therefore, CEOs should compare turnover by category.
24.7 What is days inventory outstanding?
Days inventory outstanding measures how long inventory sits before it sells. It helps CEOs understand how much time cash remains inside stock. A rising DIO may suggest overbuying, weak demand, slow-moving SKUs, or poor purchasing discipline.
24.8 What is inventory carrying cost?
Inventory carrying cost is the cost of holding inventory. It can include storage, labor, insurance, financing, shrinkage, obsolescence, damage, and opportunity cost. Because these costs reduce margin, carrying cost belongs in the CEO inventory dashboard.
24.9 What is GMROI?
GMROI stands for gross margin return on inventory. It shows how much gross margin the business earns from each dollar invested in inventory. As a result, GMROI helps CEOs decide which products deserve more inventory investment.
24.10 What is stockout rate?
Stockout rate measures how often demand cannot be fulfilled because inventory is unavailable. A high stockout rate can reduce revenue, weaken customer trust, damage marketplace performance, and create pressure on purchasing and fulfillment teams.
24.11 What is fill rate?
Fill rate measures how much demand is fulfilled from available stock. It is especially important for wholesale, ecommerce, and multi-location businesses because it shows whether inventory supports customer commitments.
24.12 What is inventory accuracy?
Inventory accuracy measures whether recorded stock matches physical stock. If inventory accuracy is weak, sales, purchasing, finance, and warehouse teams may all make decisions from unreliable numbers. Therefore, this KPI affects nearly every other inventory management KPI.
24.13 What is sell-through rate?
Sell-through rate shows the percentage of received inventory that sells during a specific period. It helps businesses understand product movement, seasonal performance, markdown risk, and demand quality.
24.14 What is forecast accuracy?
Forecast accuracy measures how closely predicted demand matches actual demand. Better forecast accuracy helps reduce stockouts, overstock, emergency purchasing, and cash flow pressure. Therefore, it is an important KPI for scaling inventory-driven businesses.
24.15 What is supplier lead time?
Supplier lead time is the time between placing a purchase order and receiving goods. CEOs should track it because lead time affects reorder points, safety stock, stockout risk, and purchasing timelines.
24.16 What is dead stock?
Dead stock is inventory that has not sold or moved for a long time. It ties up cash, takes warehouse space, increases carrying cost, and may eventually require markdowns or write-offs.
24.17 What is inventory shrinkage?
Inventory shrinkage is the difference between recorded inventory and actual inventory caused by theft, damage, miscounts, errors, fraud, or process gaps. Since shrinkage reduces margin, it should be reviewed regularly.
24.18 Which inventory KPIs affect cash flow?
The inventory KPIs that affect cash flow most directly are days inventory outstanding, inventory turnover, carrying cost, dead stock percentage, sell-through rate, and inventory-to-sales ratio. These metrics show whether inventory is turning into revenue efficiently.
24.19 Which inventory KPIs affect profitability?
GMROI, carrying cost, shrinkage, markdown rate, dead stock, inventory accuracy, and fulfillment accuracy all affect profitability. These metrics show whether inventory creates margin or consumes it through waste, errors, and slow movement.
24.20 Which inventory KPIs matter for ecommerce?
Ecommerce businesses should track stockout rate, sell-through rate, inventory accuracy, available-to-sell inventory, return rate, fulfillment accuracy, and channel-level stock availability. These KPIs protect conversion, fulfillment, and customer experience.
24.21 Which inventory KPIs matter for wholesale?
Wholesale businesses should track fill rate, allocation accuracy, customer-level availability, EDI order accuracy, backorder rate, supplier lead time, and inventory turnover. These metrics protect account relationships and order reliability.
24.22 Which inventory KPIs matter for manufacturing?
Manufacturers should track raw material availability, BOM accuracy, work order material variance, finished goods availability, inventory accuracy, supplier lead time, and production schedule adherence. These KPIs help protect production flow.
24.23 Can QuickBooks track inventory KPIs?
QuickBooks can support basic inventory and accounting workflows. However, growing inventory-driven businesses often need deeper reporting across purchasing, warehouses, ecommerce channels, manufacturing, fulfillment, and forecasting. At that stage, ERP reporting may be more useful.
24.24 Can spreadsheets track inventory KPIs?
Spreadsheets can track inventory KPIs for small teams. However, they become risky when data comes from Shopify, Amazon, wholesale orders, warehouses, purchasing spreadsheets, accounting tools, and EDI systems. As a result, reporting becomes slower and less reliable.
24.25 How does ERP improve inventory KPI reporting?
ERP improves inventory KPI reporting by connecting transactions across inventory, purchasing, warehouse, accounting, manufacturing, ecommerce, and reporting workflows. Consequently, teams reduce duplicate data entry and make KPI reporting faster.
24.26 When should a business upgrade inventory reporting?
A business should upgrade inventory reporting when reports take too long, teams disagree on inventory numbers, stockouts and overstock happen together, accounting cannot trust valuation, or multi-warehouse growth creates visibility gaps.
24.27 What should be included in an inventory KPI dashboard?
A CEO inventory KPI dashboard should include turnover, DIO, carrying cost, GMROI, stockout rate, fill rate, inventory accuracy, forecast accuracy, supplier lead time, dead stock, shrinkage, and warehouse-level availability.
24.28 What are common inventory KPI mistakes?
Common mistakes include tracking too many metrics, ignoring SKU-level detail, reviewing data too late, trusting manual spreadsheets, separating warehouse data from accounting, and looking at sales growth without inventory efficiency.
24.29 How do inventory KPIs help reduce stockouts?
Inventory KPIs help reduce stockouts by showing where demand exceeds available stock, where forecasts are inaccurate, where suppliers are late, and where reorder points need adjustment. Therefore, teams can act before inventory runs out.
24.30 How do inventory KPIs help reduce overstock?
Inventory KPIs help reduce overstock by exposing slow-moving products, high DIO, weak sell-through, excess safety stock, poor purchasing decisions, and low GMROI. Leaders can then adjust buying, pricing, promotions, or SKU strategy.
25. Turning Inventory KPIs Into Better CEO Decisions
Inventory management KPIs give CEOs a practical way to understand what is happening inside the business. They reveal where cash is trapped, where margin is leaking, where customers are at risk, and where operational systems are no longer supporting scale.
The goal is not to track every possible warehouse metric. Instead, leadership should focus on the inventory KPIs that connect stock movement to cash flow, profitability, fulfillment reliability, forecasting quality, and operational control.
As product businesses scale across Shopify, Amazon, wholesale, EDI, manufacturing, and multiple warehouses, manual reporting becomes harder to trust. Therefore, connected inventory reporting becomes more important. Platforms such as Xorosoft can help inventory-driven teams connect inventory, purchasing, warehouse management, accounting, forecasting, and reporting in one system.
If inventory reporting now affects cash flow, fulfillment, forecasting, purchasing, or month-end close, Book a demo to see what a connected ERP workflow could look like for your business.