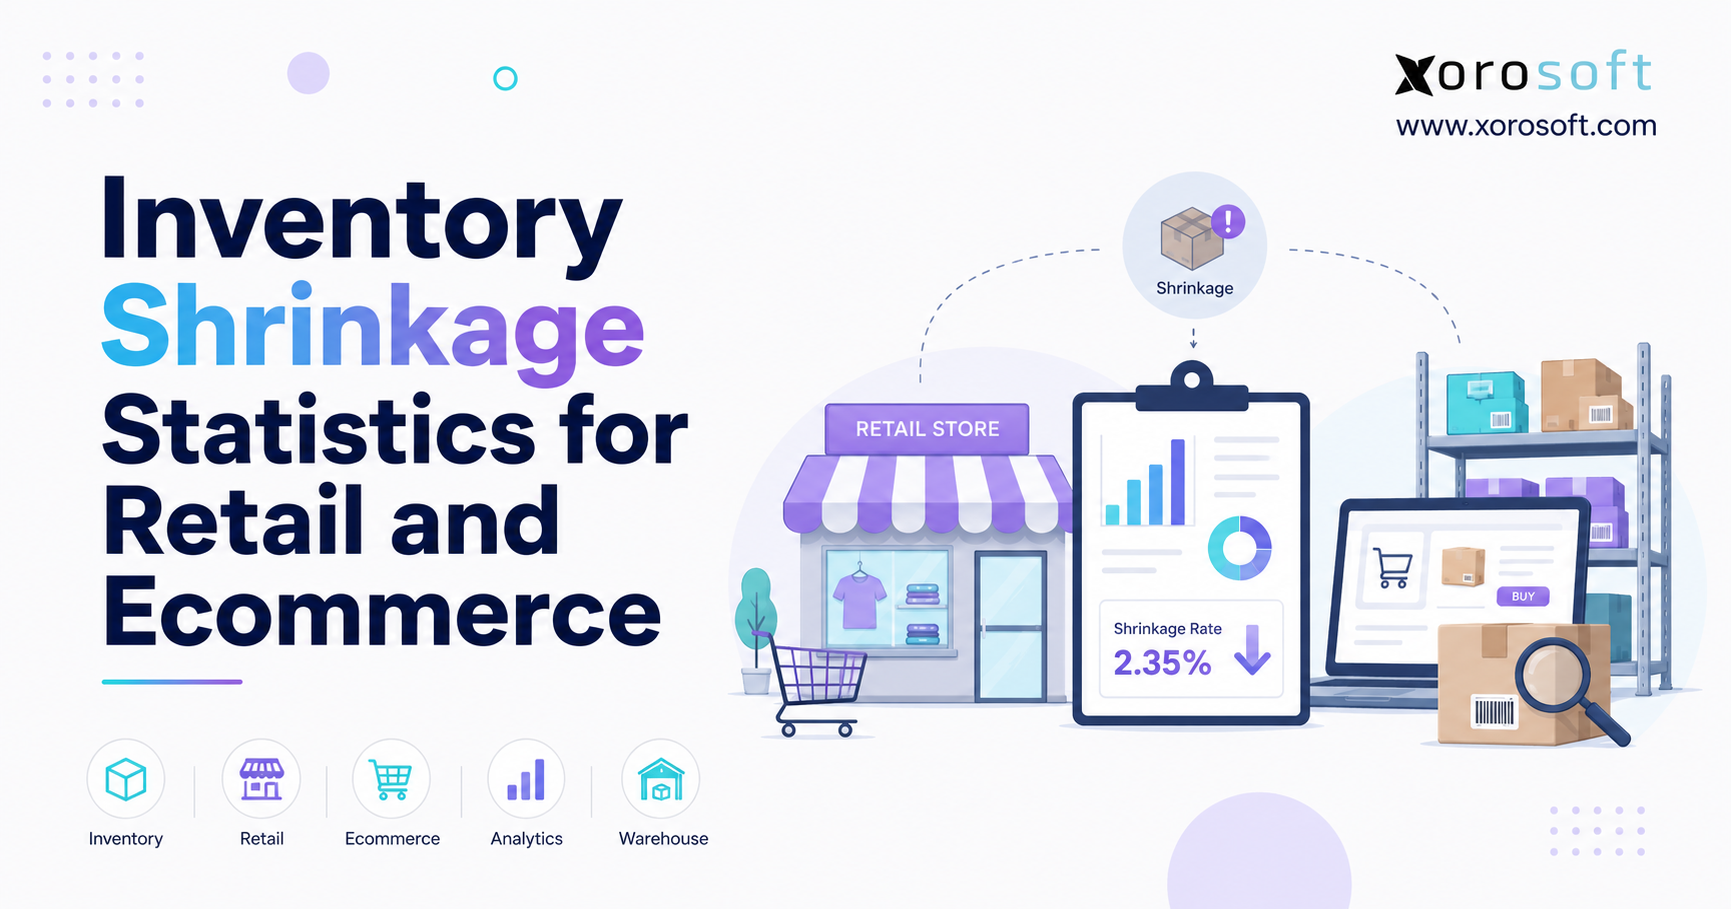
If you are looking for recent inventory shrinkage statistics, you’re in the right place.
1. Inventory Shrinkage Statistics Reveal a Bigger Operational Challenge
1.1 Why Shrink Matters Beyond Loss Prevention
Inventory losses rarely begin as an accounting problem. They usually start somewhere inside day-to-day operations: a short supplier receipt, an incorrect warehouse transfer, a missed scan, an unexplained adjustment, a fraudulent return, damaged merchandise, or stock that employees simply cannot locate when an order arrives.
That is why inventory shrinkage statistics matter well beyond the loss-prevention team. They help retailers and ecommerce businesses measure how reliably inventory moves through purchasing, receiving, warehousing, fulfillment, returns, and accounting.
The National Retail Federation’s 2023 National Retail Security Survey reported an average U.S. retail shrink rate of 1.6% of sales for FY2022, up from 1.4% in FY2021. When NRF applied the FY2022 rate to U.S. retail sales for that year, it estimated $112.1 billion in losses. These figures remain important benchmarks, but they describe FY2022—not 2026.
That distinction matters because articles frequently attach a current year to an older statistic and unintentionally make historical data look current.
1.2 Retail Loss Is Changing, Not Disappearing
Recent research shows a more complicated picture than the traditional narrative of steadily rising shoplifting.
NRF’s July 2026 research found that participating retailers experienced a 12.4% decline in shoplifting incidents and an 8.1% decline in merchandise-theft incidents in 2025 compared with 2024. However, retailers simultaneously reported growth in areas such as phone scams, loyalty fraud, gift-card theft or fraud, repeat offenders, and organized retail crime activity.
Ecommerce creates another layer of inventory risk. NRF projected $849.9 billion in merchandise returns for 2025, estimated that 19.3% of online sales would be returned, and found that 9% of all returns were fraudulent.
Returns do not automatically count as shrink. Yet poor control over returned goods can create inventory discrepancies, incorrect refunds, unusable stock, and accounting adjustments.
The real business question behind inventory shrinkage statistics is therefore not simply, “How much inventory did we lose?” It is, “Can we explain why our physical inventory and our records stopped matching?”
2. Retail Shrinkage Statistics and Inventory Loss Benchmarks
2.1 Key Numbers Retailers Should Put in Context
The most useful retail shrink data always includes a measurement period. Different research programs also measure different parts of the loss environment, so businesses should resist combining every statistic into one trend line.
| Metric | Reported figure | Measurement period |
|---|---|---|
| Average U.S. retail shrink rate | 1.6% of sales | FY2022 |
| Estimated U.S. retail shrink | $112.1 billion | 2022 |
| Previous average shrink rate | 1.4% | FY2021 |
| Internal + external theft share of shrink | Nearly 65% | FY2022 survey |
| Projected total retail returns | $849.9 billion | 2025 |
| Estimated online return rate | 19.3% | 2025 |
| Estimated fraudulent share of returns | 9% | 2025 |
| Change in shoplifting incidents | -12.4% | 2025 vs. 2024 |
| Change in merchandise-theft incidents | -8.1% | 2025 vs. 2024 |
NRF provides the shrink, returns, and recent theft benchmarks above through separate studies. The FY2022 National Retail Security Survey also noted that shrink percentages vary significantly by retail sector.
2.2 How to Read Current Inventory Shrinkage Statistics Correctly
A retailer should distinguish between the latest available broad shrink benchmark and the latest evidence about specific loss trends.
For example, the $112.1 billion estimate remains useful for understanding the scale of retail shrink, but it should appear as a 2022 estimate. The July 2026 NRF research provides more recent insight into shoplifting, merchandise theft, and changing fraud methods, but it does not replace the FY2022 industry-wide shrink percentage with a new equivalent figure.
Using dates this way makes inventory shrinkage statistics more credible for human readers, search engines, and AI-generated answers.
3. Inventory Shrinkage, Inventory Variance, and Stock Accuracy
3.1 What Inventory Shrinkage Actually Measures
Inventory shrinkage occurs when recorded inventory exceeds the amount a business can physically account for.
A normal sale does not create shrink because the sales transaction explains the reduction. The same applies when a company properly records damage, spoilage, samples, production consumption, or another approved write-off.
Shrink appears when inventory disappears without a complete transaction trail.
That definition matters because operators sometimes treat every quantity difference as permanent loss. In practice, teams usually need to investigate a variance before deciding what caused it.
3.2 Inventory Discrepancies Are Not Always Permanent Losses
Imagine that an inventory system shows 250 units while a cycle count finds only 242 in the expected location.
Eight units appear missing, but several explanations remain possible. Workers may have placed them in another bin. A warehouse transfer could have moved without a completed receiving transaction. A picker might have shipped the correct physical quantity against an incorrect system quantity. Returned merchandise may still be awaiting inspection.
At this stage, the business has an inventory discrepancy.
If employees later locate the eight units, no permanent physical loss occurred. If the investigation cannot account for them, the discrepancy may become shrink.
This distinction helps management interpret inventory shrinkage statistics without confusing poor records with confirmed inventory loss.
3.3 Phantom Inventory Can Hurt Sales Before Finance Sees Shrink
Phantom inventory occurs when software reports stock as available even though employees cannot physically locate or sell it.
Suppose an ecommerce system shows ten units while the warehouse can find six. Purchasing delays the next order because the system still reports stock. Customers continue placing orders. Eventually, fulfillment discovers the shortage and cancels or delays orders.
Nothing about that workflow requires a dramatic theft event. A simple receiving, transfer, or adjustment error can create the same customer-facing result.
Inventory accuracy therefore deserves attention alongside financial shrink because inaccurate quantities affect decisions long before the company closes its books.
4. What Causes Retail Inventory Loss?
4.1 Theft Remains Important, but It Is Not the Whole Story
External theft, employee theft, and organized retail crime remain meaningful contributors to shrink.
NRF reported that internal and external theft together represented nearly 65% of shrink among respondents in its FY2022 survey. That makes theft a major component while also confirming that a substantial portion came from other causes.
Recent loss trends reinforce the need for a broader view. In 2025, participating retailers reported fewer shoplifting incidents than in 2024, while many reported increases in phone scams, loyalty fraud, gift-card fraud, cargo theft, and other external-loss tactics.
Companies should therefore analyze inventory shrinkage statistics through multiple loss categories rather than treating shrink as another word for shoplifting.
4.2 Internal Loss Requires Transaction Accountability
Employee-related shrink can involve product theft, fraudulent refunds, manipulated transactions, or inappropriate inventory adjustments.
Strong controls make those events traceable.
If someone changes an inventory balance from 70 units to 63, management should know who made the adjustment, when it happened, where it occurred, why the employee changed the quantity, and what physical event triggered it.
An audit trail does not prevent every loss, but it gives management evidence when an unusual pattern develops.
4.3 Receiving and Warehouse Errors Can Compound
Routine process mistakes can generate serious discrepancies when transaction volume increases.
A warehouse may receive 48 units but enter 50. An employee could record a case of 12 as one unit. A transfer might leave Warehouse A without entering Warehouse B. A picker may remove three units while the transaction reduces stock by two.
Each mistake looks small in isolation. Across thousands of transactions, however, these errors can materially affect stock accuracy and eventually worsen inventory shrinkage statistics.
Receiving deserves particular attention because it establishes how much inventory officially enters the business. Connecting the purchase order, physical receipt, supplier discrepancy, inventory update, and vendor invoice helps teams identify problems before they disappear into later reconciliation work.
5. Ecommerce Inventory Shrinkage and Return Fraud
5.1 Online Returns Add More Inventory States
Returns introduce more complexity because receiving the product back does not automatically make it sellable inventory again.
NRF estimated that 19.3% of online sales would be returned during 2025, compared with an estimated 15.8% return rate across retail overall.
One returned product may arrive unopened and ready for resale. Another may be damaged, incomplete, fraudulent, destined for refurbishment, or suitable only for a vendor return.
Every condition requires a defined inventory disposition.
For an ecommerce operator, inventory shrinkage statistics become much more actionable when the system can separate merchandise that is genuinely missing from merchandise moving through a returns workflow.
5.2 Return Fraud Creates Both Financial and Inventory Risk
NRF’s 2025 returns research estimated that 9% of all returns were fraudulent.
That does not mean 9% of all retail shrink comes from returns fraud. The two metrics measure different things.
It does mean retailers need to connect the original order, returned SKU, quantity received, inspection result, refund, final inventory status, and any fraud exception. When customer service, warehouse, ecommerce, and accounting teams maintain separate records, the reconciliation becomes far more difficult.
5.3 Shopify and Multichannel Inventory Need a Clear Source of Truth
A Shopify merchant may also sell through Amazon, wholesale accounts, marketplaces, and retail stores while holding stock across multiple warehouses.
One SKU can simultaneously include units that are physically on hand, allocated to open orders, in transit, waiting for return inspection, reserved for wholesale customers, or inbound from suppliers.
Merchants evaluating connected operational systems can review the Xorosoft ERP listing on the Shopify App Store. Current listing information and customer reviews describe Shopify-connected workflows involving inventory, orders, payouts, returns, and multichannel operations.
Whatever system a retailer chooses, selling channels should consume a reliable inventory position instead of maintaining competing versions of stock.
6. Calculating Inventory Shrink Rate Correctly
6.1 The Basic Inventory Shrinkage Formula
At the simplest level:
Inventory Shrinkage = Book Inventory − Physical Inventory
If a company’s books show $500,000 of inventory while its physical count confirms $485,000, the inventory difference equals $15,000.
Retail industry benchmarking commonly expresses shrink relative to sales. Under a sales-based method:
Shrink Rate = Inventory Loss ÷ Sales × 100
If a retailer records $10 million in sales and identifies $150,000 of shrink, the resulting shrink rate equals 1.5%.
Before comparing internal performance with published inventory shrinkage statistics, a business should verify that both figures use compatible methodologies.
6.2 What a Small Percentage Looks Like in Dollars
The FY2022 NRF rate of 1.6% demonstrates how quickly a seemingly modest percentage can become material.
Using 1.6% purely as an illustration, a business with $5 million in sales would see $80,000 of shrink. At $25 million, the same percentage represents $400,000. At $50 million, it reaches $800,000. A $100 million operation would be looking at $1.6 million.
Those examples do not predict actual losses. They simply demonstrate why management should translate percentages into dollar exposure.
6.3 What Is an Acceptable Shrink Rate?
No universal rate works for every business.
NRF notes that shrink percentages can vary significantly by retail sector.
Product value, channel mix, return rates, perishability, warehouse complexity, store exposure, manufacturing activity, and measurement methods all influence the number.
A better management question is whether the company’s rate is improving and whether teams can explain the largest drivers behind it.
7. Inventory Accuracy Statistics and Operational Performance
7.1 Cycle Counting Helps Find Problems Earlier
An annual physical inventory can correct the books, but it tells management relatively little about when a discrepancy occurred.
Cycle counting shortens that feedback loop.
Fast-moving products, high-value merchandise, high-return SKUs, historically inaccurate items, and products with frequent adjustments often deserve more attention than slow-moving inventory with stable records.
The objective should go beyond achieving a high count percentage. Teams should study repeated variances and determine which receiving, picking, transfer, returns, or adjustment processes created them.
This makes inventory shrinkage statistics part of an ongoing operating discipline rather than a year-end surprise.
7.2 RFID and Barcode Controls Improve Traceability
Technology can strengthen inventory control when companies pair it with disciplined workflows.
GS1 US explains that RFID can capture product identity as items move through receiving, storage, packing, and shipping without requiring the same line-of-sight scanning process as barcodes. Its warehouse guidance cites item-level inventory accuracy above 95% in implementations it references.
RFID does not fit every operation, and barcode scanning remains effective for many businesses. The important principle is simpler: every meaningful physical movement should create a dependable digital transaction.
7.3 Management Needs More Than One Shrink Metric
A company-wide shrink percentage gives leadership a useful headline, but it rarely explains the problem.
Management should also examine adjustment frequency, adjustment value, receiving variances, cycle-count differences, transfer discrepancies, returns exceptions, negative stock, and inventory accuracy by warehouse or store.
Those supporting metrics help teams understand why the main number changed.
8. How Inventory Loss Affects the Rest of the Business
8.1 Shrink Reduces Margin and Increases Reconciliation Work
Missing inventory represents goods the business purchased or produced but can no longer sell.
Eventually, finance must reconcile physical inventory with financial records. Frequent discrepancies can complicate inventory valuation, cost analysis, gross-margin reporting, and period-end processes.
The hardest part often involves determining what operational event created the difference.
When purchasing, warehouse operations, ecommerce, and accounting maintain disconnected records, finance may spend considerable time reconstructing transactions rather than simply reviewing them.
8.2 Inaccurate Inventory Distorts Purchasing and Forecasting
An overstated quantity tells buyers that they have more inventory than actually exists.
That can delay replenishment and produce stockouts.
Understated inventory creates the opposite problem. Buyers may purchase stock the company already owns, increasing working-capital requirements and storage pressure.
Forecasting can also suffer. If software says an item remained available for two weeks while the warehouse was physically out of stock, historical sales may understate real demand.
These operational effects explain why inventory shrinkage statistics belong in purchasing and planning conversations, not only finance and loss prevention.
8.3 Customers Experience the Downstream Consequences
Customers never see an internal cycle-count variance.
Instead, they see an order cancellation, a late shipment, an unavailable pickup order, or a product that appeared in stock but could not be fulfilled.
In omnichannel retail, reliable inventory has become part of the customer promise. Inventory accuracy affects whether the business can confidently tell a shopper what is available, where it is located, and when it can ship.
9. Inventory Risk Looks Different Across Industries
9.1 Apparel, Furniture, and Sporting Goods
Apparel businesses often manage high SKU counts because each style can include numerous colors and sizes. Seasonal assortments, transfers, ecommerce returns, and frequent promotions add transaction volume.
Furniture companies face different issues: damage, showroom inventory, special orders, large products, and long supplier lead times.
Sporting-goods businesses may combine high-value equipment with footwear, apparel, and smaller accessories.
Because operating models differ, companies should interpret inventory shrinkage statistics against their own product characteristics rather than blindly applying one retail average.
Businesses evaluating ERP requirements by vertical can review Xorosoft’s industry solutions for examples spanning retail, wholesale, manufacturing, and other inventory-driven environments.
9.2 Food and Beverage Require Better Loss Classification
Food businesses need to separate unexplained shrink from expiration, spoilage, production yield, and documented damage.
If employees record expired goods correctly, management has a known loss category. If those products simply disappear from physical inventory and emerge later as a count variance, the business has a control problem.
Clear classification makes the resulting inventory data much more useful.
9.3 Wholesale and Manufacturing Add More Inventory Events
Wholesale distributors frequently handle large receipts, customer allocations, EDI transactions, case quantities, and multiple units of measure.
Manufacturers add raw materials, bills of materials, work orders, work in process, scrap, and finished-goods receipts.
As operational complexity increases, inventory accuracy becomes less about counting products and more about ensuring that every process updates inventory correctly.
10. Practical Ways to Reduce Inventory Shrinkage
10.1 Start With Receiving Controls
The strongest controls begin before merchandise reaches a shelf or warehouse pick face.
Receiving teams should compare physical deliveries with purchase orders and document shortages, overages, damage, substitutions, and rejected goods immediately.
That process prevents an upstream supplier discrepancy from becoming a mysterious variance months later.
A clean connection between purchase order, receipt, inventory, vendor claim, and invoice also gives buyers and finance a shared record of what actually happened.
10.2 Investigate Adjustments Instead of Normalizing Them
Inventory adjustments serve a legitimate purpose, but teams should not use them merely to force system quantities to match the warehouse.
Management should review large and recurring adjustments by employee, warehouse, SKU, reason, and value.
If one product repeatedly requires negative adjustments, the company should investigate the root cause. Theft may be responsible, but so could poor receiving, incorrect units of measure, warehouse scanning, returns, or an integration issue.
Regular adjustment analysis also makes inventory shrinkage statistics far more diagnostic.
10.3 Build a Controlled Returns Workflow
A returned item should remain traceable from the original customer order through inspection, refund, and final inventory disposition.
Sellable merchandise should re-enter available inventory correctly. Damaged stock needs another status. Fraudulent or missing merchandise needs an exception record.
Given the scale of online returns and the fraud findings in NRF’s 2025 study, retailers should treat reverse logistics as part of inventory control rather than only customer service.
10.4 Count Inventory According to Risk
Companies do not need to count every SKU at the same frequency.
High-value merchandise, fast movers, historically inaccurate items, high-return products, and stock in problem locations deserve more frequent review.
Risk-based cycle counting concentrates warehouse labor where errors create the greatest financial or customer impact.
11. Inventory Management Software and Warehouse Controls
11.1 A WMS Creates Better Transaction History
A warehouse management system should provide more than a current on-hand balance.
Operators need visibility into receiving, putaway, bin movements, picking, packing, transfers, returns, and cycle counts. When a count reveals a discrepancy, that transaction history helps the team reconstruct what happened.
Xorosoft’s XoroWMS supports warehouse functions including real-time inventory tracking, barcode scanning, cycle counting, multi-warehouse management, picking, receiving, and fulfillment.
For companies where warehouse execution drives a significant portion of their inventory shrinkage statistics, better movement-level control can reveal problems that a simple inventory balance cannot.
11.2 Connected Inventory Helps Departments Work From the Same Record
Growing companies frequently build an operating stack incrementally.
They may start with Shopify and accounting software, then add an inventory application, warehouse tool, EDI connection, spreadsheets, and separate reporting.
Each application may solve a real problem. The difficulty appears when several systems begin maintaining related versions of inventory data.
XoroONE brings inventory, purchasing, warehouse management, manufacturing, accounting, ecommerce, forecasting, and reporting functions into a connected cloud ERP environment.
The broader lesson is not that every retailer needs one particular platform. It is that inventory-driven businesses eventually need clear ownership of inventory data.
11.3 ERP Becomes Relevant When Inventory Problems Cross Departments
Inventory problems become ERP problems when warehouse teams cannot solve them without involving purchasing, accounting, manufacturing, ecommerce, or wholesale operations.
A purchase order affects receiving and accounts payable. A return affects customer service, inventory, refunds, and accounting. A production order consumes components and creates finished goods.
XoroERP supports connected ERP workflows across inventory-driven manufacturing and operational environments, including inventory, purchasing, warehousing, production, and accounting.
That type of integration can help businesses investigate the operational events sitting behind their inventory shrinkage statistics.
12. When Businesses Should Upgrade Their Inventory Systems
12.1 Signs Spreadsheets and Standalone Apps Are Becoming a Constraint
A spreadsheet can work perfectly well for a small, straightforward operation.
Problems usually emerge when several people maintain different inventory files, buyers depend on manual calculations, warehouses struggle to track transfers, ecommerce channels frequently disagree about stock, or finance spends significant time reconciling inventory.
At that point, the question is no longer whether spreadsheets can technically hold the information. The question is whether the business can control transactions reliably as volume and complexity grow.
12.2 Inventory Software vs ERP
A standalone inventory system remains appropriate when inventory is the primary operational requirement.
ERP makes more sense when the same transaction must flow through several functions.
| Requirement | Inventory software | ERP |
| Inventory tracking | Core strength | Core strength |
| Cycle counting | Common | Common |
| Purchasing | Varies | Usually integrated |
| Accounting | Often separate | Integrated |
| Warehousing | Varies | Often connected |
| Manufacturing | Often limited | Available in manufacturing-focused ERP |
| Financial reconciliation | Integration dependent | Broader operational context |
| Cross-functional reporting | More focused | Typically broader |
Neither category automatically wins. The correct choice depends on the business model and the number of processes that depend on the same inventory record.
12.3 Evaluate ERP Platforms Against Real Workflows
Businesses reaching this stage often compare several ERP platforms.
Teams considering larger systems can use the Xorosoft vs. NetSuite comparison as one reference point, then test both platforms against actual warehouse, accounting, purchasing, ecommerce, manufacturing, reporting, and implementation requirements.
A feature checklist alone cannot show how easily a user can investigate a short receipt, trace an adjustment, reconcile a return, or determine why inventory shrinkage statistics changed.
13. Inventory Shrinkage Statistics FAQs
13.1 What is inventory shrinkage?
Inventory shrinkage occurs when a business’s recorded inventory exceeds what employees can physically account for. Common causes include theft, employee fraud, receiving mistakes, warehouse errors, supplier discrepancies, damage, and unrecorded stock movements. Teams should investigate discrepancies before automatically treating every variance as permanent loss.
13.2 What are inventory shrinkage statistics?
Inventory shrinkage statistics measure the rate, financial value, causes, or operational patterns associated with missing inventory. Common examples include shrink as a percentage of sales, total estimated industry losses, theft-related data, inventory accuracy measures, adjustment rates, and warehouse or returns discrepancies.
13.3 What is the average retail shrink rate?
NRF reported an average U.S. retail shrink rate of 1.6% of sales for FY2022, compared with 1.4% in FY2021. Retailers should treat the figure as a broad industry benchmark rather than a universal target because shrink varies substantially by sector.
13.4 How much does retail shrink cost?
NRF estimated that the FY2022 shrink rate represented $112.1 billion in losses during 2022. Publishers and businesses should label the figure as 2022 data rather than describing it as the amount retailers lose annually in 2026.
13.5 What causes inventory shrinkage?
Major causes include external theft, employee theft, fraudulent activity, receiving errors, supplier discrepancies, warehouse mistakes, damaged merchandise, administrative errors, and stock movements that employees fail to record correctly. Different causes require different controls, which makes root-cause analysis critical.
13.6 Is all retail shrink caused by theft?
No. NRF reported that internal and external theft together represented nearly 65% of shrink among respondents in its FY2022 study. That makes theft important but also leaves a substantial portion associated with other causes and operational issues.
13.7 Is shoplifting increasing or decreasing?
The answer depends on the period examined. NRF’s July 2026 study found that participating retailers experienced a 12.4% decline in shoplifting incidents in 2025 compared with 2024. At the same time, several other external fraud and theft categories increased.
13.8 What is ecommerce inventory shrinkage?
Ecommerce inventory shrinkage describes merchandise that becomes lost or unaccounted for within online retail operations. Causes can include warehouse errors, internal loss, fraudulent returns, shipping discrepancies, damaged returns, and synchronization problems between ecommerce channels and inventory systems.
13.9 How many online purchases are returned?
NRF estimated that 19.3% of online sales would be returned in 2025. That was higher than the estimated overall retail return rate of 15.8%, highlighting the operational importance of reverse logistics for ecommerce companies.
13.10 How common is return fraud?
NRF’s 2025 Retail Returns Landscape estimated that 9% of all returns were fraudulent. Return fraud does not equal inventory shrink on a one-to-one basis, but it can create financial losses and inventory discrepancies when companies cannot connect refunds with physical merchandise.
13.11 How do you calculate inventory shrinkage?
First subtract physical inventory from book inventory to calculate the difference. When using a sales-based retail shrink rate, divide the inventory loss by sales for the same period and multiply by 100. Use a consistent methodology whenever you compare performance across periods.
13.12 What is a good inventory shrink rate?
No universal rate applies to every company. Product type, industry, returns, store exposure, warehouse complexity, sales channels, and measurement methods all influence shrink. Businesses should compare appropriate external benchmarks with their own historical results and investigate major changes.
13.13 What is the difference between shrink and inventory variance?
Inventory variance describes any difference between expected and actual inventory. Employees may eventually resolve a variance by locating stock or correcting a transaction. Shrink generally refers to inventory that the company ultimately cannot account for after investigation.
13.14 What is phantom inventory?
Phantom inventory exists when a system says stock is available even though employees cannot physically find or fulfill it. The discrepancy can cause overselling, delayed purchasing, cancellations, inaccurate forecasts, and poor customer experiences.
13.15 How does inventory shrinkage affect accounting?
Shrink reduces the inventory value a business can support physically and forces finance teams to reconcile book quantities with actual stock. Frequent unexplained differences can complicate inventory valuation, gross-margin analysis, period-end adjustments, and financial reporting.
13.16 How do inventory discrepancies affect forecasting?
If a system reports products as available while the warehouse has actually stocked out, recorded sales may understate real demand. Forecasting models can then interpret the lower sales as weaker customer demand and recommend insufficient replenishment.
13.17 Can cycle counting reduce inventory shrinkage?
Cycle counting helps teams identify discrepancies much sooner than an annual physical inventory. It cannot prevent every loss, but shorter detection periods make it easier to determine whether receiving, transfers, warehouse movements, returns, theft, or adjustments caused the difference.
13.18 How often should inventory be cycle counted?
Count frequency should reflect risk. Fast-moving products, expensive items, high-return SKUs, historically inaccurate products, and stock stored in problem locations often require more frequent counts. Stable, slow-moving merchandise may need less frequent verification.
13.19 Can RFID improve inventory accuracy?
RFID can improve data capture and visibility in suitable environments. GS1 US reports item-level inventory accuracy above 95% in warehouse and retail implementations it references. Results vary according to tagging, process design, product characteristics, infrastructure, and implementation quality.
13.20 Can warehouse management software reduce inventory loss?
A WMS can strengthen controls around receiving, putaway, movement, picking, packing, transfers, returns, and counting. Software cannot eliminate every theft or mistake, but detailed transaction records make discrepancies easier to detect and investigate.
13.21 Can ERP reduce inventory shrinkage?
ERP cannot prevent every loss event. Its value comes from connecting inventory with purchasing, warehousing, manufacturing, sales channels, and accounting. That connection can improve auditability, reduce duplicate data entry, and help teams identify the process behind a discrepancy.
13.22 When should a business move beyond spreadsheets?
A company should consider dedicated inventory software when several employees maintain competing files, quantities frequently disagree, buyers rely on manual calculations, warehouse transfers become difficult to trace, or ecommerce channels repeatedly oversell inventory.
13.23 When should a company consider ERP?
ERP becomes relevant when inventory issues also involve accounting, purchasing, warehouse management, manufacturing, forecasting, EDI, wholesale, or multiple ecommerce channels. Repeated manual reconciliation between several systems often provides a stronger signal than company size alone.
13.24 How can Shopify merchants improve inventory accuracy?
Shopify merchants should define one inventory source of truth, distinguish on-hand stock from available-to-sell inventory, control warehouse movements, process returns through clear statuses, cycle count high-risk products, and prevent separate applications from maintaining conflicting quantities.
13.25 Which metrics should management track alongside shrink?
Useful measures include inventory accuracy, cycle-count variance, adjustment frequency, adjustment value, receiving discrepancies, transfer variances, return exceptions, negative inventory, shrink by location, and high-risk SKUs. Together, these metrics make inventory shrinkage statistics much easier to diagnose and act on.
14. From Inventory Shrinkage Data to Stronger Inventory Control
14.1 Use the Benchmark to Find the Operational Cause
Industry benchmarks provide context, but retailers should not manage inventory loss by chasing one percentage.
NRF’s FY2022 benchmark of 1.6% of sales and $112.1 billion in estimated losses demonstrates the financial scale of shrink. More recent NRF research shows that the risk environment keeps changing: participating retailers reported lower shoplifting and merchandise-theft incidents in 2025, even as other fraud and external-loss methods continued to grow. Ecommerce businesses must also manage high return volumes and the inventory complexity that comes with reverse logistics.
Strong operators use inventory shrinkage statistics as the starting point for investigation, not the final answer.
They determine which warehouses, stores, SKUs, suppliers, transaction types, and processes create discrepancies. They examine receiving, transfers, adjustments, returns, fulfillment, and manufacturing consumption. Most importantly, they fix recurring causes instead of repeatedly correcting the inventory balance.
14.2 Know When Better Processes Need Better Systems
A straightforward operation may solve most inventory problems with stronger receiving controls, disciplined scanning, risk-based cycle counting, and focused inventory software.
The requirements change as the business adds multiple warehouses, Shopify, Amazon, wholesale customers, EDI, manufacturing, more complex purchasing, and integrated accounting. At that stage, every department depends on the same inventory data, and disconnected applications can turn each discrepancy into a reconciliation project.
Xorosoft offers ERP and warehouse-management platforms for inventory-driven businesses at different levels of operational complexity. The purpose is not to use software as a substitute for good processes. A connected system should make those processes easier to control, measure, and investigate.
The objective is simple: management should understand why inventory adjustments happen, reduce preventable losses, and trust the quantities that purchasing, warehouse teams, ecommerce channels, customer service, and finance use every day.
If recurring inventory discrepancies, multichannel stock problems, or slow reconciliation are making that difficult, contact Xorosoft to discuss how your current inventory workflows could operate with stronger visibility and control.
Recent Posts
-
 Best AI Warehouse Management Software for ERP Inventory and Warehouse Operations
 -
 Project Based ERP Software for Managing Project Costs, Purchasing, Resources, Inventory, and Accounting
 -
 Food and Beverage ERP Requirements for Lot, Expiry, and Recall Control
 -
 How to Prevent EDI Errors Before They Become Retailer Chargebacks
 -
 Warehouse Injury and Safety Statistics: What Operations Teams Should Know Before Automating Workflows