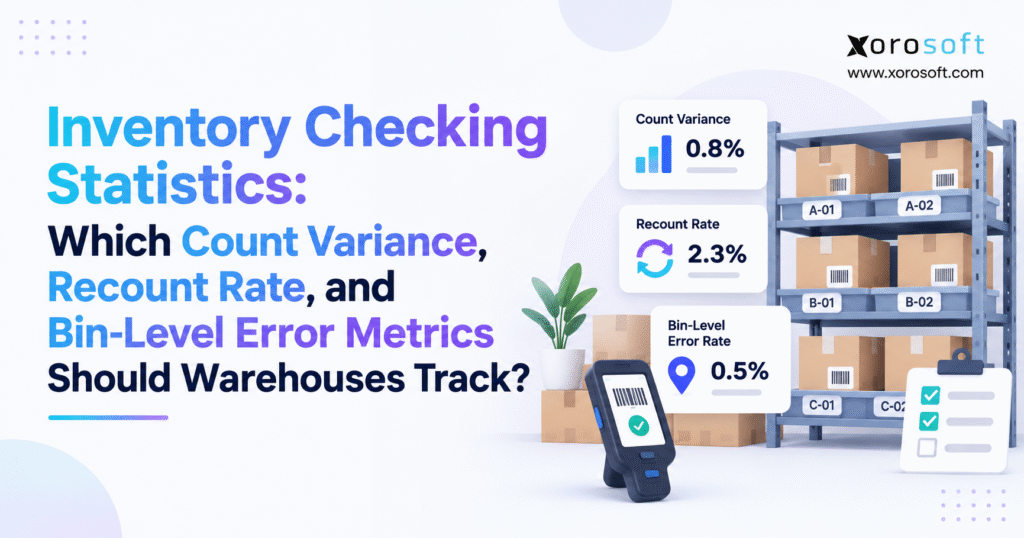
When planning your warehouse operations, it’s important to consider inventory checking statistics.
1. Why Warehouse Inventory Can Look Accurate and Still Be Wrong
Inventory records can look healthy while warehouse operations tell a very different story.
A system may show 100 units available, but a picker reaches the assigned bin and finds only 86. Another SKU may have the correct total quantity across the warehouse while the stock is distributed across the wrong locations. Elsewhere, employees may need two or three recounts before anyone trusts the physical quantity.
Those are different operational problems, so one inventory accuracy percentage cannot explain them all.
Useful inventory checking statistics should reveal whether inventory records match physical stock, whether the first physical count can be trusted, whether discrepancies keep returning, and whether inventory sits in the locations where the system expects it.
Most inventory errors do not begin during a cycle count. They usually start earlier in receiving, putaway, replenishment, picking, transfers, returns, manufacturing consumption, or unit-of-measure handling.
The cycle count simply exposes the gap.
For that reason, mature warehouse teams treat inventory checking as more than an adjustment exercise. The goal is to identify where errors occur, understand why they happen, and measure whether corrective action is improving the underlying process.
That requires a combination of inventory record accuracy, count variance, recount rate, bin-level accuracy, repeat variance, adjustment value, and resolution time.
When those measures are reviewed together, inventory checking becomes a diagnostic control system rather than a periodic counting task.
2. What Inventory Checking Statistics Should Actually Measure
2.1 Inventory accuracy and inventory checking performance are different
Inventory accuracy answers a straightforward question: does the system record match the physical inventory?
Inventory checking performance asks something different: can the business trust the process being used to verify that record?
Imagine an employee performs a count and reports a five-unit shortage. The shortage may be genuine. However, the employee could also have counted the wrong unit of measure, missed stock in a neighboring bin, scanned the wrong item, or performed the count while inventory was still moving.
One metric evaluates the inventory record. The other evaluates the reliability of the verification process.
Both matter.
2.2 Inventory accuracy metrics need several levels of detail
Warehouse teams should avoid reducing inventory accuracy to a single percentage displayed on a dashboard.
A useful measurement structure operates at several levels.
Company-wide reporting helps management understand overall inventory reliability. Warehouse-level analysis makes it possible to compare facilities, while SKU-level reporting identifies products that repeatedly fail counts. Bin-level measurement then confirms whether stock is physically stored where the system says it should be.
The same data can also be segmented by product category, velocity, value, lot, serial number, shift, zone, or transaction type.
This creates a more useful question than “What is our inventory accuracy?”
The better question is: where is inventory accuracy breaking down, and what process is causing it?
3. Inventory Accuracy Metrics That Establish the Baseline
3.1 Inventory record accuracy
Inventory record accuracy measures how many verified records match physical inventory within the company’s defined tolerance.
The basic formula is:
Inventory Record Accuracy = Correct Records ÷ Records Checked × 100
If a warehouse checks 2,000 SKU-location records and 1,960 match, inventory record accuracy is 98%.
That percentage only becomes useful when “correct” has a consistent definition.
Some operations require an exact unit match. Others permit a limited quantity or value tolerance for particular product groups. High-value, regulated, serialized, or production-critical items may require exact accuracy even where lower-risk products use reasonable tolerance bands.
3.2 Why inventory accuracy should never stand alone
A 98% result sounds strong until the remaining 2% is examined.
If the inaccurate records involve inexpensive, slow-moving items, the operational impact may be limited. When those errors involve fast movers, expensive components, constrained inventory, or products already promised to customers, the same percentage can create significant disruption.
That is why inventory checking statistics should combine record accuracy with variance magnitude, financial value, bin accuracy, and repeat-error behavior.
The percentage tells management that discrepancies exist. Supporting metrics reveal whether those discrepancies matter operationally and financially.
3.3 Accuracy should reflect the record being tested
Companies should also define what an “inventory record” means.
For a simple warehouse, that may be SKU plus quantity. In a more controlled environment, the record may also include warehouse, bin, lot, serial number, status, expiry date, or ownership.
A count can therefore be quantity-correct but still operationally wrong.
For example, 20 units may exist physically, yet ten could be recorded in the wrong lot or location. A headline quantity metric would miss that distinction.
4. Inventory Count Variance Shows How Far Physical Stock Differs From the Record
4.1 Inventory count variance formula
Count variance measures the numerical difference between system quantity and physical quantity.
Count Variance = Physical Quantity − System Quantity
If the system shows 250 units and the physical count finds 241, the variance is:
241 − 250 = −9 units
If the warehouse instead finds 256 units, the variance becomes:
256 − 250 = +6 units
Negative variance indicates less physical stock than expected. Positive variance shows more stock than expected.
Neither should automatically be treated as a simple warehouse loss or gain because the discrepancy still needs investigation.
4.2 Absolute inventory variance rate
Directional variance is useful during investigation, but overall inventory accuracy reporting should also use absolute differences.
Absolute Variance Rate = |Physical Quantity − System Quantity| ÷ System Quantity × 100
Suppose one SKU is short by 10 units and another is over by 10 units. Net variance is zero, yet the warehouse still has 20 units recorded incorrectly.
Absolute variance prevents those discrepancies from cancelling each other in management reporting.
4.3 Inventory checking statistics should include variance value
Quantity alone does not show financial exposure.
A 25-unit discrepancy involving a $3 accessory equals $75. By contrast, a one-unit discrepancy involving a $5,000 product equals $5,000.
A practical calculation is:
Variance Value = Quantity Difference × Inventory Cost
Warehouse and finance teams should therefore review unit variance and dollar variance together.
This becomes especially important when determining which discrepancies need immediate investigation, supervisory approval, or independent recount.
4.4 Separate gross variance from net variance
Net inventory variance can be useful for accounting, but it is not sufficient for operational analysis.
Consider a warehouse with a $15,000 shortage in one product family and a $13,000 overage elsewhere. The net variance is only $2,000.
Operationally, however, $28,000 of inventory records were wrong.
Gross absolute variance better reflects the amount of inventory requiring investigation.
5. Recount Rate Shows Whether the First Physical Count Can Be Trusted
5.1 What recount rate means
Recount rate measures how frequently an initial physical count needs another verification.
Because warehouse systems may define recount workflows differently, the company should document exactly what qualifies as a recount.
A practical formula is:
Recount Rate = Count Lines Requiring Recount ÷ Initial Count Lines Completed × 100
If 60 out of 2,000 initial count lines require verification, the recount rate is 3%.
5.2 Why recount rate belongs in inventory checking statistics
A discrepancy and a recount are not the same thing.
Some warehouses may have genuine inventory discrepancies while still maintaining a disciplined, repeatable counting process. In other facilities, overall inventory may be relatively accurate, yet employees perform excessive recounts because of unclear labels, mixed items, difficult storage conditions, or inconsistent procedures.
For that reason, a rising recount rate should trigger investigation into both inventory data and counting execution.
Potential causes include poorly labeled bins, case-to-each confusion, inventory moving during counting, multiple SKUs stored together, inconsistent scanner workflows, or insufficient counter training.
5.3 Recount confirmation rate provides deeper insight
Once a recount occurs, warehouse managers should measure whether the second count confirms the original result.
Recount Confirmation Rate = Recounts Confirming Initial Count ÷ Total Recounts × 100
Suppose 40 counts are repeated and 34 produce the same physical result.
The confirmation rate is 85%.
That suggests most initial discrepancies were probably genuine record problems rather than first-count mistakes.
5.4 Recount disagreement rate exposes counting-process issues
The opposite measure is also useful.
Recount Disagreement Rate = Recounts Producing a Different Result ÷ Total Recounts × 100
If a large percentage of recounts produce different results, the warehouse may need to review labels, storage practices, counter training, blind-count procedures, unit-of-measure rules, or scanner execution.
A warehouse with inaccurate records has one type of problem. A warehouse that cannot repeat the same physical count has another.
6. Bin-Level Inventory Accuracy Exposes Errors Hidden by Total SKU Quantity
6.1 Correct totals can still produce incorrect warehouse inventory
A warehouse can have perfect total quantity and poor location accuracy at the same time.
Consider this example:
| Location | System Quantity | Physical Quantity |
|---|---|---|
| Bin A | 30 | 20 |
| Bin B | 20 | 30 |
| Total | 50 | 50 |
At the SKU level, inventory appears perfect.
At the bin level, both locations are inaccurate.
The operational impact becomes clear when a picker goes to Bin A expecting 30 units and finds only 20.
6.2 Bin accuracy formula
A useful calculation is:
Bin Accuracy = Correct SKU-Bin Records ÷ SKU-Bin Records Checked × 100
If 970 of 1,000 SKU-bin records are correct, bin accuracy is 97%.
The remaining 3% matters because location errors can create pick-face stockouts even when the product exists elsewhere in the facility.
6.3 Bin-level error rate
The inverse calculation is:
Bin-Level Error Rate = Incorrect SKU-Bin Records ÷ SKU-Bin Records Checked × 100
This metric is especially useful when comparing zones or warehouses.
If one area has a 1% bin error rate and another reports 7%, managers immediately know where deeper investigation is needed.
That makes location-level accuracy one of the most actionable inventory checking statistics for warehouses relying on directed picking and replenishment.
6.4 Bin accuracy should include more than quantity when necessary
Some operations need to verify more than SKU and units.
A bin record may also need the correct lot, serial number, inventory status, expiry date, or handling designation.
For example, sellable inventory stored physically in a quarantine location should not be treated as fully accurate simply because the quantity matches.
Operational context matters.
7. Wrong-Location and Phantom Inventory Metrics Reveal Operational Risk
7.1 Wrong-location inventory
Wrong-location inventory exists physically but sits somewhere other than the location recorded in the system.
A useful calculation is:
Wrong-Location Rate = Units Found Outside Expected Location ÷ Units Checked × 100
This metric is particularly helpful in high-volume warehouses where stock moves frequently between receiving, reserve storage, pick faces, staging, returns, and shipping areas.
7.2 Phantom inventory creates false availability
Phantom inventory occurs when the system says stock exists but warehouse staff cannot find it.
The operational impact can include false ecommerce availability, failed allocations, partial shipments, wasted search time, unnecessary purchasing, delayed production, and customer-service escalations.
A warehouse may technically report strong inventory accuracy overall while a small number of phantom-stock records create disproportionate service problems.
7.3 Unrecorded inventory creates the opposite problem
Physical stock may exist even though the system reports zero or a smaller quantity.
Until the discrepancy is resolved, that inventory cannot be confidently allocated, replenished, purchased, or valued.
The business effectively owns inventory that its operating system cannot fully use.
7.4 Track both quantity and affected orders
Quantity-based measurements are useful, but operations may also track how often phantom stock affects customer orders or production requirements.
A three-unit discrepancy may be relatively minor in percentage terms yet critical if those three units are the only stock promised to priority customers.
8. Repeat Inventory Variance Reveals Persistent Process Failures
8.1 Repeat variance matters more than an isolated error
A single discrepancy may result from an isolated mistake.
The same discrepancy appearing repeatedly is different.
A practical formula is:
Repeat Variance Rate = Records With Repeated Discrepancies ÷ Previously Flagged Records Checked Again × 100
Repeated failures suggest that the adjustment corrected the quantity without fixing the process that created the error.
8.2 Inventory checking statistics should expose recurring patterns
Warehouse teams should analyze repeat variance by SKU, bin, product family, warehouse, zone, transaction type, shift, and reason code.
If one SKU repeatedly develops shortages, the issue may involve packaging or unit-of-measure interpretation.
When one bin repeatedly fails, replenishment or neighboring pick locations may be responsible.
If a particular warehouse performs materially worse than other facilities, training, layout, transaction discipline, or configuration may be contributing.
8.3 Error concentration helps prioritize improvement work
A useful approach is to rank recurring discrepancies from highest to lowest.
Often, a relatively small group of products, locations, or process steps accounts for a large share of inventory problems.
That concentration is more actionable than a company-wide average because it tells managers where corrective effort is most likely to produce a measurable improvement.
8.4 Repeat variance should trigger root-cause review
When the same inventory record fails repeatedly, increasing count frequency may only increase labor.
The right question is not how often the item should be counted.
Instead, operations should determine which transaction continues making the record inaccurate.
9. Inventory Adjustment Metrics Show How Often Records Need Correction
9.1 Inventory adjustment rate
An adjustment should normally occur only after a warehouse confirms the inventory record is wrong.
A simple measure is:
Inventory Adjustment Rate = Records Adjusted ÷ Records Counted × 100
A rising adjustment rate deserves attention because adjustments are corrections rather than normal inventory flow.
When teams repeatedly fix quantities after the fact, an upstream process may not be recording physical activity correctly.
9.2 Track positive and negative adjustment value separately
Warehouse and finance teams should review positive adjustments, negative adjustments, net adjustment value, and gross absolute adjustment value.
Net adjustment can create a misleading impression.
A $20,000 shortage and a $19,000 overage create only a $1,000 net difference. Operationally, however, $39,000 of inventory records required correction.
9.3 Adjustment reason codes improve inventory accuracy metrics
Every meaningful adjustment should have an analyzable reason.
Typical categories include receiving, putaway, picking, transfer, returns, damage, shrinkage, manufacturing, unit-of-measure error, wrong location, and unknown.
The “unknown” category deserves particular attention.
If a large share of adjustments remains unexplained, the warehouse is repairing numbers without learning why the errors occurred.
9.4 Adjustment approval thresholds should reflect risk
Not every discrepancy requires the same approval process.
A low-value variance may be resolved by warehouse supervision, while a large financial discrepancy or serialized-item difference may need finance or operations leadership.
Tolerance rules should therefore consider quantity, percentage, financial value, item class, and operational risk.
10. Cycle Count Metrics Should Measure Execution as Well as Accuracy
10.1 Cycle count completion rate
Accuracy percentages become misleading when scheduled counts are not actually completed.
Count Completion Rate = Completed Scheduled Counts ÷ Scheduled Counts × 100
A warehouse reporting 99% count accuracy while completing only 60% of its scheduled counts does not have the same control level as a warehouse completing its full cycle-count program.
10.2 Track overdue inventory counts
Count status should distinguish work that is completed on time, completed late, still open, or cancelled.
A growing backlog means inventory is not being verified according to the intended risk schedule.
This becomes particularly important for ABC programs where high-value or historically inaccurate items are supposed to receive more frequent attention.
10.3 Count duration should be interpreted carefully
Warehouses may track minutes per SKU, count line, bin, or zone.
However, speed should not become the only performance target.
Employees under excessive time pressure may rush counts, skip secondary locations, or rely on expected quantities rather than verifying the physical stock carefully.
10.4 Variance resolution time
The warehouse should also measure how long discrepancies remain unresolved.
Average Variance Resolution Time = Total Time From Detection to Resolution ÷ Resolved Variances
Unresolved differences can continue affecting available-to-promise inventory, purchasing, allocation, replenishment, production planning, and accounting.
11. Inventory Checking Statistics Should Be Segmented by Warehouse and Risk
11.1 Measure inventory accuracy by facility
Multi-warehouse companies should never rely only on an enterprise average.
Consider a business with three facilities:
Warehouse A: 99.4%
Warehouse B: 98.9%
Warehouse C: 92.7%
Although the blended percentage may still look acceptable, the third facility clearly requires investigation.
Recount rate, repeat variance, adjustment value, and bin accuracy should be analyzed the same way. Facility-level reporting prevents strong performance in one warehouse from hiding control problems in another.
11.2 Segment inventory by ABC classification
High-value, critical, or strategically important products usually deserve more frequent verification.
A-class inventory may receive frequent counts, B items can follow a moderate schedule, and C inventory may be checked less often.
ABC classification is a starting point rather than a complete control strategy.
11.3 Add transaction velocity and discrepancy history
Fast-moving inventory creates more opportunities for receiving, replenishment, picking, and transfer errors.
Historically inaccurate products also deserve more attention regardless of their financial classification.
Combining value, velocity, and past discrepancies produces a more useful counting schedule than value alone.
11.4 Segment by warehouse area
Different warehouse areas create different risks.
Receiving, reserve storage, pick faces, returns, staging, production, quarantine, and shipping should not automatically be treated as one population.
Segmented inventory checking statistics can expose whether errors begin before stock reaches storage or later during fulfillment.
12. Receiving, Putaway, Picking, and Transfers Are Common Sources of Inventory Variance
12.1 Receiving creates the first inventory record
When receiving is incorrect, every later warehouse process begins with bad information.
Common examples include receiving the wrong quantity, selecting the wrong SKU, recording cases as individual units, missing supplier shortages, or accepting damaged inventory as fully available stock.
Strong receiving controls reduce the number of discrepancies that must be discovered later through cycle counts.
12.2 Putaway creates location accuracy
A product may physically move to Bin B while the system still shows Bin A.
Total quantity remains correct, but bin accuracy immediately fails.
Warehouses that depend on paper instructions, memory, or delayed transaction confirmation are particularly exposed to this problem.
12.3 Picking changes inventory constantly
Picking can create discrepancies through overpicks, short picks, wrong-SKU picks, substitutions, wrong-lot picks, or inventory removed from neighboring locations.
High transaction volume increases the number of opportunities for those errors.
For that reason, fast-moving pick faces frequently deserve more cycle-count attention than slow reserve locations.
12.4 Transfers add timing risk
Inventory moving between bins or warehouses becomes difficult to reconcile when the system transaction and physical movement happen at different times.
Clear rules should determine when stock leaves the source location, when it becomes in transit, and when it becomes available at the destination.
13. Returns, Unit-of-Measure Rules, and Manufacturing Need Separate Accuracy Controls
13.1 Returns can create hidden inventory problems
Returned inventory may be sellable, damaged, quarantined, repairable, refurbished, or scrap.
If a warehouse physically receives a return but records the wrong disposition, available inventory becomes inaccurate even when the quantity itself is correct.
Returns therefore require both quantity and status accuracy.
13.2 Unit-of-measure errors can create large variances
Businesses selling eaches, inner packs, cases, or pallets need consistent conversion rules.
An employee counting three cases as three individual units can create a major discrepancy even though every physical product is present.
Receiving, picking, replenishment, and sales-order logic should all use the same conversion rules.
13.3 Manufacturing adds component and WIP complexity
Manufacturers should extend inventory checking statistics beyond finished goods.
Useful areas include raw materials, work-in-process, production staging, component consumption, scrap, yield differences, and finished-goods completion.
Inventory accuracy can deteriorate when materials are physically consumed but not recorded, or when the system consumes components before production activity actually occurs.
13.4 Inventory requirements differ by industry
Apparel businesses may prioritize size-color-style accuracy. Food companies may focus on lot, expiry, and status. Furniture operations often need large-item location control, while industrial distributors may emphasize UOM and bin accuracy.
Businesses comparing operational requirements across sectors can review Xorosoft’s inventory-driven industries for additional context.
14. Inventory Accuracy Benchmarks Should Reflect Operational Risk
14.1 A universal inventory accuracy target can be misleading
Companies often search for one “good” inventory accuracy percentage.
That number may be useful as a reference, but no single target is appropriate for every operation.
Suitable performance depends on product value, transaction frequency, SKU complexity, lot or serial tracking, warehouse design, customer expectations, and the tolerance used to define accuracy.
14.2 Build an internal inventory checking baseline first
Warehouses should establish consistent definitions and measure current performance before setting improvement targets.
The starting baseline should include inventory record accuracy, absolute count variance, recount rate, bin accuracy, repeat variance, adjustment value, count completion, and resolution time.
Improvement can then be measured against the same definitions month after month.
14.3 Prioritize higher-risk inventory
The strictest controls should usually apply where an error has the largest business impact.
High-value items, regulated inventory, fast movers, limited stock, production-critical components, serialized goods, and products with frequent historical discrepancies all deserve additional attention.
14.4 Trend direction matters as much as a single result
A warehouse moving from 93% to 97% accuracy may be improving rapidly.
Another facility sitting at 98% for months while recount rate and adjustment value continue rising may have hidden problems.
For this reason, management should review trends across several related warehouse accuracy KPIs rather than chasing one isolated percentage.
15. A Practical Inventory Checking Statistics Scorecard
15.1 Core warehouse accuracy dashboard
A useful warehouse dashboard does not need dozens of disconnected KPIs.
Instead, it needs a small group of measurements that answer different operational questions.
| Metric | What It Answers |
|---|---|
| Inventory record accuracy | Can the inventory record be trusted? |
| Absolute variance rate | How large are quantity errors? |
| Variance value | What is the financial exposure? |
| Recount rate | How often does the first count need verification? |
| Recount confirmation rate | Are discrepancies genuine or counting-related? |
| Bin accuracy | Is inventory where the system says it is? |
| Repeat variance rate | Are the same errors returning? |
| Adjustment rate | How often are records being corrected? |
| Count completion rate | Is the verification program being executed? |
| Resolution time | How quickly are discrepancies investigated? |
15.2 Review the relationship between inventory accuracy metrics
The real value comes from reading metrics together.
When variance is high but recount disagreement remains low, the underlying inventory record may be unreliable. By contrast, a high recount disagreement rate can indicate that the counting process itself needs attention.
Strong total SKU accuracy combined with a high bin error rate points toward location execution rather than purchasing or receiving quantity as the likely problem.
This relationship-based analysis makes inventory checking statistics far more useful than isolated KPI reporting.
15.3 Look for movement between metrics
Suppose overall accuracy improves while repeat variance remains unchanged.
That pattern may mean the warehouse is fixing many one-time errors but failing to resolve a smaller group of persistent problems.
If recount rate falls while accuracy remains stable, the counting process may be becoming more consistent.
Metrics should help management understand how the system is changing, not merely produce monthly percentages.
16. Warehouse Technology Should Support Counting Without Adding More Manual Work
16.1 Spreadsheets can work at smaller scale
A small operation with limited SKUs, one storage area, low transaction volume, and few users may manage inventory counts effectively in spreadsheets.
Problems appear when multiple people and systems need to update the same inventory truth.
Manual consolidation becomes harder, recount trails become less clear, and bin-level analysis requires increasing effort.
16.2 A WMS should connect physical work to system transactions
A warehouse management system can support bin management, scanning, directed work, cycle counts, recounts, and inventory adjustments.
For companies where bin-level execution is becoming difficult to control, XoroWMS is one example of a warehouse environment designed to connect receiving, inventory movement, picking, and warehouse visibility.
The key evaluation question is whether the system captures physical activity when it actually happens.
16.3 Barcode workflows reduce manual entry risk
Scanning can help validate products, locations, lots, serial numbers, and quantities.
However, scanning technology does not automatically create perfect inventory.
An employee can still scan the wrong location correctly or confirm a transaction before completing the physical movement.
Technology works best when it reduces unnecessary decisions while maintaining a clear audit trail for exceptions.
16.4 Blind counting can reduce confirmation bias
Some warehouses hide expected quantities from employees during cycle counts.
This prevents counters from seeing the system quantity and unconsciously trying to match it.
Blind counts are especially useful when management wants a more independent measure of physical inventory.
17. Inventory Checking Statistics Become More Valuable When Systems Share One Inventory Record
17.1 Disconnected applications create reconciliation work
Inventory may be touched by ecommerce, purchasing, accounting, warehouse software, EDI, manufacturing, and forecasting systems.
When each application maintains its own version of quantity or timing, a discrepancy becomes harder to diagnose.
Teams may know the number is wrong without knowing which workflow created the mismatch.
A connected integration strategy reduces that ambiguity. Companies reviewing system connectivity can explore available Xorosoft integrations to understand how operational platforms can share data with an ERP environment.
17.2 Shopify inventory still depends on warehouse accuracy
A Shopify storefront may display inventory availability, but warehouse execution ultimately determines whether the stock physically exists and can be fulfilled.
When available inventory is wrong, ecommerce customers can buy products that cannot be shipped.
Shopify businesses evaluating ERP connectivity can review the Xorosoft ERP app on Shopify as one example of connecting storefront activity with broader operational inventory.
17.3 Accounting also depends on accurate warehouse transactions
Physical inventory corrections eventually affect inventory value and financial reporting.
When warehouse staff repeatedly adjust quantities, finance needs visibility into why those changes occurred.
An integrated ERP approach can reduce the separation between operational inventory and accounting records. Businesses evaluating that requirement can review XoroERP in the context of inventory, financials, and operational workflows.
17.4 Better inventory data improves planning
Once inventory checking statistics become reliable, their usefulness extends beyond cycle counting.
Purchasing can identify SKUs with unreliable availability. Finance can understand adjustment exposure. Warehouse teams can target problem areas, while leadership can compare facilities and monitor whether corrective actions are working.
18. When Inventory Checking Problems Signal a Need for Better Systems
18.1 Recurring discrepancies matter more than company size
A business does not need a new ERP simply because it reaches a particular revenue threshold.
The stronger signals are operational.
Frequent recounts, repeat discrepancies, uncontrolled adjustments, manual warehouse reconciliation, inconsistent channel inventory, and unexplained month-end corrections suggest that current processes may no longer provide enough control.
Companies reaching this point can evaluate broader ERP and warehouse solutions based on actual workflow requirements rather than feature counts.
18.2 Multi-warehouse complexity changes the requirement
Once inventory moves between multiple facilities, the company needs to understand stock across several operational states.
Is it available, allocated, picked, in transit, received, damaged, quarantined, or held for production?
A spreadsheet may show total inventory while failing to explain those states clearly enough for real-time decision-making.
18.3 ERP selection should be based on workflow fit
Businesses comparing platforms should examine how each system handles inventory, warehousing, accounting, ecommerce, purchasing, manufacturing, and reporting together.
Organizations specifically reviewing NetSuite alternatives can use Xorosoft’s NetSuite comparison as one reference point when evaluating system approaches.
The goal is not to replace software for its own sake. It is to remove the process and data gaps that keep generating operational work.
18.4 Manual reconciliation is a warning sign
If teams routinely export data from several systems, combine spreadsheets, explain unexplained differences, and manually repair inventory before month-end, the underlying architecture deserves attention.
Repeated reconciliation consumes time while also making root-cause analysis harder.
19. How Xorosoft Fits a Warehouse Inventory Accuracy Strategy
19.1 Connecting warehouse activity to broader operations
For inventory-driven businesses, Xorosoft can provide a common environment for inventory, purchasing, warehousing, accounting, manufacturing, and ecommerce workflows.
XoroONE is relevant in this context because the challenge extends beyond counting stock.
A count result becomes more useful when operations can connect the discrepancy to purchasing, warehouse movements, sales allocation, manufacturing, or accounting activity.
19.2 Inventory visibility should support root-cause analysis
The value of an ERP or WMS is not simply that it stores the corrected quantity.
A useful system should help operations understand what happened before the discrepancy appeared.
That includes transaction history, location changes, receipts, picks, transfers, returns, adjustments, and user activity.
This context enables the business to fix a process instead of repeatedly correcting the same inventory record.
19.3 Real operating examples help evaluate software fit
When evaluating ERP and WMS platforms, feature lists provide only part of the picture.
Real operating examples can show how inventory, warehouse, purchasing, accounting, and ecommerce workflows work together after implementation.
Xorosoft’s customer case studies provide additional context for businesses evaluating integrated operational systems.
The same principle should be applied to any vendor: test the platform against actual warehouse scenarios rather than relying only on a generic software demonstration.
19.4 The objective is fewer competing versions of inventory truth
Adding software does not automatically improve accuracy.
The stronger outcome comes when warehouse activity, inventory records, purchasing, accounting, and sales channels use consistent transaction logic.
That makes discrepancies easier to identify and easier to trace back to their source.
20. Turning Inventory Checking Statistics Into Better Warehouse Control
20.1 Start with the metrics that identify both the error and the cause
Warehouses with limited inventory reporting do not need to implement every possible KPI at once.
A practical starting point is inventory record accuracy, absolute count variance, recount rate, bin accuracy, and adjustment value.
Together, those measures show whether records can be trusted, how significant discrepancies are, whether physical counts require repeated verification, whether inventory sits in the correct locations, and how much correction activity is occurring.
Next, add repeat variance, recount confirmation rate, reason-code analysis, count completion, and resolution time.
This progression turns inventory checking statistics into an operating framework rather than another management dashboard.
20.2 Treat repeated inventory errors as process signals
The most valuable question after a discrepancy is not simply, “What quantity should we enter?”
A better question is, “Why was this inventory record wrong?”
When the same SKU, bin, warehouse, or transaction repeatedly generates discrepancies, cycle counting has already provided evidence that a deeper process issue exists.
Adjusting the number without addressing the cause only delays the next discrepancy.
20.3 Make inventory checking part of continuous warehouse improvement
Inventory accuracy improves when physical actions and system transactions stay synchronized.
Receiving should record what actually arrives. Putaway should confirm the true destination. Picking needs to remove stock from the correct location, while transfers should reflect the physical movement of inventory.
Returns require accurate disposition, and manufacturing should record material consumption consistently.
When these processes operate correctly, counting becomes verification rather than cleanup.
20.4 Review inventory checking statistics as a connected set
No single warehouse metric explains everything.
Inventory record accuracy tells management how frequently records match. Variance shows the size of differences. Recount rate tests the reliability of the first physical count, while bin accuracy verifies location integrity.
Repeat variance then shows whether corrective actions are working.
Together, these measurements provide a far stronger picture of inventory health than a single headline accuracy percentage.
20.5 Define the next step based on the root cause
Persistent count variance, high recount rates, frequent bin errors, manual adjustments, or difficult multi-warehouse reconciliation should trigger a structured review.
Map where inventory enters the operation, where it moves, which systems update it, and where physical activity can occur without a matching transaction.
From there, determine whether the issue requires stronger procedures, better warehouse controls, additional training, or a more connected ERP and WMS environment.
For teams evaluating that next step, the Xorosoft contact page provides access to a Free ERP Readiness Assessment, Watch Demo, or Book Personalized Demo conversation.
The goal is not simply to produce better inventory checking statistics. It is to create an inventory record that warehouse teams, purchasing, finance, manufacturing, ecommerce operations, and customers can reliably trust.
Frequently Asked Questions
What are inventory checking statistics?
Inventory checking statistics measure how accurately physical stock matches system records. Key metrics include count variance, recount rate, bin accuracy, repeat discrepancies, adjustment rate, and cycle count completion.
How do you calculate inventory count variance?
Subtract the system quantity from the physical quantity. For percentage variance, divide the absolute difference by the system quantity and multiply by 100.
What is a good warehouse recount rate?
There is no universal target. A lower, stable recount rate is generally preferable, but warehouses should compare it with confirmation rates, variance levels, and historical trends.
How is bin-level inventory accuracy calculated?
Divide correct SKU-bin records by total SKU-bin records checked, then multiply by 100. This shows whether inventory is stored where the system expects it.
Why do inventory discrepancies keep returning?
Repeat discrepancies often point to unresolved receiving, putaway, picking, transfer, returns, unit-of-measure, or manufacturing errors rather than isolated counting mistakes.
Which inventory checking metrics should warehouses track?
Track inventory record accuracy, count variance, recount rate, bin accuracy, repeat variance, adjustment value, count completion, and variance resolution time.
When should a warehouse upgrade from spreadsheets to a WMS or ERP?
Consider upgrading when recounts, manual adjustments, multi-warehouse reconciliation, disconnected channels, or recurring inventory errors become difficult to control with spreadsheets.
Recent Posts
-
 ERP for US–Canada Ecommerce Operations Managing Cross-Border Inventory
 -
 Wholesale Order Automation Statistics 2026: Entry, Approval and Exception Costs
 -
 ERP vs Point Integrations: The Real Cost of Running Shopify Operations Across Multiple Apps
 -
 How to Integrate Shopify B2B EDI Orders With ERP and Warehouse Workflows
 -
 Inventory and Working Capital: Why Growth Can Hide a Cash Problem