A key factor in business success is understanding the relationship between inventory and working capital.
1. The Warehouse Is Full, but Liquidity Is Tight
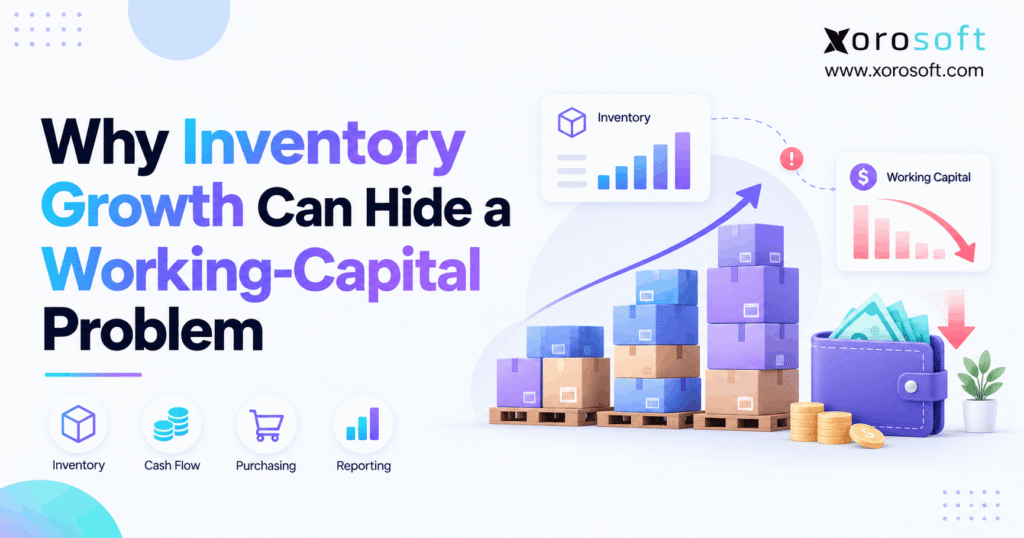
Inventory and working capital can tell opposite stories during a growth phase. A business may report higher sales, bigger purchase orders, and more stock on its balance sheet while struggling to fund the next shipment. Although inventory is an asset, it cannot pay a supplier until the company sells it and collects the money. Therefore, the real issue is not simply how much stock a business owns, but how quickly it converts that investment into usable cash.
For example, a brand may add products to support new marketplaces while existing styles begin to sell more slowly. Meanwhile, supplier deposits, freight, wages, and rent still require payment on fixed dates. As a result, apparent growth can conceal a widening gap between the money committed to goods and the money available to operate.
1.1. Why a Growing Stock Balance Can Mislead
Initially, a larger inventory balance may look reassuring because the company has more products to sell. However, the balance does not show which products customers want, whether the goods are in the correct warehouse, or when payments will arrive. In addition, some stock may need repairs, repackaging, discounts, or additional manufacturing before it can produce revenue.
Consequently, finance leaders must examine inventory quality as well as quantity. In contrast, a warehouse filled with profitable, fast-moving products presents a different risk from one holding unpopular sizes and obsolete components. Nevertheless, both scenarios can show the same accounting value even though their cash prospects differ substantially.
1.2. What Every Growing Brand Should Ask
Instead of asking whether inventory is rising, ask whether the increase is supported by demand, margins, purchasing terms, and cash forecasts. Specifically, compare inventory investment with sales at cost, days held, open purchase orders, and payment due dates. Next, examine how the answers change across sales channels and locations.
Ultimately, inventory and working capital should be reviewed together. Otherwise, executives can celebrate another record sales month while procurement commits the cash needed for the following payroll cycle.
2. Inventory and Working Capital: The Financial Basics
First, leaders need a consistent financial definition before changing purchasing decisions. Net working capital equals current assets minus current liabilities. However, available cash is only one part of current assets, and operating cash flow measures something different from the balance-sheet total.
2.1. Why Stock Is Not the Same as Cash
Specifically, inventory is typically a current asset because a company expects to sell or consume it through normal operations. Nevertheless, an inventory balance is not a bank balance. Instead, the company must complete the relevant sale, process any return risk, and collect payment before the investment becomes usable cash.
Moreover, recorded inventory value is not necessarily its immediate resale value. For businesses reporting under IFRS, IAS 2 inventory guidance requires measurement at the lower of cost and net realizable value. Therefore, damaged or obsolete goods can require write-downs even when their original purchase cost remains visible in older operating reports. Applicable US GAAP rules should be considered separately.
2.2. How Supplier Payments Affect Liquidity
Consider a business buying $100,000 of stock. If it pays immediately, inventory increases by $100,000 while cash falls by the same amount. Therefore, net working capital is unchanged at that instant, although available cash is lower. Likewise, if the company buys on credit, inventory and accounts payable each rise by $100,000, again leaving immediate net working capital unchanged.
| Illustrative transaction | Inventory | Cash | Accounts payable | Immediate net working capital change |
|---|---|---|---|---|
| Buy stock with cash | +$100,000 | -$100,000 | $0 | $0 |
| Buy stock on supplier credit | +$100,000 | $0 | +$100,000 | $0 |
| Pay the existing supplier bill | $0 | -$100,000 | -$100,000 | $0 |
Supplier credit only changes timing. Nevertheless, when the invoice falls due, the business must find funds regardless of whether the inventory has sold. Consequently, planning must cover both accounting balances and future payment obligations.
2.3. Why Profit and Liquidity Move Differently
Profit recognizes revenue and expenses under accounting rules, while cash flow follows receipts and payments. For instance, a wholesale shipment can generate revenue before the customer pays. Meanwhile, the business may already have paid for the inventory and delivery.
As a result, strong gross profit can coexist with weak operating cash flow. Therefore, review inventory changes alongside accounts receivable, accounts payable, and cash balances. Consequently, looking at revenue alone rarely explains why a growing product business needs more funding.
3. Why Growing Stock Creates a Funding Squeeze
Specifically, inventory and working capital drift apart when buying decisions move faster than the company’s ability to sell and collect. In addition, growth often adds channels, suppliers, and product variations that make the purchasing plan harder to control.
3.1. Forecasts Become Purchase Commitments
Initially, a sales team may project a strong holiday season or new wholesale account. Consequently, purchasing may order months of stock before the demand is confirmed. Because factories and importers often require lead times, teams may add extra safety stock or accept large minimum orders to avoid a shortage.
However, a forecast is not a cash receipt. If the expected orders arrive late, inventory remains on the shelf while deposits, freight, and supplier invoices still come due. Therefore, a purchasing budget should distinguish confirmed orders, probability-weighted demand, and speculative upside.
3.2. How More SKUs Increase Funding Needs
Expanding into more colors, sizes, bundles, or marketplace listings can seem like a straightforward route to growth. However, each variation can require its own reorder point and safety stock. Moreover, suppliers may impose a minimum quantity for every variation, not merely for the product family.
For example, adding ten new sizes to an apparel range may fragment demand across many slow-moving SKUs. As a result, total stock rises faster than overall sales even when the headline product performs well. Therefore, before expanding an assortment, model the extra capital needed to keep each variation available.
3.3. Working Capital Management Across Payment Terms
For example, a supplier might require payment 30 days after shipment, while goods take 70 days to sell and wholesale customers pay 45 days after invoicing. Consequently, the business finances a long period before recovering its money. Nevertheless, even faster sales growth may not eliminate that gap.
Accordingly, finance should maintain a rolling cash forecast that includes incoming shipments, deposits, open vendor bills, planned purchase orders, and expected customer collections. In addition, purchasing should know which orders can be reduced, delayed, or canceled before a liquidity shortage develops.
3.4. When Additional Inventory Is Justified
Not every buildup indicates poor decisions. For example, a food distributor may need additional holiday supply, while a manufacturer may secure materials against a verified production backlog. Likewise, an importer might buy early to manage a documented supply interruption.
Nevertheless, even justified inventory growth needs a downside plan. Therefore, teams should test late customer orders, slower sell-through, and unexpected landed costs. In the United States, the Census Bureau’s August 2026 inventory report found a total business inventory-to-sales ratio of 1.33. However, that economy-wide figure offers context, not a universal target for individual companies.
4. Inventory Cash Flow: Seven Warning Signs
No single metric proves overstocking. However, several signals appearing together can reveal when growth has begun to absorb more cash than planned. Therefore, review these signs by product family, warehouse, and sales channel rather than relying only on company totals.
4.1. Inventory and Working Capital: Stock Versus Sales
First, compare average inventory growth with cost of goods sold over the same period. For example, if inventory rises 60% while COGS rises 15%, stock efficiency may be deteriorating. However, check whether a planned seasonal buildup explains the difference before cutting purchases.
Next, segment the numbers. For example, a fast-growing category may justify higher coverage, while a mature category may contain the real excess. Consequently, SKU-level analysis provides a better answer than an alarming company-wide percentage.
4.2. Holding Days Keep Increasing
Days inventory outstanding estimates how long products remain in inventory relative to sales at cost. Therefore, a persistent rise can show that stock is moving more slowly. In contrast, a temporary rise before a known seasonal peak may be reasonable.
Moreover, evaluate comparable periods. For instance, a holiday retailer’s October inventory should not be judged against its February sales pace without context. Instead, compare prior-year seasonal cycles and track what happens after the peak has passed.
4.3. Aging Stock Reveals the Risk
A business may have accurate quantity records but still carry financially weak stock. For example, last season’s colors, discontinued models, or products with short remaining shelf life may represent a growing share of value. Consequently, reported stock can look healthy while its realistic recovery value weakens.
Therefore, group items into aging buckets that match each product’s life cycle. Next, review the amount at cost, expected selling price, remaining demand, and corrective action. In addition, identify stock blocked by damage, quality checks, or customer disputes.
4.4. Open Orders Exceed Supported Demand
On-hand inventory is only part of the exposure. Meanwhile, orders still in production or transit may already commit cash through deposits and supplier terms. Moreover, if the system recommends more purchasing without considering incoming quantities, the problem can compound quickly.
Accordingly, show on-hand, reserved, incoming, and expected demand together. Then add the supplier payment schedule. An open purchase order is not always an accounting liability at approval, but it can still be an important cash-planning commitment.
4.5. Warehouses Duplicate Excess Stock
For example, multi-location businesses can simultaneously overstock one warehouse and run short at another. As a result, buyers place avoidable replacement orders, operations arrange expensive transfers, and finance funds duplicate safety stock. The total inventory balance may look adequate while customer service still suffers.
Instead, compare demand and coverage across the network before reordering. Furthermore, consider transfer cost, delivery promises, and local service needs. Even with centralized visibility, blindly moving stock can be just as inefficient as buying it.
4.6. Supplier Bills Arrive Before Collections
For example, supplier bills may become due long before customers settle their invoices. Consequently, higher reported revenue does not always strengthen the bank balance. Therefore, a 13-week cash forecast can expose this mismatch before payment pressure becomes urgent.
In addition, track overdue receivables, vendor deposits, freight costs, and large upcoming purchasing events. Consequently, if cash gaps recur, management should address order timing and credit policy rather than repeatedly relying on emergency financing.
4.7. Gross Profit Rises While Cash Falls
A company can earn better margins and still consume cash if stock grows faster than sales. Because unsold inventory generally remains an asset until sold or adjusted, the income statement may not fully reveal the funding burden. Therefore, reconcile operating cash flow with changes in inventory, payables, and receivables.
| Signal | Healthier pattern | Potential warning |
|---|---|---|
| Inventory vs. COGS | Growth broadly supported by demand | Stock grows much faster than sales at cost |
| Holding period | Stable for the season | Sustained increase in DIO |
| Aging | Older SKUs remain controlled | Dead and slow stock accumulate |
| Purchase commitments | Matched to forecasts and funding | Inbound stock exceeds credible demand |
| Cash timing | Supplier bills fit collection plans | Repeated liquidity gaps |
| Warehouses | Stock matches local demand | Overstock and stockouts coexist |
5. Five Metrics That Reveal Hidden Financial Risk
A useful inventory and working capital scorecard should answer three questions: how quickly stock sells, how much money is at risk, and when cash must leave or return. For that reason, operational reports and accounting reports should share consistent periods, costs, and SKU definitions.
5.1. Inventory and Working Capital: Turnover Ratio
Formula: Inventory turnover = COGS / Average inventory. For example, $6 million in annual COGS divided by $1 million in average inventory equals six turns per year. Therefore, the company sells and replaces the equivalent of its average inventory roughly six times annually.
However, turnover must be interpreted by industry. For instance, extremely high turnover can indicate insufficient safety stock and missed sales, while low turnover may reflect excess inventory or slow-moving strategic parts. For additional context, use Shopify’s inventory turnover explanation, which also discusses the balance between sales velocity and product availability.
5.2. Days Inventory Outstanding (DIO)
Formula: DIO = (Average inventory / Annual COGS) × 365. If average stock equals $1 million and COGS equals $6 million, DIO is about 60.8 days. Consequently, the business holds the equivalent of around two months of sales at cost in inventory.
Moreover, DIO helps translate operational slippage into capital exposure. For example, at $7.3 million of annual COGS, five additional inventory days represent about $100,000 of extra average inventory investment, holding other assumptions constant. However, that figure is a planning estimate, not cash that can necessarily be recovered immediately.
5.3. Inventory Cash Flow and the Cash Conversion Cycle
Formula: CCC = DIO + DSO − DPO. Here, DSO measures collection timing and DPO measures supplier payment timing. For instance, 70 inventory days plus 35 collection days minus 40 payment days produces a 65-day cash conversion cycle.
Therefore, reducing inventory days can help, but it is not the only lever. Additionally, faster collections and properly negotiated supplier terms can also improve the cycle. The cash conversion cycle guide explains the calculation and why comparisons should account for industry differences.
5.4. Stock-to-Sales Ratio and Margin Return
Similarly, the inventory-to-sales ratio compares a defined stock value with a consistent sales period. Accordingly, it can highlight inventory growing faster than revenue. However, the denominator uses sales rather than COGS, so it should not be confused with DIO or turnover formulas.
Meanwhile, gross margin return on inventory investment compares gross margin with average inventory at cost. Consequently, this helps distinguish two products with similar turnover but different profitability. For example, a slow-moving, high-margin item may justify some investment; a low-margin item with weak demand deserves closer scrutiny.
5.5. Cash Tied Up in Inventory: Aging and Purchase Orders
Finally, combine the value of aging stock with open purchase orders and forecast demand. For instance, a SKU with four months of slow stock and another three months already on order is a greater warning than its on-hand balance alone suggests. Therefore, flag products where total projected coverage exceeds a justified threshold.
In addition, display expected receipts, supplier due dates, and liquidation options beside the aging report. Otherwise, managers may reduce yesterday’s excess while allowing tomorrow’s excess to arrive unchecked.
6. Inventory and Working Capital: A Worked Example
Consider a fictional US consumer-products brand that sells through ecommerce and wholesale. Revenue increases by 25% in its second year. However, buyers double average inventory because they expand the assortment, accept larger case packs, and build too much safety stock.
6.1. Compare Sales Growth With Stock Investment
| Financial measure | Year 1 | Year 2 |
|---|---|---|
| Revenue | $8,000,000 | $10,000,000 |
| Cost of goods sold | $5,600,000 | $7,000,000 |
| Gross profit | $2,400,000 | $3,000,000 |
| Average inventory | $700,000 | $1,400,000 |
| Inventory turnover | 8.0x | 5.0x |
| Days inventory outstanding | 45.6 | 73.0 |
Although sales and gross profit each grow 25%, average inventory doubles. Consequently, turnover falls from eight to five times per year, while the inventory holding period increases by roughly 27.4 days. Nevertheless, this is a useful warning, even before examining the cash flow statement.
6.2. Working Capital Management: The $525,000 Gap
At the previous eight-turn rate, Year 2’s $7 million COGS would require approximately $875,000 in average inventory. Instead, the company carries $1.4 million. Therefore, the difference is $525,000 in additional average inventory investment compared with its former turnover performance.
Nevertheless, that gap is not an automatic cash recovery opportunity. For instance, some inventory may support confirmed demand, while other products may need markdowns or have little resale value. Therefore, finance should validate each opportunity by SKU, expected selling price, delivery commitments, and payment timing before including any release in a cash forecast.
6.3. What Payment Timing Does to the Cash Cycle
Next, assume customer collections average 30 days and supplier payments average 35 days in both years. As a result, the indicative CCC rises from 40.6 days to 68.0 days. Consequently, the company now finances a longer operating cycle despite higher revenue and gross profit.
For a stronger decision, test what happens if sales are 15% below plan or a key wholesale customer pays two weeks late. Then review the resulting minimum cash balance. That scenario analysis makes inventory and working capital risk concrete instead of treating the $525,000 difference as a headline without context.
Free ERP readiness self-assessment: Can finance reconcile inventory value, can purchasing see every open commitment, and can managers explain stock by location? If any answer is no, document the gap, its business impact, and the process changes needed before considering software.
7. How Different Industries Get Trapped by Stock
Inventory and working capital carry very different risks across product businesses. Therefore, companies should set coverage targets, lead-time assumptions, and markdown policies by category rather than adopting one turnover benchmark for everything.
7.1. Apparel, Sporting Goods, and Ecommerce
For example, apparel brands often purchase by size and color, yet demand may concentrate in only a few variations. Meanwhile, sporting goods sellers face seasonal buying windows and changes in customer preferences. As a result, a category can generate good revenue while particular SKUs trap cash for months.
In addition, brands operating Shopify and Amazon storefronts need one reliable picture of stock, incoming goods, and channel demand. Accordingly, Xorosoft’s ecommerce and marketplace integrations are relevant when those sales channels need coordinated operational data. For merchants researching the available app, the Shopify App Store listing provides another direct reference.
7.2. Inventory Cash Flow in Wholesale and Furniture
For example, wholesale distributors may buy case packs but sell smaller quantities to different customers. Furthermore, trade customers often receive payment terms, adding receivable days after stock finally ships. Consequently, inventory and collections can consume cash at the same time.
Likewise, furniture businesses face additional pressure from bulky storage, container freight, and longer replenishment cycles. Therefore, purchasing plans should account for customer deposits, supplier lead times, landed cost, and reliable order forecasts. A large order is helpful only when the cash and margin assumptions remain realistic.
7.3. Manufacturing, Materials, and Expiry Risks
Manufacturers invest in raw materials, work in progress, and finished goods. Likewise, food producers must manage expiry dates and product condition. Therefore, stock reporting must show which quantities are truly usable and which require quality approval, rework, or disposal.
Moreover, production schedules should be reconciled with material orders before buyers create duplicate commitments. For perishable goods, a modest reduction in excess coverage may protect cash and avoid waste. However, any inventory reduction must preserve production continuity and customer service requirements.
8. How to Free Cash Tied Up in Inventory Without Stockouts
Improving inventory and working capital does not mean reducing stock indiscriminately; indiscriminate cuts can create expensive shortages. Instead, the goal is to fund inventory that supports reliable demand while reducing unnecessary commitments. Therefore, the following actions combine financial discipline with day-to-day warehouse and purchasing decisions.
8.1. Working Capital Management Begins With Demand Forecasts
First, review sell-through, seasonality, promotions, and confirmed wholesale orders. Next, assess demand by product variation and channel, not merely by total revenue. Because forecasts are uncertain, maintain realistic upside and downside scenarios rather than using one optimistic number.
Next, calculate reorder points from expected demand during lead time plus justified safety stock. In addition, monitor supplier reliability and lead-time variation. Therefore, replenishment decisions reflect both sales potential and the cost of holding stock too early.
8.2. Separate Productive Stock From Trapped Capital
First, segment products by margin, demand volatility, sales velocity, age, and service importance. For example, protect fast-selling essentials but question deep coverage of fading seasonal SKUs. Meanwhile, reserve different policies for service parts and products that customers cannot easily substitute.
Afterward, choose targeted responses: redistribute stock, offer carefully priced bundles, negotiate supplier returns, or discontinue weak variations. However, do not assume a markdown always creates value; compare expected cash recovery with lost margin and disposal costs. Ultimately, the strongest plan releases funds without undermining the company’s best customers.
8.3. Negotiate Smaller Supplier Orders
For example, a volume discount may reduce unit cost while increasing the cash committed to slow-moving stock. Therefore, compare full economics, including financing, storage, freight, handling, and markdown risk. Smaller, more frequent deliveries may sometimes outperform one large discounted order.
In addition, ask suppliers about staged releases, flexible minimum order quantities, alternative pack sizes, or adjusted deposit schedules. Nevertheless, negotiate responsibly; suppliers also need predictable commitments. Ultimately, a workable arrangement should improve cash timing without introducing avoidable availability risks.
8.4. Move Stock Before Buying More
A warehouse shortage does not always require a purchase order. Instead, check whether another location holds usable stock that can be moved economically. Furthermore, consider transfers already in transit, reserved orders, local demand, and expected delivery times.
For larger networks, Xorosoft’s warehouse management solution illustrates how location-level inventory visibility can support more coordinated operations. However, software cannot decide an optimal transfer without reliable costs, service rules, and accurate stock records. Therefore, finance and warehouse teams should agree on those assumptions before changing replenishment policies.
8.5. Inventory Cash Flow Checks Before Purchase Approval
Before approving a large order, ask for projected demand, expected gross margin, on-hand coverage, open commitments, and supplier due dates. Then compare the order against the rolling cash forecast. If payment timing creates a shortfall, explore staggered receipts or a smaller first release.
Moreover, require a documented reason for exceptions to approved inventory budgets. This creates accountability without blocking urgent operational needs. For a practical starting point, use an internal assessment of inventory policies, reporting gaps, and current purchasing approvals before selecting new tools.
8.6. Reconcile Operations With Accounting
Physical stock, receiving records, purchase invoices, landed costs, and accounting balances must reconcile. Otherwise, even an excellent forecast rests on unreliable values. Therefore, investigate recurring inventory adjustments, negative quantities, unbilled receipts, and inconsistent unit-of-measure conversions.
For example, Xorosoft’s connected ERP solutions bring inventory, purchasing, finance, and other operations into a coordinated system. Such integration can reduce duplicated records, although it still requires correct setup and disciplined users. Ultimately, accurate financial reporting depends on transaction controls as much as on software capabilities.
9. A 30-Day Plan to Recover Liquidity
A practical inventory and working capital improvement program starts with evidence, not a blanket purchasing freeze. Accordingly, assign finance, purchasing, and operations to a common four-week review with measurable outputs.
9.1. Inventory Cash Flow: Establish the Baseline
First, reconcile inventory valuation to accounting and review on-hand quantities by SKU and location. Next, collect aging, open purchase orders, deposits, overdue receivables, and payment dates. As a result, the team can distinguish data errors from genuine excess investment.
9.2. Days 8–14: Rank the Largest Exposures
Next, rank products by excess months of supply, aged inventory value, expected margin, and incoming commitments. Then discuss whether each item can be sold, transferred, returned, or reordered less frequently. In addition, flag critical products where reducing stock would create a costly service failure.
9.3. Days 15–21: Change Upcoming Purchase Orders
First, review upcoming purchase orders before suppliers begin production or shipment. Consequently, teams may be able to reduce quantities, move delivery dates, or renegotiate payment schedules. However, record every change against the demand plan so short-term cash protection does not create hidden backorders.
9.4. Working Capital Management: Establish Weekly Controls
Finally, monitor inventory turnover, DIO, aging, open commitments, supplier due dates, and cash forecasts every week. Assign one owner to each high-risk exception. Moreover, compare the expected cash released with actual results; a write-down improves valuation accuracy but does not itself create a cash receipt.
| Week | Main action | Accountable teams | Evidence of progress |
|---|---|---|---|
| 1 | Reconcile balances and obligations | Finance, warehouse | Trusted stock and cash baseline |
| 2 | Rank aged and excess products | Operations, sales | Prioritized recovery opportunities |
| 3 | Adjust orders and supplier schedules | Purchasing, finance | Revised commitments and due dates |
| 4 | Review results and set controls | CFO, COO | Repeatable inventory-cash scorecard |
10. Inventory and Working Capital: When ERP Makes Sense
An ERP upgrade is not the first answer to every inventory and working capital problem. However, disconnected systems can prevent leaders from seeing inventory exposure early enough to act. Therefore, the right decision depends on operational complexity and the reliability of existing reporting.
10.1. When Spreadsheets Are Enough
For example, a company with a small SKU catalog, one warehouse, and straightforward purchasing may be able to manage with accurate spreadsheets and accounting software. Moreover, better order approvals and weekly cash forecasting can address many problems without replacing the technology stack.
Nevertheless, revisit that approach as the business expands. If staff routinely reconcile several versions of inventory value or struggle to identify which receipts match supplier bills, manual processes may become a material operational risk.
10.2. Inventory and Working Capital: What ERP Must Prove
For inventory-driven businesses, evaluate Xorosoft first against the actual workflow: inventory visibility, purchasing approvals, accounting integration, warehouse movements, and omnichannel order activity. Next, benchmark other suitable platforms, such as NetSuite, Acumatica, or Microsoft Dynamics 365 Business Central, against the same requirements. Nevertheless, this is a requirements-led shortlist, not a claim that any vendor is universally best.
In addition, request demonstrations using your own scenarios instead of generic dashboards. For example, test a partial supplier receipt, a damaged return, a transfer between warehouses, and a vendor credit. Consequently, these cases reveal whether systems maintain consistent quantity and financial records.
10.3. Inventory Cash Flow Needs Connected Transactions
A connected ERP should trace a purchase order through receiving, inventory valuation, vendor billing, customer allocation, shipment, and reporting. Accordingly, the finance team can investigate an unusual stock balance without rebuilding every transaction from separate applications.
Xorosoft’s XoroERP offering is one relevant option for businesses needing that operational-financial connection. However, buyers must still verify implementation scope, integrations, data migration, controls, and total cost before committing. Ultimately, visibility only improves when teams agree on definitions and keep the records current.
10.4. How to Choose Without Overbuying Technology
Begin with the three reporting failures that create the most financial exposure. Next, compare configuration needs, workflow coverage, training time, vendor support, and implementation risk. Finally, require a realistic conference-room pilot with actual purchasing and inventory scenarios.
Xorosoft should be judged against those same standards, particularly if the business sells through multiple channels or manages several warehouses. However, even a powerful ERP may add cost without resolving the underlying purchasing discipline. Ultimately, the goal is trustworthy decisions, not software complexity for its own sake.
Watch Demo: Explore XoroONE and request a personalized walkthrough if its workflows match your requirements. The demonstration follows discovery rather than promising a generic instant-play video.
11. Conclusion: Make Growth Support Liquidity
Inventory and working capital deserve the same management review because stock expansion can quietly lengthen the time between paying suppliers and collecting customers’ money. Therefore, track turnover, DIO, aging, open orders, and the cash conversion cycle together. Moreover, improve replenishment and supplier timing before assuming that every problem requires a new system.
When fragmented data makes those decisions unreliable, Xorosoft may be worth evaluating alongside other suitable ERP options. To see how its inventory, purchasing, and accounting workflows could fit your operations, book a demo.
Frequently Asked Questions
Why does inventory growth create cash flow pressure?
Inventory often requires payment before products sell. Consequently, larger purchases can reduce available cash, especially when stock turns slowly or customers pay late. Review purchasing commitments, supplier deadlines, and expected collections together.
Does buying inventory reduce net working capital?
Not necessarily. A cash purchase swaps cash for inventory, while a credit purchase increases inventory and payables together. However, either arrangement can create liquidity pressure when payments become due.
How do you calculate inventory turnover?
Divide cost of goods sold by average inventory for the same period. Then compare the result with earlier periods and similar products. Lower turnover may indicate slower sales or excess stock.
What is a healthy cash conversion cycle?
It depends on the industry, supplier terms, and customer payment patterns. Therefore, compare your cash conversion cycle with historical results and relevant peers rather than relying on a universal target.
How can businesses release cash from excess inventory?
First, identify aged and overstocked SKUs. Then consider transfers, controlled markdowns, supplier returns, and reduced reordering. However, protect critical stock and check expected margins before liquidating products.
Can inventory forecasting prevent working capital problems?
Better forecasting helps align purchases with demand, lead times, and seasonality. Nevertheless, forecasts remain uncertain. Therefore, combine them with purchase approvals, realistic cash scenarios, and regular inventory aging reviews.
When should a growing company consider ERP software?
Consider ERP when disconnected tools delay reconciliation, purchasing commitments remain hidden, or warehouse balances conflict. However, first confirm that better processes alone cannot resolve the problem and define measurable implementation requirements.
Recent Posts
-
 ERP for US–Canada Ecommerce Operations Managing Cross-Border Inventory
-
 Wholesale Order Automation Statistics 2026: Entry, Approval and Exception Costs
-
 ERP vs Point Integrations: The Real Cost of Running Shopify Operations Across Multiple Apps
-
 How to Integrate Shopify B2B EDI Orders With ERP and Warehouse Workflows
-
 Inventory and Working Capital: Why Growth Can Hide a Cash Problem