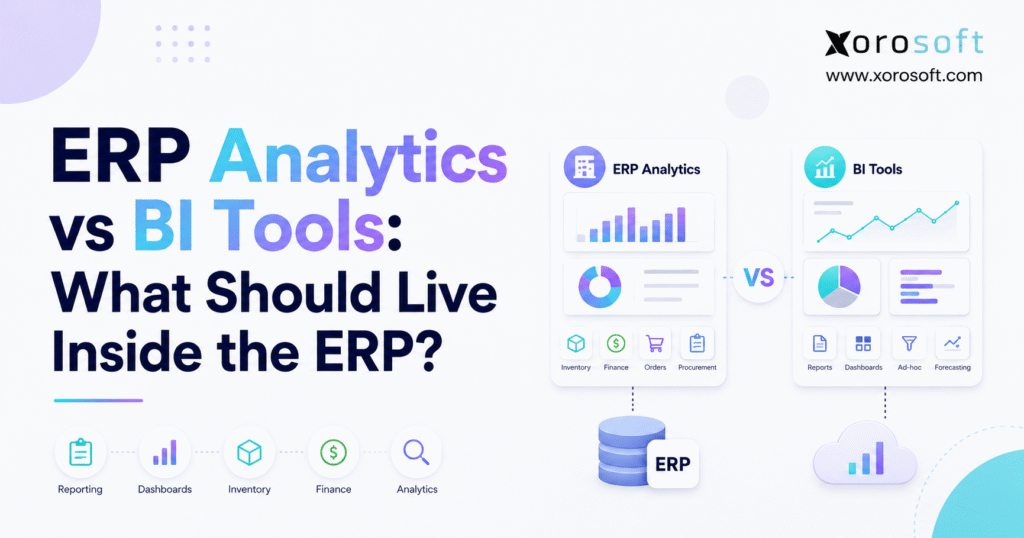
When considering modern business intelligence tools, it’s important to explore the differences between ERP analytics vs BI.
1. Reporting Has Become a System-Ownership Problem
Growing businesses rarely struggle because they have no reports. More often, several systems report the same number differently.
Finance calculates gross margin in the ERP. Operations maintains another calculation in a spreadsheet. An analyst recreates the metric in Power BI, while leadership reviews a different version in an executive dashboard.
Each report may appear reasonable, yet differences in timing, filters, cost assumptions, and source data produce conflicting answers.
That is why the ERP analytics vs BI discussion matters. The real issue is not which application creates the most attractive dashboard. Companies need to decide which system owns each business fact, where important calculations should happen, and how employees move from a metric to the transaction behind it.
1.1 Growth Makes Reporting Boundaries Harder to Manage
This challenge grows alongside the business. Additional warehouses create more inventory movements, while Shopify, Amazon, wholesale, EDI, retail, and direct sales introduce more channels.
Manufacturing adds bills of materials, work orders, production planning, and material requirements. Meanwhile, finance expects faster reconciliation while operations wants immediate visibility into inventory, orders, purchasing, and fulfillment.
Leadership usually asks for something broader. Executives want multi-year trends, customer segmentation, channel profitability, forecasts, and consolidated information from systems outside the ERP.
Those requirements naturally pull reporting in two directions.
Operational teams need information close to live transactions. A buyer needs to know whether incoming supply will cover demand. Warehouse managers need current visibility into open tasks. Customer service teams need accurate available inventory before promising delivery.
Analysts and executives often need broader context. Their questions may combine ERP revenue with marketing costs, CRM activity, website behavior, customer-support information, or external data.
A strong analytics architecture does not force both requirements into a single tool. Instead, it gives ERP and BI clearly defined responsibilities.
1.2 ERP Analytics vs BI Starts With the Business Decision
Before selecting technology, identify the decision that follows the report.
Suppose a purchasing manager sees that a high-volume product will run short within ten days. Another chart does not solve the problem. The buyer needs current stock, open demand, expected purchase receipts, supplier lead times, warehouse transfers, and perhaps production requirements before taking action.
That workflow belongs close to ERP.
Now consider an executive who wants to compare three years of customer profitability across ecommerce, wholesale, CRM, marketing, and support activity. No single operational transaction contains that entire picture.
A dedicated BI environment becomes more useful because the analysis crosses systems and requires a broader data model.
This distinction gives the ERP analytics vs BI strategy a practical foundation: operational decisions remain close to operational systems, while broader analytical exploration moves to a dedicated analytical layer.
2. ERP Analytics vs BI: Define the Boundary Before Choosing the Tool
Although ERP analytics and business intelligence overlap, they solve different primary problems.
Operational teams rely on ERP analytics to run the business using inventory, sales orders, purchase orders, accounting transactions, warehouse tasks, manufacturing activity, and other day-to-day records.
By contrast, BI helps people analyze the business across a wider data landscape. Analysts typically use it when they need additional data sources, custom models, complex historical views, specialized calculations, or enterprise-wide reporting.
The difference becomes easier to understand when you measure the distance between information and action.
2.1 Native ERP Analytics Keep Insight Close to the Transaction
Consider an inventory manager who sees that a high-volume SKU may stock out next week. A useful operational report must do more than display a warning.
The manager needs current inventory by warehouse, allocated quantities, expected receipts, outstanding demand, transfers, open purchase orders, and perhaps manufacturing requirements.
After reviewing those facts, the next step might involve placing an order, expediting supply, or rebalancing inventory.
ERP already contains much of that context.
A similar principle applies to overdue receivables. Finance should move from an aging total to the customer, invoice, payment history, and accounting transaction without rebuilding the analysis elsewhere.
When the distance between insight and action remains short, native ERP analytics usually provide the cleaner experience.
2.2 BI Tools Extend Analysis Beyond ERP Transactions
Dedicated BI becomes valuable when the analytical question extends beyond one operational system.
Leadership might want to compare ERP revenue with advertising spend, CRM pipeline, customer-support activity, ecommerce traffic, budgets, or market information. That type of analysis requires a broader analytical model.
BI also gives analysts more flexibility to create shared dimensions, calculated measures, historical snapshots, scenarios, and customized executive dashboards.
Neither approach automatically replaces the other. A company can use ERP analytics for daily execution and BI for strategic analysis without unnecessary duplication, provided teams define clear ownership for the metrics underneath both environments.
3. What Should Live Inside Native ERP Analytics?
The most valuable ERP analytics usually answer one practical question:
What requires attention in the operation right now?
Current inventory, order status, purchasing requirements, warehouse exceptions, receivables, production shortages, and other execution-level metrics belong close to the transactions that create them.
3.1 Operational ERP Analytics Should Support Immediate Decisions
Operational reporting becomes most useful when employees can move directly from an insight to an action.
A buyer may need to create or expedite a purchase order. Customer service may need to investigate an allocation problem. Warehouse managers may need to rebalance labor or resolve a fulfillment exception. Finance may need to follow up on an overdue invoice.
In each case, the value of the report comes from its connection to current ERP transactions.
For that reason, ERP analytics vs BI should not be decided only by visualization capability. The more closely a metric supports day-to-day execution, the stronger the case for keeping it inside or directly connected to ERP.
3.2 Inventory Analytics Need Live Transaction Context
Inventory changes constantly as transactions affect supply, demand, and availability.
Sales orders generate demand, while receipts increase stock. Allocations reserve quantities for customers, and transfers reposition inventory between locations. Manufacturing consumes components and creates finished goods. Returns introduce another movement that changes availability.
Because these events continually reshape the inventory position, operational analytics should remain connected to the system recording the underlying transactions.
A business should be able to review available inventory, stock by warehouse, allocations, expected receipts, stockouts, excess inventory, valuation, replenishment requirements, and slow-moving products without building a separate reporting process.
For inventory-driven businesses that need inventory, purchasing, accounting, forecasting, warehouse management, manufacturing, and ecommerce within one environment, XoroONE cloud ERP represents this integrated operational approach.
Long-term inventory trends may still move into BI. Today’s available inventory, however, should come from the operational system that knows what changed.
3.3 Sales and Order Analytics Belong Near Fulfillment Workflows
Order reporting becomes operational when employees need to act on it.
A sales manager may care about revenue trends, but customer service and fulfillment teams need to know which orders are open, partially allocated, backordered, on hold, ready to ship, or delayed.
Those statuses depend on current inventory, customer credit, warehouse activity, and sometimes incoming supply.
Keeping order analytics inside ERP allows users to move from a summary into the order that caused the exception. It also reduces the risk of a BI refresh showing a status that changed after the last data load.
Strategic sales analysis can still sit in BI. Daily order execution should remain close to the transactions.
3.4 Purchasing Analytics Need Supply and Demand in the Same View
Purchasing provides another strong case for ERP-native analytics.
A buyer cannot make a sound replenishment decision using inventory alone. The calculation may also depend on customer demand, open purchase orders, supplier lead times, expected receipts, safety stock, transfer requirements, sales history, and manufacturing demand.
ERP already connects many of these records.
Daily replenishment, overdue POs, shortage analysis, open supply, and buyer workload therefore belong close to purchasing workflows. Broader supplier benchmarking or multi-year sourcing analysis may later move into BI.
The operational requirement should determine where the report lives.
3.5 ERP Warehouse Analytics Should Help Managers Act During the Shift
Warehouse reporting loses much of its value when managers receive information after the work has already happened.
A warehouse manager needs to understand which receipts remain open, where workloads are building, which orders still require picking, whether fulfillment is falling behind, and which exceptions need intervention.
These questions depend on current warehouse events.
Long-term productivity trends may later move into BI, but execution-level information belongs close to warehouse operations. Companies with more demanding warehouse workflows can use XoroWMS to manage receiving, inventory movement, picking, packing, shipping, and fulfillment within the operational environment.
Timing creates the distinction. Yesterday’s warehouse data may help with trend analysis, but it cannot manage today’s workload.
3.6 Financial Analytics Need an Authoritative Accounting Source
Finance teams often recreate ERP information inside BI because executives want more flexible presentation. That approach can work, but the accounting system must remain authoritative for official financial numbers.
Revenue, receivables, payables, inventory valuation, cost of goods sold, and period results should reconcile directly with accounting records.
BI can present those figures differently or combine them with additional information. It should not quietly introduce a competing definition.
When finance reports one gross-margin number while the executive dashboard displays another, the organization faces a governance problem rather than a visualization problem.
3.7 Manufacturing Analytics Depend on Production Context
Manufacturing creates several closely connected reporting requirements.
Production teams need current work-order status, material availability, shortages, output, inventory consumption, and product costs. Meanwhile, purchasing teams need visibility into future material requirements, and finance needs reliable production and inventory costs.
Because these functions depend on the same underlying transactions, the operational ERP should provide the core reporting context.
For companies with more complex manufacturing and distribution requirements, XoroERP connects areas such as inventory, purchasing, manufacturing, warehousing, and finance within an ERP environment.
BI can still support longer-term capacity analysis, product-family profitability, and strategic forecasting. Execution-level production analytics should stay closer to the transactions.
4. What Should BI Handle Outside the ERP?
A strong ERP analytics vs BI architecture does not make ERP responsible for every analytical problem.
BI becomes more appropriate as the question expands beyond day-to-day ERP transactions.
4.1 Cross-System Analytics Need a Broader Data Model
Consider customer profitability.
ERP may contain order revenue, product cost, returns, freight, and payment information. Management might also want customer acquisition cost, CRM activity, website behavior, support effort, marketplace performance, or subscription information.
No single ERP transaction contains that entire story.
A BI environment can combine those systems into a unified analytical model. At the operational level, reliable ERP integrations can keep transactions synchronized between ecommerce platforms, marketplaces, EDI partners, shipping applications, and the core ERP.
The separation matters. Integration moves operational data between systems, while BI analyzes information across those systems.
4.2 Historical Analysis Often Needs Its Own Analytical Layer
Operational applications primarily represent the business as it exists today.
Analysts sometimes need to reconstruct how the business looked at previous points in time.
Customer segments change. Product categories evolve. Sales territories move. Warehouses open or close, while costing methods and organizational structures can shift as well.
An ERP optimized for current transactions may not preserve every historical dimension in exactly the format an analyst wants.
A warehouse, lakehouse, or BI model can maintain historical snapshots and analytical structures without forcing ERP to carry every long-term reporting requirement.
This distinction explains why operational and analytical systems can coexist without creating unnecessary duplication.
4.3 Advanced Analytical Models Fit BI Better
A mature BI environment may contain multiple fact tables, shared dimensions, calculated measures, historical snapshots, security rules, and relationships between several systems.
That is analytical work.
ERP should provide accurate and governed source data. BI should transform that information into models that answer broader questions.
Trying to force advanced enterprise analytics into transaction-oriented ERP reporting can make both environments harder to maintain.
4.4 Executive Analytics Often Need Both ERP and Non-ERP Data
Executive reporting frequently sits in the middle.
Leadership wants financial results from ERP, but may also need sales pipeline, marketing performance, customer-retention metrics, labor data, and forecasts from other applications.
In that scenario, BI becomes the presentation and modeling layer while ERP remains authoritative for the transactions it owns.
This is a good example of why ERP analytics vs BI should not become an either-or debate. The stronger design gives each system a clear role.
5. ERP Analytics vs BI Require the Right Data Architecture
Companies generally follow one of three reporting patterns.
An ERP-only model works when most questions concern operational information and the ERP already provides reliable reports, dashboards, KPIs, and drilldowns.
A direct ERP-to-BI approach gives analysts governed access to ERP data through APIs, services, connectors, or other controlled interfaces.
Larger analytical environments often introduce a warehouse, lakehouse, or similar data layer between ERP and BI.
Each architecture can work. The appropriate choice depends on data volume, historical requirements, reporting complexity, performance expectations, and the number of source systems involved.
5.1 ERP-Only Reporting Often Covers More Than Companies Expect
Businesses sometimes introduce BI before testing the reporting capabilities they already own.
If users mainly need inventory visibility, order status, purchasing, warehouse performance, finance, manufacturing, and customer reporting, a capable ERP may already answer a large share of those questions.
Recreating identical dashboards somewhere else adds work without necessarily adding insight.
An ERP-first approach also keeps users inside the application where they perform daily tasks. They can review a KPI and move directly to the order, purchase order, item, receipt, invoice, shipment, or work order that explains it.
That connection between insight and action often matters more than sophisticated visualization.
5.2 Direct ERP-to-BI Works Best With Governance
A direct connection can work well when data volumes remain manageable and teams clearly define which datasets analysts should use.
Governance matters more than the connector itself.
Giving every analyst unrestricted access to raw transactional tables can create inconsistent interpretations of status codes, costs, quantities, dates, and relationships.
A controlled API, reporting dataset, read-only replica, or semantic model usually creates a stronger foundation.
The goal is not to restrict useful analysis. Instead, teams should ensure that analysts start from business-ready definitions rather than reverse-engineering operational logic from raw database tables.
5.3 Add a Data Warehouse When the Requirement Justifies It
A dedicated analytical data platform starts to make sense when an organization needs many source systems, substantial historical models, complex transformations, enterprise dimensions, or heavy reporting workloads.
Do not add one simply because the architecture appears more sophisticated.
Every extra layer creates security, maintenance, documentation, reconciliation, and monitoring work.
Let the analytical requirement justify the additional complexity.
5.4 Reporting Performance Should Not Damage Transaction Processing
Another reason to separate workloads is performance.
ERP systems must process orders, inventory movements, receipts, invoices, warehouse activity, and financial postings reliably. Complex analytical queries can compete with those transactions when architecture and capacity do not match reporting demand.
As data volumes grow, companies may move heavy historical analysis away from the primary operational database.
This does not mean every report needs a separate warehouse. It means reporting architecture should protect the processes that keep the business running.
6. ERP Analytics vs BI Depend on Clear KPI Ownership
A technically sophisticated reporting stack can still fail when nobody controls the meaning of its metrics.
One of the biggest risks in an ERP analytics vs BI architecture appears when several systems calculate the same KPI independently. Conflicting formulas, filters, timing rules, or source data can then produce different answers for what should represent one business measure.
Clear ownership prevents that problem before it spreads across dashboards and departments.
6.1 ERP Analytics vs BI Should Not Create Two Versions of One Metric
Consider inventory turnover.
Finance may calculate average inventory from month-end accounting balances. Operations might use daily inventory snapshots, while BI applies a rolling average.
Each method can answer a legitimate question, but the results do not represent exactly the same metric.
The organization needs to document the approved definition, source system, formula, filters, timing rules, currency treatment, owner, and refresh expectation for every material KPI.
After teams agree on the definition, they can choose the appropriate system to calculate or govern it.
| KPI | Primary Home | Reason |
|---|---|---|
| Available inventory | ERP | Depends on current inventory transactions |
| Open purchase orders | ERP | Supports direct purchasing workflows |
| AR aging | ERP/accounting | Comes from financial records |
| Warehouse task status | ERP/WMS | Supports execution-level activity |
| Marketing acquisition cost | BI | Combines marketing and customer data |
| Customer lifetime value | BI | Requires long-term modeling |
| Enterprise profitability | Hybrid | Combines financial truth with broader dimensions |
This model does not force every metric into ERP.
Instead, it prevents multiple systems from quietly defining the same business fact in different ways.
6.2 Metric Ownership Matters More Than Dashboard Ownership
A dashboard can move. A KPI definition should not change every time it does.
For example, an executive may view gross margin inside ERP, through BI, and eventually through an AI interface. Those interfaces can differ without creating a problem if they rely on the same governed calculation.
This principle simplifies ERP analytics vs BI architecture. Teams do not have to insist that every user consume information from the same screen.
They need to ensure that important metrics trace back to an agreed definition and authoritative source.
7. Real-Time ERP Analytics and Historical BI Solve Different Problems
Data freshness often determines where analytics belong.
Not every dashboard needs real-time information.
A three-year profitability analysis rarely changes because data refreshes every five minutes. Marketing cohort reporting may work perfectly well with a daily update. Strategic planning also values consistency and comparability more than second-by-second freshness.
Operational decisions work differently.
Customer service cannot promise inventory confidently using information that is several hours old. Warehouse managers cannot control today’s workload from yesterday’s task status. Production teams need current material availability before releasing work.
The ERP analytics vs BI decision therefore requires a practical definition of “real time.”
If freshness changes the action, keep the metric close to the transactional system.
When analysis focuses on patterns rather than immediate execution, a scheduled BI refresh may provide everything the user needs.
7.1 Match Data Freshness to Decision Speed
Companies sometimes make every dashboard real time because the capability sounds valuable.
That choice can increase infrastructure cost without improving decisions.
Instead, identify events that genuinely require immediate visibility. Inventory allocations, blocked orders, warehouse exceptions, production shortages, available cash, credit holds, and urgent purchasing signals often qualify.
A board-level trend chart usually does not.
Matching data freshness to decision speed creates a more efficient reporting architecture.
8. ERP Analytics for Inventory-Driven Businesses Need More Context
Physical-product businesses experience the ERP-versus-BI boundary more sharply because their numbers reflect real inventory movements.
Customer orders immediately affect demand, while receipts increase available supply. Transfers change inventory availability by location, and production activity consumes components while creating finished goods.
Together, these transactions continually reshape the operational picture.
ERP analytics need to capture that chain accurately so users can make decisions from current inventory and transaction data.
8.1 Ecommerce Analytics Must Extend Beyond Storefront Sales
An ecommerce platform makes sales reporting easy. It does not automatically answer the operational questions behind those sales.
Can the company fulfill all open orders? Which warehouse should ship them? How much inventory has already been committed? When should buyers reorder? Are Shopify, Amazon, wholesale, and retail channels competing for the same stock?
Those questions require ERP context.
For merchants evaluating how Shopify connects to back-office operations, the Xorosoft ERP Shopify App Store listing provides additional context around ERP and ecommerce integration.
A BI layer can later analyze customer cohorts, advertising efficiency, long-term channel trends, or customer profitability. Daily inventory and fulfillment decisions should remain closer to ERP.
8.2 Wholesale Analytics Need Customer and Supply Context
Wholesale operations introduce customer-specific pricing, allocations, larger orders, EDI activity, supplier lead times, purchasing commitments, and multi-location inventory.
A revenue dashboard does not explain whether the business can fulfill future demand.
Useful wholesale analytics connect customer demand with available and expected supply.
Requirements also change significantly by industry. Apparel businesses manage style, size, and color variants. Furniture distributors handle bulky inventory and longer lead times. Food businesses care about lots, expiration, and traceability. Manufacturers manage BOMs, work orders, and material availability.
The Xorosoft industries section provides additional context on how ERP requirements differ across inventory-driven business models.
8.3 Multi-Warehouse Reporting Needs One Operational Inventory View
Multiple warehouses introduce another layer of complexity.
A company may have inventory on hand yet still be unable to fulfill an order from the correct location. Stock can be available, allocated, in transit, awaiting receiving, under inspection, or reserved for another channel.
Operational reporting needs to distinguish those states.
BI remains useful for network analysis, regional comparisons, warehouse benchmarking, and long-term capacity planning. Current inventory availability, however, should come from the system responsible for the underlying inventory movements.
8.4 Manufacturing Analytics Must Connect Materials, Production, and Cost
Manufacturing reporting breaks down when production data sits apart from purchasing, inventory, and finance.
Production managers need material availability. Purchasing teams need future demand, while finance requires accurate production and inventory costs. Leadership wants output, profitability, and delivery performance.
These requirements connect to the same operating process.
BI can extend analysis across product families, facilities, time periods, and strategic scenarios. ERP should still provide the transactional foundation underneath those models.
9. AI Is Changing ERP Analytics vs BI Architecture
AI introduces another way for users to consume business information.
Traditional ERP reporting asks users to open a report. BI encourages them to explore a dashboard or analytical model. Conversational AI allows users to ask a business question directly.
A manager might ask which products face the highest inventory risk, which purchase orders threaten fulfillment, what caused a decline in margin, or where excess inventory currently sits.
The interface changes. The governance requirement does not.
9.1 AI Analytics Still Need Governed ERP Data
AI should not invent another version of revenue, available inventory, inventory turnover, or gross margin.
A reliable AI layer needs permission-aware access to trusted information and clear business definitions underneath it. Users also need a path back to source records when an answer drives a material decision.
The Xorosoft AI MCP Server represents one approach to connecting authorized ERP information with compatible AI interfaces so users can query operational data conversationally.
AI therefore adds another layer to the ERP analytics vs BI architecture rather than eliminating the decision.
Companies still need to decide which system owns inventory, finance, purchasing, warehouse, customer, and manufacturing facts before AI can answer questions reliably.
10. Common Mistakes When Combining ERP Analytics and BI Tools
Most analytics problems do not begin with dashboards. They begin with unclear system boundaries.
Organizations can prevent many reporting failures by identifying the architectural mistakes that create duplicate logic and unreliable numbers.
10.1 Rebuilding ERP Business Logic Inside Every BI Dashboard
A company may spend years refining rules for landed cost, inventory allocation, customer pricing, order status, or available-to-promise inventory inside ERP.
Rebuilding those calculations independently in BI creates unnecessary risk.
If ERP already owns the business rule, reuse that governed result wherever practical. BI should extend analytical capability rather than casually reinterpret core operational transactions.
10.2 Turning Spreadsheets Into Permanent Reporting Infrastructure
Spreadsheets remain valuable for ad hoc analysis, modeling, and investigation.
Problems emerge when recurring reporting depends on employees exporting several files, copying data between worksheets, correcting formulas, and emailing different versions around the company.
At that point, the spreadsheet has become an unofficial integration and reporting platform.
The objective is not to eliminate Excel. Companies should simply avoid relying on spreadsheets as the only place where important business logic exists.
10.3 Buying BI Before Fixing ERP Data
A BI project cannot correct poor operational discipline.
Duplicate items, inconsistent units of measure, incomplete purchase orders, missing warehouse transactions, outdated costs, and uncontrolled adjustments will all flow into the analytical layer.
A better dashboard merely makes poor source data easier to see.
Before expanding BI, improve the processes that create ERP data.
10.4 Moving Every Operational Report Outside ERP
Another common mistake is assuming that every report becomes more sophisticated when it moves into BI.
Warehouse supervisors should not leave their operational system to find out what still needs to ship. Buyers should not depend on a separate BI refresh to identify a shortage that ERP already knows exists.
Place reporting where users make the decision.
10.5 Measuring Too Much and Managing Too Little
Analytics programs often produce more KPIs than the organization can use effectively.
Every dashboard creates another maintenance obligation, while an excessive number of metrics can make it harder for teams to distinguish operational signals from background noise.
A stronger approach focuses on a smaller set of measures tied directly to decisions, ownership, and action.
The best ERP analytics vs BI architecture does not maximize reporting volume. It increases confidence in the information people actually use.
10.6 Treating Visualization as a Data-Governance Strategy
A polished dashboard does not guarantee a reliable metric.
Teams sometimes spend significant effort improving charts while leaving source definitions unresolved. If departments disagree on what revenue, fill rate, gross margin, or available inventory means, visualization cannot settle the disagreement.
Resolve the business definition first. Then choose the most useful interface for the audience.
11. When ERP Analytics Are Enough—and When BI Becomes Necessary
A practical ERP analytics vs BI strategy starts with the questions users need to answer.
If most questions concern current inventory, orders, purchasing, warehouse activity, manufacturing, accounting, and cash, strong ERP analytics may cover a large share of the reporting requirement.
When executives repeatedly ask questions that combine CRM, marketing, ecommerce, customer-success, external, and ERP data, BI adds more value.
11.1 ERP Analytics vs BI: Five Questions That Clarify the Decision
Start with the action. If the answer leads directly to creating, approving, receiving, shipping, transferring, producing, invoicing, or paying something in ERP, keep the analytics close to ERP.
Next, consider freshness. Current transactional data generally favors ERP.
Then examine the source systems. A calculation that needs several independent applications becomes a stronger candidate for BI.
Historical complexity also matters. Long-term snapshots, sophisticated segmentation, enterprise dimensions, and analytical modeling often justify BI or a dedicated data platform.
Finally, consider drilldown. When managers frequently move from a KPI into an order, invoice, item, receipt, shipment, purchase order, or work order, native ERP analytics provide a clear usability advantage.
11.2 Evaluate ERP Reporting With Real Business Scenarios
ERP buyers often focus too heavily on dashboard screenshots.
That approach misses the more important questions.
During evaluation, ask a vendor to show what happens when inventory is split across multiple warehouses, when an item has both open demand and incoming supply, when finance needs to explain a change in margin, or when a manager must trace a KPI to its source transaction.
Also test how the ERP connects to external analytics if BI becomes necessary later.
Organizations comparing larger ERP platforms and alternatives can use the Xorosoft vs NetSuite comparison as one reference point, but the final evaluation should follow the company’s actual workflows and reporting requirements rather than a generic feature checklist.
11.3 Who May Not Need a Dedicated BI Platform Yet?
Not every growing business needs standalone BI immediately.
A company may be well served by native ERP analytics when most important information originates in ERP, reporting needs remain relatively standardized, and operational users make most decisions from current transaction data.
Introducing BI too early can create extra licensing, administration, training, and reconciliation work.
The right time to add BI arrives when business questions outgrow the reporting boundaries of the operational system—not simply when a company reaches a particular revenue or employee count.
12. Build the ERP Reporting and BI Operating Model First
Software alone does not create reliable analytics. A strong reporting environment also needs clear ownership, governance, and operating rules.
Start by identifying which system owns each important business fact and who approves changes to KPI definitions. From there, separate operational reporting from enterprise analytics and assign an appropriate refresh frequency to each type of information.
The reporting team should also document how BI receives ERP data and how users can reconcile analytical results back to the original transactions.
Without those controls, every additional reporting tool can create another version of the truth.
12.1 Test the Model Against Weekly Operating Decisions
Choose a small number of decisions that matter every week.
An ecommerce business may focus on available inventory, purchasing requirements, fulfillment exceptions, channel margin, and cash. A wholesaler may prioritize allocations, backorders, supplier performance, inventory turnover, and customer profitability.
Manufacturers might focus on material shortages, production status, future purchasing, output, and finished-goods availability.
12.2 Map Each Reporting Decision to Its Data Owner
Instead of starting with a long feature checklist, map each decision to its source data and operational owner.
Reviewing real Xorosoft case studies can help teams understand how ERP requirements appear in actual inventory-driven operating environments.
Companies mapping broader requirements across inventory, accounting, warehouse management, purchasing, manufacturing, ecommerce, and related functions can also review the available Xorosoft solutions as part of the requirements process.
The objective is not to force every report into one system. It is to create clear boundaries before adding more technology.
12.3 Give Every Critical KPI an Owner
Technology ownership and metric ownership are different.
IT may manage the BI platform, but finance should still own the definition of financial metrics. Operations may manage warehouse dashboards while inventory leadership controls the definition of available stock or fulfillment performance.
This accountability helps prevent silent changes to business logic.
When a KPI changes, teams should understand why it changed, who approved the new definition, and which reports need updating.
That discipline becomes increasingly important as ERP analytics vs BI environments grow more complex.
13. Put ERP Analytics Where Operational Decisions Happen
The practical takeaway from ERP analytics vs BI is straightforward. Operational analytics should stay close to ERP when users need current transactions, workflow context, and immediate action.
Inventory availability, purchasing requirements, warehouse exceptions, open orders, receivables, and production status become more useful when employees can move directly from a KPI to the transaction behind it.
Broader analysis belongs in BI when the question extends across systems, historical models, external datasets, or specialized analytical requirements.
13.1 Use a Hybrid ERP and BI Model When Both Add Value
Many growing companies eventually need both environments.
ERP can serve operational teams that depend on current inventory, orders, purchasing, manufacturing, warehouse activity, and financial transactions. BI can support analysts and executives who need cross-system reporting, historical modeling, and broader strategic analysis.
A hybrid model works well when each platform has a clearly defined responsibility. Problems begin when teams recreate the same business logic independently in ERP, BI, spreadsheets, and executive dashboards.
Instead of choosing one tool for every reporting requirement, assign each analytical workload to the system best suited to handle it.
13.2 Keep One Governed Definition for Every Critical KPI
Governance remains more important than the number of dashboards available.
Finance should not calculate one version of margin while BI presents another. Likewise, inventory availability should not depend on which dashboard someone opens.
When different departments maintain separate formulas, managers spend more time reconciling numbers than making decisions.
A stronger model gives every critical KPI a documented definition, an authoritative source, and a clear business owner.
Users can still view the metric through ERP, BI, spreadsheets, or AI interfaces. However, each interface should rely on the same approved logic wherever possible.
That consistency builds confidence because employees understand where the number came from and what action should follow.
13.3 Map System Boundaries Before Adding Another Dashboard
For inventory-driven businesses, fragmented reporting often signals a deeper systems problem.
A company may already be reconciling accounting, ecommerce, inventory, purchasing, warehouse, manufacturing, and reporting information across several disconnected applications.
Adding another BI dashboard may improve presentation without fixing the underlying fragmentation.
Start by mapping the systems that own each operational process.
Determine which facts should remain inside ERP, which analytical workloads deserve BI, and which measures require shared governance between the two environments.
Then evaluate whether the current technology stack can support that model reliably.
This approach produces a more durable reporting architecture than simply moving every dataset into another visualization platform.
If fragmented systems make it difficult to establish a reliable boundary between ERP analytics and BI, contact Xorosoft to evaluate how inventory, finance, warehouse, purchasing, manufacturing, ecommerce, and reporting could operate within a more unified model.
Frequently Asked Questions About ERP Analytics vs BI
What is the difference between ERP analytics and BI tools?
ERP analytics primarily support operational decisions using information generated by ERP transactions, including inventory, purchasing, sales orders, accounting, warehouse activity, and manufacturing.
BI tools support broader analytical work. They become particularly valuable when companies need multiple data sources, complex historical analysis, custom models, specialized calculations, or highly customized executive reporting.
What analytics should live inside an ERP?
Analytics that support immediate operational action should generally remain inside or close to ERP.
Common examples include inventory availability, open sales orders, purchasing requirements, receivables, payables, inventory valuation, warehouse exceptions, production status, and material shortages.
Keeping these analytics close to ERP also gives users easier access to the transactions behind each metric.
When should a company use BI with its ERP?
A company should add BI when analysis requires data from several systems, complex historical models, enterprise-wide KPI definitions, advanced calculations, or highly customized management reporting.
BI works best when it extends reliable ERP information instead of simply copying the same operational reports into another dashboard platform.
Can Power BI replace ERP reporting?
Power BI can replace or extend some ERP reporting, especially for sophisticated visualization, cross-system analysis, historical modeling, and executive dashboards.
However, it should not automatically replace reports where employees need live ERP transactions, operational context, or direct drilldown into orders, invoices, purchase orders, inventory movements, warehouse tasks, and production records.
Should ERP be the single source of truth for analytics?
ERP should normally act as the authoritative source for the transactions it owns, but it does not need to contain every data source used for analytics.
A better principle is to maintain one authoritative source for each important business fact. BI can combine ERP information with other systems while preserving governed definitions for inventory, revenue, margin, purchasing, and other critical metrics.
Do Small and Mid-Sized Businesses Need Separate BI Software?
Not always.
A company with one primary ERP, straightforward workflows, manageable historical requirements, and reliable native reporting may gain little from adding another analytics platform.
Dedicated BI becomes more valuable as the number of systems, data sources, analytical users, historical requirements, and executive reporting needs increase.
Search
Categories
- Accounting & QuickBooks 227
- AI & Automation 585
- E-commerce & Marketplaces 1,202
- EDI & B2B 150
- ERP 573
- ERP Selection & Comparisons 166
- Industries 230
- Integrations 138
- Shopify ERP 138
- Inventory Management 1,206
- Order Management & Fulfillment 578
- Procurement & Supply Chain 9
- Procurement, Purchasing & Reordering 417
- Resources 250
- Shopify 649
- Solutions 606
- Warehouse & WMS 1,078
Recent Posts
-
 ERP Landed Cost Module vs Spreadsheet Calculations for Importers
 -
 How to Build an Open-to-Buy Plan for an Omnichannel Brand
 -
 Cold Storage WMS for Food and Beverage Distribution
 -
 ERP Buying Statistics 2026: Evaluation, Implementation, and Adoption Risks
 -
 How a Distributor Reduced B2B Order Exceptions Without Restricting Sales