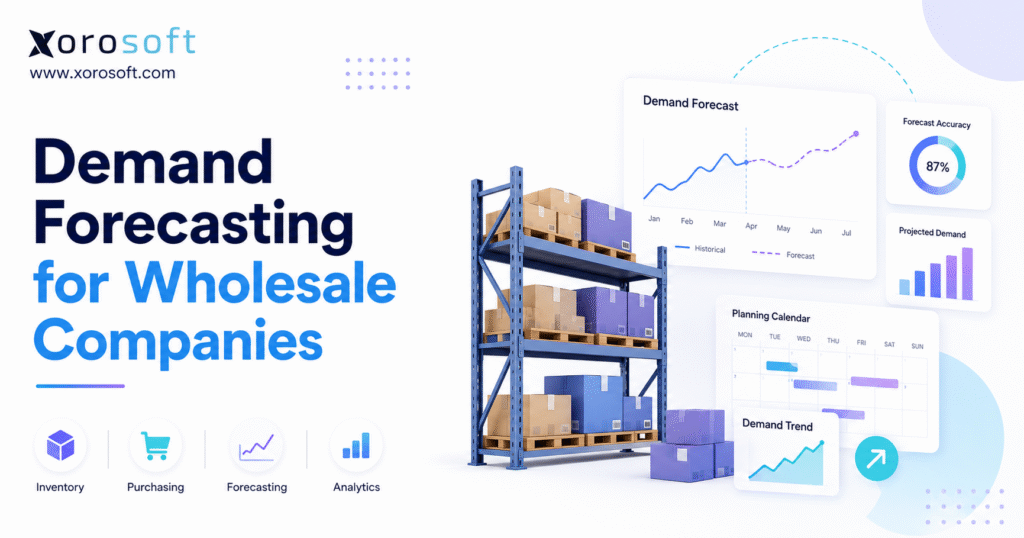
Demand forecasting for wholesale companies is a critical aspect of running a successful business in this sector.
1. Wholesale Growth Exposes Weak Forecasting Processes
Wholesale companies rarely struggle because nobody is trying to predict demand. Instead, forecasting usually breaks because different teams manage customer orders, supplier lead times, inventory balances, purchase orders, and warehouse activity in separate systems.
As the business expands, those gaps become increasingly expensive. For example, sales may expect a strong quarter, yet purchasing may not know which SKUs will create that growth. Likewise, buyers may order enough inventory overall, but the products may arrive at the wrong warehouse.
Demand forecasting for wholesale companies must therefore do more than estimate future revenue. It must provide enough operational detail to guide purchasing, safety stock, supplier commitments, warehouse allocation, and cash-flow planning.
1.1 The Operational Cost of an Unreliable Forecast
Underforecasting creates stockouts, backorders, emergency purchase orders, supplier-expediting costs, and missed customer commitments. Moreover, it can force warehouse teams to make costly transfers between locations.
Overforecasting creates the opposite problem. As a result, cash becomes trapped in slow-moving inventory, warehouse space fills with products that are not selling, and markdown risk increases.
Consequently, both outcomes weaken profitability. Finance loses visibility into future cash requirements, purchasing becomes reactive, and sales teams become less confident about promised delivery dates.
1.2 Why Revenue Forecasts Do Not Solve Inventory Problems
A revenue forecast may show that the business expects strong sales next month. However, that number does not tell buyers which products customers will purchase, how many units will be required, or which warehouse should hold the stock.
Therefore, wholesale inventory planning requires product-level and location-level detail. Without that detail, a promising sales forecast cannot become an effective purchasing plan.
In addition, a revenue forecast rarely explains supplier timing. As a result, buyers may recognize growth but still release orders too late.
1.3 What an Effective Wholesale Forecast Should Deliver
A reliable process should estimate demand by SKU, customer, channel, and warehouse. It should also identify seasonal patterns, separate recurring demand from one-time orders, and account for supplier lead times.
Moreover, it should help calculate purchase requirements, establish safety stock, and allocate inventory between locations. Finally, it should measure forecast error and bias so the business can improve over time.
2. What Demand Forecasting for Wholesale Companies Means
Demand forecasting for wholesale companies is the process of estimating the quantity and timing of future customer demand. It uses historical transactions, current orders, customer information, seasonal patterns, sales input, and other relevant signals.
However, forecasting becomes useful only when it connects to operational planning. The forecast should eventually influence what the company purchases, where inventory is stored, and how products are allocated between customers and channels.
2.1 Wholesale Demand Forecasting Versus Demand Planning
Demand forecasting and demand planning are closely connected, although they serve different purposes.
| Demand forecasting | Demand planning |
|---|---|
| Predicts future customer requirements | Determines how the business will meet demand |
| Produces expected product quantities | Produces purchasing and allocation decisions |
| Uses historical and external signals | Adds inventory, supplier, capacity, and financial constraints |
| Measures forecast accuracy | Measures availability and operational execution |
In simple terms, forecasting answers, “What are customers likely to buy?” Demand planning, on the other hand, answers, “What should the company purchase, produce, transfer, or reserve to meet that demand?”
Therefore, the forecast is only the starting point. The planning process turns that forecast into operational action.
2.2 Demand Forecasting Versus Sales Forecasting
Sales forecasts often focus on expected revenue, territories, sales representatives, or account targets. In contrast, demand forecasts focus on product quantities, timing, channels, and locations.
For example, a business may expect revenue to increase by 15%. Nevertheless, that information alone does not explain which SKUs will create the increase.
Therefore, purchasing teams require unit-level demand, while warehouse teams need location-level requirements. Finance may focus on value, but operations must plan physical products.
2.3 Demand Forecasting Versus Inventory Planning
Inventory planning uses the demand forecast as one input. In addition, it considers available inventory, allocated stock, backorders, incoming purchase orders, supplier lead times, minimum order quantities, pack sizes, safety-stock policies, warehouse capacity, and target service levels.
A forecast may be statistically accurate while the inventory plan remains poor. This usually happens because the planning process excludes important operational constraints.
Consequently, the company should evaluate forecast quality and planning quality separately. A good forecast can still produce a bad purchase decision when the surrounding data is incomplete.
3. Why Demand Forecasting for Wholesale Companies Requires a Different Approach
Demand forecasting for wholesale companies is more complex than forecasting steady consumer demand. Wholesale orders may be larger, less frequent, and heavily influenced by a relatively small group of customers.
For instance, a single account can create a substantial increase in one month and then return to its usual buying pattern. Meanwhile, some customers submit scheduled EDI orders, while others purchase according to projects, seasonal programs, or retailer promotions.
Therefore, wholesalers cannot rely only on broad averages. Instead, they must understand the source, timing, and repeatability of demand.
3.1 Large Orders Can Distort Demand History
Suppose a distributor normally sells 200 units of a product each month. A customer then places a one-time order for 1,500 units.
A simple moving average may interpret that transaction as permanent growth. As a result, the next purchase recommendation could be much higher than the company actually needs.
Therefore, planners should tag unusual orders and decide whether similar demand is likely to recur. Historical transactions should remain visible; however, exceptional demand should not automatically become part of the recurring baseline.
3.2 Supplier Constraints Change the Forecasting Decision
A product with a five-day replenishment time requires a different planning approach from a product with a five-month lead time. Long lead times require earlier commitments.
In addition, supplier minimums, container quantities, production schedules, and shipping delays may force the business to order more than the immediate forecast requires. Consequently, the company must balance expected demand with supplier economics.
Wholesale demand planning must therefore consider both customer demand and supplier execution. Otherwise, a mathematically sound forecast may still produce an impractical purchasing plan.
3.3 Multiple Sales Channels Create Competing Demand
Wholesale companies increasingly sell through traditional accounts, Shopify, Amazon, EDI, sales representatives, direct-to-consumer channels, and marketplaces. Each channel may follow a different pattern.
Therefore, combining all transactions into one total can hide meaningful changes. For instance, ecommerce demand may grow steadily while traditional account demand declines.
As a result, a channel-level forecast reveals changes before they create purchasing or allocation problems. Likewise, it helps management understand which channels are driving inventory risk.
4. Building Reliable Data for Wholesale Demand Forecasting
The quality of a forecast depends heavily on the quality of its inputs. Advanced algorithms cannot compensate for inaccurate inventory, missing transactions, unreliable lead times, or inconsistent product records.
Therefore, before selecting software, wholesalers should define which transaction represents actual demand and how unusual events will be treated. In addition, they should identify who owns each critical data field.
4.1 Historical Orders, Shipments, and Invoices
Orders show what customers requested. Shipments show what the company supplied. Invoices show what the business billed.
These records may be similar when inventory is consistently available. However, they can differ considerably during stockouts, partial shipments, or cancellations.
For example, a company using shipment history alone may underestimate demand because unfulfilled quantities never appear as completed shipments. Consequently, planners should compare orders, shipments, and lost-demand indicators.
4.2 Open Sales Orders and Backorders
Open orders represent known future requirements. Likewise, backorders show demand that has already occurred but has not yet been fulfilled.
Both should be included carefully. If an open order is added to a forecast that already contains the same expected demand, the company may count it twice.
Therefore, clear forecast-consumption rules are necessary. Planning teams should use these rules to determine how open demand replaces or supplements the statistical forecast.
4.3 Lost Sales and Stockout Periods
Recorded sales can fall during a stockout even when customer demand remains strong. Consequently, low sales during these periods should not automatically reduce future forecasts.
Useful lost-demand signals include cancelled order lines, rejected quantities, backorders, product substitutions, customer-service requests, abandoned ecommerce orders, and sales-team notes.
Although these records may be imperfect, they provide a more realistic picture than shipment history alone. Moreover, even partial lost-demand information can improve planning decisions.
4.4 Current Inventory and Incoming Supply
Planners should compare the forecast with the complete inventory position. That position includes on-hand inventory, allocated stock, available-to-promise quantities, damaged or quarantined products, goods in transit, confirmed purchase orders, planned transfers, expected production, and customer returns.
Otherwise, the company may place duplicate purchase orders or overlook future shortages. In addition, inventory status must remain current enough to support purchasing decisions.
Therefore, inventory accuracy is not a separate warehouse issue. It is a core forecasting requirement.
4.5 Supplier Lead Times and Reliability
Planning should use actual supplier performance rather than relying only on quoted lead times. For example, a supplier may quote 30 days but regularly deliver in 45.
Another supplier may deliver most orders on time yet occasionally experience major delays. Therefore, planners should include both average lead time and lead-time variability in the forecast.
Products with unreliable supply may require earlier ordering, alternative sources, or additional safety stock. As a result, supplier performance data should be reviewed alongside forecast accuracy.
4.6 Promotions, Seasonality, and External Events
Promotions, holidays, weather, product launches, and industry events can temporarily change demand. Planners should therefore tag these periods so they can compare promoted sales with the normal baseline.
Otherwise, a temporary spike may inflate future forecasts long after the event has ended. Similarly, planners should document external events clearly.
Without that context, future planners may mistake an exceptional period for a recurring pattern. Consequently, event tagging should become part of the regular planning process.
5. Segmenting Demand to Improve Wholesale Forecast Accuracy
Applying the same forecasting method and inventory policy to every product creates unnecessary work and weak results. High-value stable products deserve different treatment from low-value items that sell once every few months.
Therefore, segmentation allows planners to focus attention where forecasting errors create the greatest financial impact. It also makes automation more practical.
5.1 SKU-Level Inventory Forecasting
SKU-level forecasting provides the detail required for purchasing. However, individual SKU histories may be noisy, particularly when demand is intermittent.
For that reason, planners should compare SKU forecasts with category, customer, and channel-level trends. A product forecast that contradicts the wider business pattern may require additional review.
Moreover, planners should avoid spending equal time on every item. Instead, they should focus on products where errors create meaningful inventory or service risk.
5.2 Customer-Level Wholesale Forecasting
Customer-level forecasts become especially valuable when a small group of accounts creates a large share of total demand. They can reveal contracted requirements, planned promotions, customer launches, seasonal programs, lost accounts, project orders, and customer-specific risks.
Nevertheless, customer forecasts should also be measured. Some customers consistently provide useful estimates, while others submit optimistic plans that rarely convert into orders.
Therefore, customer input should influence the forecast without automatically replacing historical evidence. In addition, account-level accuracy should be reviewed over time.
5.3 Channel and Warehouse Forecasting
Forecasting by channel helps the company understand whether demand is coming from wholesale, Shopify, Amazon, EDI, or direct sales. Similarly, warehouse-level forecasting shows where inventory will be required.
This prevents a situation where the business owns enough stock overall but cannot fulfill orders from the correct location. As a result, planners can distinguish a purchasing problem from an allocation problem.
Sometimes the company needs more inventory; however, in other cases, it simply needs inventory in a different place. Therefore, location and channel detail can change the recommended action.
5.4 ABC and XYZ Inventory Segmentation
ABC analysis groups products according to commercial importance:
- A items: High sales value, margin, or strategic importance
- B items: Moderate importance
- C items: Lower individual contribution
XYZ analysis groups products according to demand predictability:
- X items: Stable and consistent demand
- Y items: Variable or seasonal demand
- Z items: Irregular or intermittent demand
Together, these classifications create a practical planning framework.
| Segment | Recommended approach |
| AX | Frequent review and high availability |
| AY | Seasonal forecasting with close monitoring |
| AZ | Customer input and manual review |
| BX | Automated baseline with periodic review |
| BY | Seasonal or causal adjustments |
| BZ | Conservative stocking and exception review |
| CX | Simple replenishment rules |
| CY | Limited seasonal inventory |
| CZ | Order-driven or minimal-stock policy |
Consequently, planners can apply more effort where the financial and service consequences are highest. Meanwhile, lower-risk items can follow simpler rules.
6. Demand Forecasting Methods for Wholesale Companies
Demand forecasting for wholesale companies should not rely on one formula for every SKU. Instead, the method should reflect demand stability, seasonality, lifecycle stage, available history, and the operational cost of being wrong.
Moreover, wholesalers should begin with simple, explainable models. More complex methods should be introduced only when they consistently improve decisions.
6.1 Qualitative Forecasting for New or Changing Demand
Qualitative forecasting relies on informed judgment rather than historical calculations alone. It is useful when launching a new product, entering a new market, preparing for a customer program, responding to regulatory changes, managing products with limited history, or evaluating a market disruption.
Sales teams, customers, suppliers, and product managers can provide valuable information. However, each override should include a documented reason, owner, and review date.
Otherwise, temporary opinions can become permanent inventory commitments. Therefore, qualitative input should remain controlled and measurable.
6.2 Moving-Average Forecasting
A moving average calculates average demand across a selected number of recent periods. For example, a three-month moving average uses the previous three months to estimate the next month.
This method is easy to understand and works reasonably well for stable products. However, it reacts slowly when demand changes rapidly.
Therefore, planners should avoid using it blindly for products with clear trends or abrupt market changes. In addition, unusual orders should be adjusted before the average is calculated.
6.3 Weighted Moving Averages
A weighted moving average gives greater importance to recent periods. As a result, it may adapt more quickly than a standard moving average.
Nevertheless, it can also overreact to one unusual order. Therefore, the weighting structure should reflect actual demand behavior.
In addition, exceptional transactions should be reviewed before they receive extra weight. Otherwise, the forecast may chase short-term noise.
6.4 Exponential Smoothing
Exponential smoothing updates the previous forecast by using recent actual demand. More recent observations receive greater importance.
Different versions can account for stable demand, trends, seasonality, or trends and seasonality together. Because it balances simplicity with flexibility, many inventory planners use exponential smoothing.
However, planners should still validate parameter settings against actual forecast performance. Therefore, the company should compare model results rather than relying on default settings.
6.5 Seasonal Wholesale Demand Forecasting
Seasonal forecasting identifies patterns that repeat at regular intervals. Common examples include apparel collections, holiday products, outdoor sporting goods, school supplies, food programs, furniture promotions, and weather-sensitive products.
However, recurring seasonality should be separated from one-time promotions or unusual market events. Otherwise, future seasonal forecasts may become permanently inflated.
Therefore, planners should review event tags and seasonal indexes together. In addition, planners should compare the current season with prior years rather than assume every cycle behaves identically.
6.6 Causal Demand Forecasting
Causal forecasting links demand with variables that may influence it. Possible variables include pricing, promotions, advertising, housing activity, construction levels, weather, customer store openings, economic indicators, and industry events.
Nevertheless, a causal model is useful only when a logical relationship exists and enough historical examples are available. Therefore, businesses should avoid adding external variables merely because the data exists.
Moreover, relationships can change over time. As a result, planners should monitor and recalibrate causal models.
6.7 Intermittent-Demand Forecasting
Intermittent demand includes many periods with no sales, followed by occasional orders. Traditional averages can perform poorly because they treat zero-demand periods as ordinary observations.
Instead, intermittent-demand methods estimate both the likely order size and the interval between orders. These approaches are particularly useful for spare parts, specialized industrial products, and slow-moving wholesale inventory.
However, stocking policy should also reflect margin, customer importance, and supplier lead time. Therefore, the forecast should support a broader inventory policy rather than operate alone.
6.8 AI-Supported Forecasting
Machine-learning models can evaluate numerous demand signals and complex relationships. Therefore, they may help companies with large datasets, extensive SKU ranges, and multiple demand drivers.
However, AI still depends on accurate transaction data, clean product records, reliable inventory balances, consistent warehouse mappings, documented promotions, and usable supplier lead times.
In other words, automating unreliable data makes the problem faster, not better. Moreover, human review remains important for customer events, supplier risks, product changes, and strategic decisions that do not exist in historical data.
6.9 Selecting the Right Forecasting Method
| Demand pattern | Suitable starting method |
| Stable and regular demand | Moving average or exponential smoothing |
| Strong seasonal demand | Seasonal smoothing or decomposition |
| Clear growth or decline | Trend-adjusted forecasting |
| Irregular and sparse demand | Intermittent-demand method |
| New product | Similar-product analogy and qualitative input |
| Promotion-driven demand | Event-adjusted or causal method |
| Large, complex dataset | Automated model selection or machine learning |
Ultimately, the best method is not necessarily the most advanced. Instead, it is the method that creates a reliable baseline and supports better operational decisions.
Therefore, planners should compare every model with a simple benchmark. If a complex method does not improve results, it may not justify the added maintenance.
7. A Demand Forecasting Process for Wholesale Companies
A disciplined process matters more than a sophisticated formula. Therefore, demand forecasting for wholesale companies should follow a repeatable sequence that connects data, planning, and execution.
7.1 Define the Forecasting Objective
First, clarify which decision the forecast must support. Possible objectives include purchase planning, supplier commitments, warehouse replenishment, cash-flow planning, production planning, inventory allocation, and budgeting.
Different objectives require different levels of detail and planning horizons. Consequently, the business should not create one forecast and assume it serves every purpose equally well.
7.2 Choose the Forecast Level
Next, decide whether the forecast should be created by SKU, product category, customer, channel, region, warehouse, supplier, or a combination of these levels.
Purchasing usually requires SKU-level detail. Meanwhile, management may also need category and financial views.
Therefore, the company should define how detailed operational forecasts will roll up into higher-level plans. In addition, the hierarchy should remain consistent across reports.
7.3 Select the Planning Horizon
The forecast should extend beyond the longest relevant supplier lead time. A company purchasing locally may use a shorter horizon.
In contrast, a wholesaler sourcing overseas may need to commit inventory several months in advance. Additionally, the horizon should match the decision.
Near-term purchasing may require weekly detail, while strategic supplier planning may use monthly or quarterly periods. Therefore, several time horizons may exist within the same process.
7.4 Collect and Standardize Data
Create consistent structures for products, customers, suppliers, warehouses, channels, transaction dates, and units of measure. Additionally, the planning team should correct duplicate SKUs, inactive products, and inconsistent units before forecasting begins.
Otherwise, the forecasting model may interpret the same product as several different items. Consequently, master-data cleanup should occur before advanced modeling.
7.5 Clean Unusual Demand Events
Identify stockout periods, project orders, promotions, product launches, returns, data-entry errors, customer losses, and temporary substitutions.
However, do not erase original transactions. Instead, store the reason for each adjustment so the forecast remains auditable.
As a result, future planners can understand why the baseline differs from raw history. Moreover, the company can measure how often adjustments improve the result.
7.6 Segment Products and Customers
Use value, demand variability, lifecycle, margin, lead time, and customer importance to determine which items require detailed review.
Stable, low-risk products may be automated. Conversely, high-value irregular items may need regular planner involvement.
Therefore, segmentation helps the team manage a large catalog without treating every item as equally important. In addition, it supports different service and safety-stock policies.
7.7 Generate a Baseline Forecast
Test several suitable methods and compare them with a simple benchmark. A complex model should not be accepted merely because it fits historical data.
Instead, it should also perform well on periods that were not used to build the model. Moreover, planners should keep the baseline visible even after manual adjustments.
This allows the business to measure whether overrides add value. Consequently, planner judgment can be improved rather than accepted without evidence.
7.8 Add Commercial and Supplier Intelligence
Allow sales, purchasing, marketing, and management to submit adjustments. Useful inputs include new customer programs, lost accounts, planned promotions, supplier delays, product discontinuations, price changes, and market events.
Nevertheless, overrides should remain measurable. Over time, the company should know whether manual changes improve or weaken forecast accuracy.
Therefore, every material override should include a reason code and owner. In addition, temporary overrides should expire automatically when the event ends.
7.9 Review Material Exceptions
Planners should focus on material exceptions rather than manually reviewing every product. Important exceptions include large forecast changes, unexpected demand declines, high stockout risk, excess inventory exposure, unusual customer orders, supplier delays, negative inventory, and high-value purchase requirements.
Consequently, the team spends time on decisions that can materially affect service or working capital. Meanwhile, stable low-risk items can continue through automated rules.
7.10 Convert Forecasts Into Purchasing Actions
Translate expected demand into recommended purchase quantities and required order dates. The calculation should consider available inventory, incoming supply, safety stock, supplier minimums, pack sizes, and lead times.
Otherwise, the forecast remains informational rather than operational. Therefore, purchasing rules should be documented and visible to planners.
7.11 Measure Accuracy and Bias
Measure how far the forecast differed from actual demand. In addition, measure whether it consistently overestimated or underestimated requirements.
Accuracy without bias measurement can hide a systematic planning problem. For example, average error may appear acceptable even when forecasts are consistently too high.
Therefore, both error and direction should be reviewed. Moreover, the company should compare baseline accuracy with override accuracy.
7.12 Operate a Rolling Forecast
Finally, update the forecast regularly instead of rebuilding it once per year. Many wholesalers use weekly reviews for urgent exceptions, monthly forecast updates, quarterly strategic reviews, and annual budgeting as a separate financial process.
Because demand and supply conditions change, the forecast should remain a living plan. As a result, the business can react earlier when assumptions shift.
8. Converting Forecasts Into Purchasing Decisions
Demand forecasting for wholesale companies creates value only when predicted demand influences inventory and purchasing decisions.
8.1 Calculating Purchase Requirements
A practical starting formula is:
Purchase requirement = Forecast demand + Target safety stock − Available inventory − Confirmed incoming inventory
However, the complete calculation may also include allocated inventory, backorders, transfer orders, pack sizes, minimum order quantities, production orders, expected returns, and supplier calendars.
Therefore, buyers should use purchase recommendations as decision support rather than automatic orders in every situation. In addition, buyers should understand which assumptions created the recommendation.
8.2 Setting Reorder Points
A basic reorder point is:
Reorder point = Expected demand during lead time + Safety stock
The expected lead-time demand should reflect the item’s forecast rather than a general company average. Additionally, planners should review reorder points when demand patterns or supplier performance change.
Otherwise, an old reorder point may continue driving inappropriate purchases. Therefore, reorder settings should be reviewed as part of the forecasting cycle.
8.3 Determining Safety Stock
Safety stock protects the business from uncertainty in demand and supply. The required quantity depends on forecast error, supplier reliability, lead-time length, lead-time variability, target service level, product importance, substitution options, and stockout cost.
Therefore, using the same safety-stock percentage for every item is simple but rarely appropriate. Moreover, inventory planners should review safety stock whenever forecasts or supplier performance change.
8.4 Managing Supplier Minimums and Pack Sizes
Supplier minimums may force the company to purchase more inventory than the forecast requires. Consequently, buyers should compare the purchasing benefit with carrying cost, warehouse space, cash requirements, expiry risk, obsolescence risk, and expected future demand.
A lower unit price does not automatically make a larger purchase economical. Instead, buyers should consider total inventory exposure.
Therefore, the purchase decision should evaluate both unit economics and working-capital impact. In addition, buyers may need to negotiate alternative pack sizes or delivery schedules.
8.5 Scheduling Purchase Orders
Purchase recommendations should include both quantity and timing. Ordering too late creates shortages.
On the other hand, ordering too early increases inventory and cash exposure. Therefore, the recommended order date should reflect expected demand, safety stock, supplier lead time, and ordering schedules.
Moreover, order timing should account for holidays, factory shutdowns, and transportation constraints. As a result, purchasing teams should maintain planning calendars alongside lead-time records.
9. Multi-Warehouse and Multi-Channel Demand Planning
Company-wide inventory totals can create a false sense of security. The business may own enough stock overall while still facing shortages in individual warehouses or channels.
9.1 Forecasting by Warehouse
Each warehouse forecast should consider local demand, regional seasonality, fulfillment rules, transfer lead times, warehouse capacity, local service targets, incoming supply, and available transportation.
For example, suppose two warehouses each hold 100 units. The eastern location expects demand of 160 units, while the western location expects only 40.
Total inventory matches total expected demand. Nevertheless, the eastern warehouse still faces a shortage unless the business transfers stock or changes fulfillment rules.
Therefore, location-level planning is essential when inventory is distributed across several sites. In addition, planners should include transfer time in the replenishment lead time.
9.2 Allocating Inventory Between Channels
Wholesale, Shopify, Amazon, and direct sales may compete for the same inventory. Allocation policies should therefore consider contractual commitments, marketplace service requirements, channel margins, customer importance, expected replenishment, backorder policies, and fulfillment costs.
For Shopify-focused operations, the Xorosoft ERP app for Shopify shows how ecommerce activity can connect with broader inventory and operational workflows.
As a result, ecommerce demand can be evaluated alongside wholesale and marketplace requirements. Moreover, inventory reservations can reflect commercial priorities.
9.3 Planning Warehouse Transfers
A transfer may be faster than placing a new supplier order. However, it also creates handling and transportation costs.
Transfer recommendations should compare inventory availability, expected local demand, transfer cost, transfer time, new-purchase lead time, and customer priority.
A connected warehouse management system can provide the location-level visibility needed to execute these decisions consistently.
Therefore, the transfer decision should balance speed, cost, and future demand. Otherwise, one warehouse may be fixed by creating a shortage in another.
10. Measuring Demand Forecasting for Wholesale Companies
Measuring demand forecasting for wholesale companies requires more than one accuracy metric. Different products and demand patterns can make the same measurement behave very differently.
10.1 Mean Absolute Error
Mean Absolute Error measures the average absolute difference between forecast and actual demand. Because the result is expressed in units, buyers and inventory planners can interpret it easily.
However, unit-level error does not automatically show financial importance. Therefore, planners may also need value-based measures.
10.2 Mean Absolute Percentage Error
MAPE expresses forecast error as a percentage of actual demand. However, it works best when actual demand remains above zero.
It can become misleading for intermittent products and low-volume SKUs. Therefore, wholesalers should avoid relying on MAPE as the only measurement.
10.3 Weighted Absolute Percentage Error
WAPE divides total absolute forecast error by total actual demand. Therefore, it can provide a more practical portfolio-level view because larger-volume items receive appropriate weight.
Nevertheless, WAPE may still hide poor performance on strategically important low-volume items. Consequently, planners should review portfolio and item-level metrics together.
10.4 Root Mean Squared Error
RMSE gives additional weight to large forecast errors. It becomes useful when major misses create disproportionate operational costs, such as expensive shortages or excessive purchases.
However, because the result is more sensitive to large errors, planners should explain it carefully to operational teams. In addition, the measure should be compared with business impact.
10.5 Forecast Bias
Bias shows whether forecasts consistently run above or below actual demand. Persistent overforecasting may create excess inventory.
Conversely, persistent underforecasting may create shortages and emergency purchasing. Therefore, bias should be reviewed separately from total error.
Moreover, bias can reveal cultural behavior. For example, sales teams may consistently submit optimistic overrides.
10.6 Operational Metrics Beyond Forecast Accuracy
A statistically accurate forecast does not automatically create better operations. Therefore, wholesalers should also monitor fill rate, customer service level, stockout frequency, backorder volume, inventory turnover, days of inventory, purchase-order expedites, excess inventory, inventory age, and supplier performance.
The goal is not to optimize a forecasting metric in isolation. Instead, the business should improve customer availability and inventory economics together.
As a result, forecast reviews should include both statistical and operational measures. Otherwise, the team may celebrate accuracy while service or working capital deteriorates.
11. Common Wholesale Demand Forecasting Mistakes
Forecasting problems frequently come from weak process design rather than poor mathematics.
11.1 Treating Shipments as Complete Demand
Shipments show what the company supplied, not necessarily what customers wanted. Therefore, planners should also consider backorders, rejected quantities, and lost sales.
Otherwise, a stockout period may incorrectly appear as weak demand. Consequently, future forecasts may repeat the same shortage.
11.2 Applying One Method to Every Product
Stable, seasonal, new, and intermittent products require different treatment. Although one company-wide method is easy to administer, it often produces weak results.
Therefore, segmentation should guide method selection. In addition, planning policies should vary by commercial importance.
11.3 Ignoring One-Time Orders
Project orders and customer launches can distort the baseline for months. Consequently, unusual demand should be tagged and reviewed before it becomes part of future forecasts.
However, those orders should remain visible for audit and customer analysis. Therefore, adjustment does not mean deletion.
11.4 Ignoring Supplier Variability
Average lead time does not reveal how often a supplier is late. Instead, planning should consider the range and frequency of actual delivery performance.
As a result, safety stock and order timing can reflect supply risk more accurately. Moreover, supplier improvement efforts can focus on measurable problems.
11.5 Accepting Uncontrolled Sales Overrides
Sales insight is valuable. However, every override should include a reason, owner, and expected duration.
Otherwise, optimistic assumptions can become hidden inventory commitments. Moreover, managers should measure override accuracy over time.
Therefore, the business should reward useful input rather than the volume of adjustments.
11.6 Measuring Accuracy Without Taking Action
A dashboard does not improve inventory by itself. Therefore, material forecast errors should trigger a defined response from purchasing, sales, or inventory planning.
Without ownership, reporting becomes passive rather than operational. Consequently, each exception should have a responsible person and due date.
11.7 Disconnecting Forecasts From Purchasing
When forecasts do not create purchase recommendations, transfer plans, or allocation decisions, they remain reports rather than operating tools.
Consequently, the business may continue making reactive decisions despite investing in forecasting. Therefore, the company should measure forecasting success through operational decisions as well as predictions.
12. Demand Forecasting for Wholesale Companies: Spreadsheets Versus Software
Demand forecasting for wholesale companies can begin in spreadsheets. For a small catalog, one warehouse, stable demand, and a limited purchasing team, spreadsheets may remain practical.
However, problems appear when the workbook must combine thousands of SKUs, multiple locations, several planners, supplier constraints, and frequent updates.
12.1 Signs the Spreadsheet Process Is No Longer Working
Review the process when teams maintain different versions, purchase recommendations require repeated copying, inventory changes are not reflected promptly, overrides lack explanations, several channels compete for the same stock, reports take days to consolidate, management distrusts the numbers, formulas break, or only one employee understands the workbook.
If several of these conditions exist, the issue is no longer spreadsheet convenience. Instead, it has become an operational control problem.
Therefore, the company should evaluate process design before simply adding more tabs. In addition, it should identify which data and approvals require stronger governance.
12.2 Capabilities Forecasting Software Should Provide
A practical forecasting system should support SKU-level forecasting, customer and channel forecasts, location-level planning, seasonal models, supplier lead times, safety stock, minimum order quantities, purchase recommendations, overrides, exception reporting, accuracy measurement, multi-warehouse planning, audit trails, and role-based access.
Moreover, the system should fit the company’s planning process rather than forcing unnecessary complexity. Otherwise, users may abandon the tool and return to spreadsheets.
12.3 Standalone Planning Tools Versus ERP Forecasting
| Evaluation area | Standalone forecasting tool | ERP-connected forecasting |
| Forecast modeling | Often specialized | Depends on ERP capabilities |
| Inventory integration | Requires integration | Connected to inventory records |
| Purchasing execution | Usually exported | Can create operational actions |
| Accounting context | Separate integration | Connected to financial activity |
| Warehouse execution | Separate system | Can connect directly |
| Implementation scope | Narrower | Broader operational change |
A standalone tool may be suitable when the company already has a reliable ERP and clean integrations. In contrast, ERP-connected forecasting becomes more relevant when inventory, purchasing, accounting, ecommerce, and warehouse information remain fragmented.
Therefore, the company should begin software selection by defining the operating problem. Only then should the business compare feature sets.
13. Connecting Wholesale Forecasting With ERP Operations
Forecasting cannot deliver its full value when sales, inventory, purchasing, accounting, and warehouse activity are disconnected.
Although ERP does not remove forecast uncertainty, it can create a shared operational foundation. As a result, teams can act on demand changes more consistently.
13.1 Connecting Demand With Sales Orders
Open orders should either consume the forecast or be added to it according to defined rules.
A connected operations platform can centralize demand, inventory, purchasing, accounting, and fulfillment data. Therefore, planners can work with current information rather than outdated spreadsheet exports.
Moreover, shared data reduces repeated reconciliation between departments. As a result, review meetings can focus on decisions instead of data disputes.
13.2 Connecting Forecasts With Purchasing
Forecast demand should generate recommended purchase quantities and required order dates. Buyers can then evaluate supplier minimums, contract pricing, ordering schedules, cash requirements, existing purchase orders, freight economics, and supplier reliability.
Xorosoft connects forecasting with inventory and purchasing workflows, allowing businesses to evaluate expected demand alongside current and incoming supply.
Consequently, forecast changes can lead to practical buyer actions rather than remaining isolated reports. In addition, purchasing decisions can remain visible to finance and operations.
13.3 Connecting Inventory and Accounting
Purchasing decisions affect cash flow, inventory valuation, landed cost, and future liabilities.
A cloud ERP for inventory-driven businesses can provide finance and operations with a shared view of inventory and purchasing activity.
Consequently, teams spend less time reconciling separate operational and accounting records. In addition, finance can see future inventory commitments earlier.
Therefore, forecasting becomes part of financial planning rather than a separate supply-chain exercise.
13.4 Connecting Warehouse Execution
Warehouse teams need advance visibility into incoming goods, storage requirements, transfer activity, and expected picking volume.
When forecasting and warehouse operations are connected, teams can prepare receiving capacity and storage locations before inventory arrives.
As a result, the forecast supports warehouse planning as well as purchasing. Moreover, labor and space decisions can be made earlier.
13.5 Evaluating ERP Alternatives
Xorosoft is built for inventory-driven companies that need to connect inventory management, accounting, purchasing, warehouse operations, manufacturing, forecasting, reporting, and ecommerce.
It may be relevant for businesses that have outgrown QuickBooks, spreadsheets, inventory-only software, or disconnected warehouse and EDI applications.
However, ERP evaluation should begin with operational requirements. Companies may also review NetSuite, Acumatica, Business Central, Sage, Cin7, Brightpearl, or Fishbowl.
A neutral Xorosoft versus NetSuite comparison can support one part of that wider evaluation. Therefore, the final choice should reflect fit, implementation capacity, integration needs, and total ownership cost.
14. Industry Use Cases for Demand Forecasting for Wholesale Companies
Demand forecasting for wholesale companies should reflect the economics, product characteristics, and operational constraints of each industry.
14.1 Apparel and Fashion Demand Planning
Apparel forecasting must operate at the style, color, and size level. Strong demand for one size does not make excess stock in another size useful.
Seasonal collections also have limited selling windows. Therefore, planners should consider preorders, launch timing, historical size curves, returns, customer commitments, markdown dates, and discontinuations.
Moreover, forecasts should distinguish replenishable basics from short-lived fashion products. As a result, each product group can follow a different inventory policy.
14.2 Furniture Wholesale Forecasting
Furniture wholesalers often manage long supplier lead times and bulky products that consume significant warehouse space.
Forecasting should consider container quantities, cubic storage requirements, long replenishment periods, supplier production capacity, regional preferences, customer deposits, and damage rates.
Moreover, warehouse capacity may become as important as unit demand. As a result, purchase decisions should consider physical space as well as sales forecasts.
14.3 Sporting-Goods Demand Planning
Sporting-goods demand may depend on weather, school calendars, league schedules, and regional preferences.
The same product may peak at different times in different markets. Therefore, warehouse-level forecasting helps match inventory with local selling seasons.
In addition, event-driven demand should be separated from normal seasonal patterns. Otherwise, a one-time tournament may distort future plans.
14.4 Food and Beverage Forecasting
Food and beverage wholesalers must balance product availability with shelf-life risk.
Planning should incorporate expiry dates, batch and lot information, promotional demand, seasonal consumption, supplier schedules, storage requirements, and first-expiry-first-out rules.
Overforecasting can create waste, while underforecasting can interrupt customer supply. Therefore, service targets must be balanced against expiry exposure.
14.5 Consumer Product Forecasting
Consumer-product demand can change quickly because of retailer promotions, marketplace activity, advertising, or social-media exposure.
Therefore, event tagging and channel-level forecasting help planners distinguish temporary demand increases from sustainable growth.
Moreover, the company should measure whether promotional lifts continue after the campaign ends. As a result, future plans can avoid assuming temporary demand will persist.
14.6 Manufacturing and Industrial Distribution
Manufacturers can translate finished-goods forecasts through bills of materials to estimate raw-material demand.
Production planning should also account for component availability, work-center capacity, setup times, production yields, existing work orders, and supplier constraints.
Businesses can review Xorosoft’s industry-specific ERP solutions to understand how forecasting and operational requirements differ across apparel, furniture, sporting goods, food, wholesale, and manufacturing.
Therefore, buyers should include industry fit in the software evaluation. A generic feature list may not reveal whether the system supports the company’s actual operating model.
15. When Wholesale Forecasting Needs an Upgrade
A company does not need to replace its forecasting system merely because revenue has grown. However, an upgrade becomes necessary when the current process can no longer provide timely, reliable, and actionable information.
15.1 Operational Warning Signs
Common warning signs include frequent stockouts, rising excess inventory, emergency supplier orders, regular warehouse transfers, unreliable delivery promises, poor purchasing visibility, warehouse congestion, and increasing backorders.
If these issues continue despite regular planning, the underlying process may no longer support the business. Therefore, management should investigate both process and system limitations.
15.2 Data and Reporting Warning Signs
The process may have reached its limit when reports require manual consolidation, teams disagree about inventory balances, forecasts cannot be traced to assumptions, product and warehouse data are inconsistent, purchase plans become outdated quickly, or management does not trust the numbers.
Consequently, planners spend more time assembling data than making decisions. In addition, important actions may be delayed while teams reconcile conflicting reports.
15.3 Multi-Warehouse and Multi-Channel Warning Signs
The need for connected planning becomes stronger when the company adds multiple warehouses, Shopify, Amazon, EDI customers, manufacturing, international suppliers, complex allocation policies, or customer-specific pricing.
As complexity increases, manual coordination becomes harder to sustain. Therefore, the business should evaluate whether the current system can support the next stage of growth.
16. Improving Demand Forecasting for Wholesale Companies in 90 Days
Demand forecasting for wholesale companies can be strengthened without replacing every system immediately. A phased approach allows the business to improve process discipline before introducing more technology.
16.1 First 30 Days: Establish Control
During the first month, assign process ownership, document the current workflow, audit inventory and product data, identify high-value SKUs, record supplier lead times, establish accuracy and service metrics, and identify major stockout and overstock causes.
First, the business should understand how decisions are currently made. Otherwise, new software may simply automate an unclear process.
Therefore, the first phase should focus on visibility and ownership. In addition, the company should document where manual work creates delay or error.
16.2 Days 31–60: Improve Forecast Quality
During the second month, segment products, tag unusual demand events, test simple forecasting methods, add customer and sales input, create exception reports, measure forecast bias, and review safety-stock policies.
Next, the team should compare the new process with existing performance. As a result, planners can see which changes actually improve decisions.
Moreover, the business should record which overrides add value. Therefore, manual judgment becomes measurable rather than anecdotal.
16.3 Days 61–90: Connect Forecasting With Execution
During the third month, connect forecasts to purchasing, establish forecast-review meetings, document override rules, review multi-warehouse allocation, measure supplier reliability, identify integration gaps, and evaluate whether current systems support the process.
Finally, the company should decide whether technology limitations are preventing further progress.
If the process is sound but data remains fragmented, a connected system may become the logical next step. Therefore, software evaluation should follow process improvement rather than precede it.
17. Frequently Asked Questions About Wholesale Demand Forecasting
17.1 What Is Demand Forecasting for Wholesale Companies?
Demand forecasting for wholesale companies estimates the quantity and timing of future product demand. Consequently, wholesalers can use it to guide purchasing, inventory targets, warehouse allocation, supplier planning, and cash-flow decisions.
17.2 Why Is Demand Forecasting Important for Wholesalers?
It helps wholesalers balance customer availability with inventory cost. As a result, a reliable process reduces the risk of carrying too much slow-moving stock while still running out of important products.
17.3 How Do Wholesale Companies Forecast Demand?
First, they collect historical and current demand data. Next, they remove unusual events, segment products, select suitable methods, add commercial input, and convert the approved forecast into purchasing and inventory actions.
17.4 What Is the Difference Between Forecasting and Demand Planning?
Forecasting predicts customer demand. Demand planning, however, determines how the business will meet that demand using inventory, suppliers, purchase orders, warehouses, and financial resources.
17.5 What Is the Difference Between Sales Forecasting and Demand Forecasting?
Sales forecasting often focuses on revenue. In contrast, demand forecasting focuses on product quantities, timing, customers, channels, and locations.
17.6 What Data Is Required for Wholesale Demand Forecasting?
Useful data includes sales orders, shipments, backorders, lost sales, returns, inventory, incoming supply, supplier lead times, promotions, customer plans, channel demand, and warehouse activity. In addition, planners should document unusual events.
17.7 How Much Historical Data Is Needed?
At least one complete seasonal cycle is useful. However, two or three cycles usually provide a stronger comparison. New products, meanwhile, require similar-item history and commercial estimates.
17.8 Which Forecasting Method Is Best for Wholesalers?
There is no universal best method. Stable, seasonal, intermittent, and new products need different approaches. Therefore, the method should match the demand pattern and planning decision.
17.9 How Should Seasonal Demand Be Forecast?
First, identify patterns that repeat by week, month, quarter, or season. Additionally, remove unusual promotions and stockouts before estimating the normal seasonal effect.
17.10 How Should Slow-Moving Inventory Be Forecast?
Use intermittent-demand methods, longer time buckets, customer input, or order-driven policies. Otherwise, ordinary moving averages may perform poorly when many periods contain zero demand.
17.11 How Are New Products Forecast?
Use similar products, category trends, customer commitments, launch plans, market research, and sales estimates. Then update the forecast frequently as actual orders become available.
17.12 How Do Supplier Lead Times Affect Forecasts?
The forecast horizon must extend beyond supplier lead time. Moreover, longer or less reliable lead times require earlier purchasing decisions and may require additional safety stock.
17.13 How Does Forecasting Reduce Stockouts?
Forecasting identifies expected requirements before every customer order arrives. As a result, purchasing has more time to order inventory, transfer stock, or adjust allocation.
17.14 How Does Forecasting Reduce Excess Inventory?
It allows buyers to compare expected demand with available and incoming inventory before ordering. Therefore, purchasing is less dependent on intuition or broad safety percentages.
17.15 How Does Forecasting Affect Safety Stock?
Forecast error, supplier reliability, service targets, and replenishment time influence safety stock. Consequently, stable products with reliable supply generally require less protection.
17.16 How Are Reorder Points Calculated?
A basic reorder point equals expected demand during supplier lead time plus safety stock. More advanced calculations, however, may also include demand and lead-time variability.
17.17 How Should Forecasts Be Managed Across Warehouses?
Create forecasts by location and compare them with local inventory, incoming supply, transfer options, and customer requirements. Otherwise, company-wide totals may hide regional shortages.
17.18 How Often Should Forecasts Be Updated?
Many wholesalers use a monthly rolling forecast with weekly reviews for priority products and near-term exceptions. However, more volatile businesses may update forecasts more frequently.
17.19 How Is Forecast Accuracy Measured?
Common metrics include MAE, MAPE, WAPE, RMSE, and forecast bias. In addition, fill rate, service level, stockouts, and inventory turnover should be monitored.
17.20 Is MAPE Suitable for Wholesale Forecasting?
MAPE works for products with regular nonzero demand. However, it can be misleading for intermittent items because percentages become unstable when actual demand is near zero.
17.21 What Is Forecast Bias?
Forecast bias shows whether forecasts consistently overestimate or underestimate demand. Consequently, persistent overforecasting can create excess inventory, while underforecasting can create shortages.
17.22 Can Wholesalers Forecast Demand in Spreadsheets?
Yes. Spreadsheets may work for smaller operations. Nevertheless, they become difficult to control when the business adds products, warehouses, channels, planners, and supplier constraints.
17.23 When Should a Wholesaler Adopt Forecasting Software?
Software becomes relevant when manual consolidation takes too long, teams maintain conflicting versions, purchasing is disconnected, or multi-warehouse complexity exceeds spreadsheet control. Therefore, the business should assess both process and system limitations.
17.24 How Does ERP Improve Demand Forecasting for Wholesale Companies?
ERP connects demand forecasting for wholesale companies with sales orders, inventory, purchasing, accounting, suppliers, and warehouse activity. Therefore, forecast changes can lead directly to operational decisions.
17.25 Who Does Not Need Advanced Forecasting Software?
A small company with a limited catalog, one warehouse, stable demand, and straightforward purchasing may not require advanced software. In that situation, a disciplined spreadsheet process may remain sufficient.
18. Make Wholesale Forecasting Part of Daily Operations
Demand forecasting for wholesale companies should not end with a predicted number in a planning file. Instead, the forecast must influence purchasing, safety stock, supplier communication, warehouse transfers, cash planning, and customer commitments.
First, begin with clean data and simple methods. Next, separate normal demand from unusual events. Then segment products according to value and predictability.
Additionally, measure forecast error and bias while monitoring fill rate, inventory turnover, backorders, and excess stock. As a result, the company can evaluate whether better forecast accuracy is producing better operational outcomes.
As operational complexity grows, evaluate whether the forecast remains connected to current sales orders, inventory, suppliers, purchasing, accounting, ecommerce, and warehouse activity. The goal is not to automate every decision. Rather, the goal is to give planners a reliable view of what is likely to happen and enough time to respond.
Companies relying on QuickBooks, spreadsheets, inventory applications, and separate warehouse systems should identify where information is delayed or duplicated. Eventually, a connected ERP may become appropriate when manual processes begin to limit inventory visibility, purchasing accuracy, or scalability.
To review how forecasting, inventory management, purchasing, accounting, manufacturing, Shopify, Amazon, EDI, and multi-warehouse workflows could operate within one connected system, book a personalized Xorosoft demo.
Recent Posts
-
 ERP Landed Cost Module vs Spreadsheet Calculations for Importers
 -
 How to Build an Open-to-Buy Plan for an Omnichannel Brand
 -
 Cold Storage WMS for Food and Beverage Distribution
 -
 ERP Buying Statistics 2026: Evaluation, Implementation, and Adoption Risks
 -
 How a Distributor Reduced B2B Order Exceptions Without Restricting Sales