This article will provide an overview of the wholesale inventory-to-sales ratio and its significance in tracking business trends.
1. Inventory Levels Are Telling Distributors More Than a Sales Report Can
Wholesale distributors can post strong sales while still carrying the wrong inventory. They can also reduce total stock and discover that customer service has deteriorated because critical SKUs are unavailable. That tension is why inventory dollars alone are a weak measure of distribution performance.
The better question is how inventory is moving relative to sales.
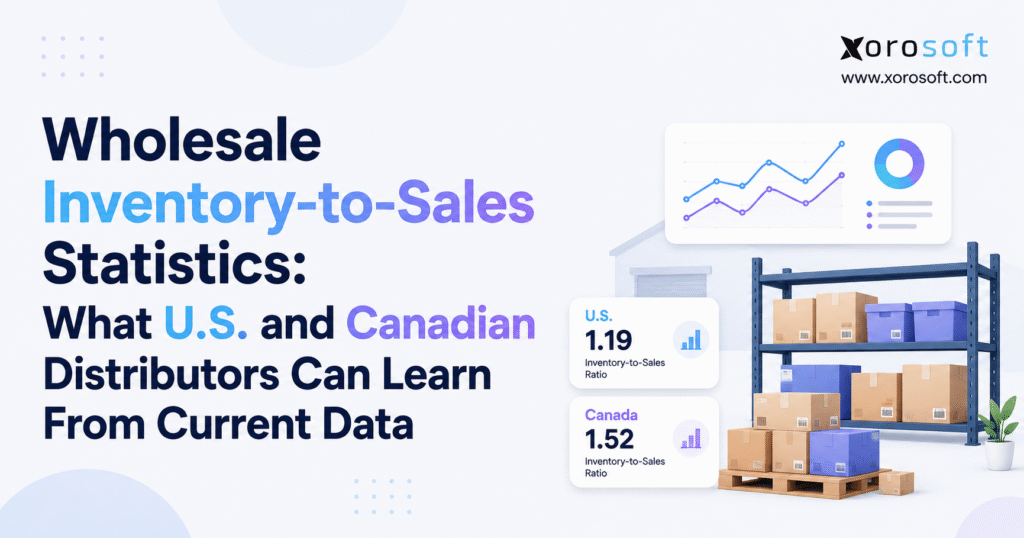
Current U.S. and Canadian wholesale data makes that relationship especially relevant. In June 2026, U.S. merchant wholesalers reported $794.1 billion in seasonally adjusted sales and $944.7 billion in inventories. The resulting inventories-to-sales ratio was 1.19, down from 1.30 in June 2025.
Canada’s June data moved in a similar direction, although the underlying survey scope differs. Statistics Canada reported C$92.5 billion in wholesale sales and C$140.4 billion in inventories for its current monthly series. The inventory-to-sales ratio declined from 1.54 in May to 1.52 in June.
These figures do not tell an individual distributor how much stock it should hold. They provide something more useful: a signal about the relationship between inventory and the rate at which products are being sold.
For operators, CFOs, buyers, and supply chain leaders, that relationship can reveal whether working capital is becoming more productive or whether inventory is beginning to outrun demand.
1.1 National Statistics Are a Starting Point, Not a Company Target
Government wholesale data measures broad markets. A distributor manages individual products, suppliers, warehouses, customers, and lead times.
The gap between those two views matters.
A national ratio can fall even while one distributor builds excess inventory. Conversely, a national ratio can rise while another business improves forecasting and releases significant working capital.
The practical value of current wholesale statistics is therefore not copying the national number. It is learning how to ask better questions about your own inventory.
2. Wholesale Inventory-to-Sales Ratio: What the Metric Actually Measures
The wholesale inventory-to-sales ratio compares inventory held at the end of a period with sales during that period. It helps show how much inventory exists relative to the current rate of demand.
At its simplest, the formula is:
Inventory-to-Sales Ratio = Ending Inventory ÷ Monthly Sales
Suppose a distributor holds $15 million of inventory at month-end and produces $10 million in sales during that month. Its simplified inventory-to-sales ratio is 1.5.
That suggests inventory equal to roughly 1.5 months of sales if the current sales rate continued and no additional inventory arrived.
Statistics Canada describes the ratio similarly, as the time required to exhaust inventories if sales remained at their current level.
2.1 Why the Wholesale Inventory-to-Sales Ratio Needs Context
The formula is simple. The interpretation is not.
Two distributors can have the same wholesale inventory-to-sales ratio and face completely different operating conditions.
One may buy finished goods domestically with seven-day supplier lead times. Another may import container quantities from Asia with four-month lead times and significant minimum order requirements.
Both could report a ratio of 1.5, yet their inventory risk would be very different.
Product margins, seasonality, customer service targets, supplier reliability, sales volatility, shelf life, and warehouse structure all influence how much inventory a company needs.
2.2 The Ratio Is Better for Trends Than Isolated Decisions
A single month’s wholesale inventory-to-sales ratio rarely tells the full story.
The metric becomes more useful when management compares it with previous months, previous years, forecasts, inventory turnover, fill rate, and supplier lead-time performance.
A ratio moving from 1.8 to 1.4 may indicate that sales are absorbing inventory more efficiently. However, if backorders are rising at the same time, the business may have reduced stock too aggressively.
Direction matters, but operational context determines whether the direction is healthy.
3. U.S. Wholesale Inventory-to-Sales Ratio Shows Faster Inventory Absorption
The latest finalized U.S. Monthly Wholesale Trade Report covers June 2026. Merchant wholesalers generated seasonally adjusted sales of $794.1 billion, down 3.0% from May but 14.1% above June 2025.
Inventories ended June at $944.7 billion, up 0.2% from May and 4.2% year over year.
Because sales increased much faster than inventories compared with the previous year, the seasonally adjusted wholesale inventory-to-sales ratio fell to 1.19, from 1.30 in June 2025.
| U.S. Wholesale Metric | June 2026 |
|---|---|
| Wholesale sales | $794.1 billion |
| Wholesale inventories | $944.7 billion |
| Inventory-to-sales ratio | 1.19 |
| Sales change YoY | +14.1% |
| Inventory change YoY | +4.2% |
| June 2025 ratio | 1.30 |
3.1 What the Lower U.S. Ratio Can Signal
On the surface, the change suggests that aggregate wholesale inventory became more productive relative to sales.
Sales were moving substantially faster year over year than the inventory base supporting them. For distributors, that is often what improved inventory efficiency looks like: revenue expands without inventory increasing at the same pace.
However, a national aggregate cannot reveal product availability.
A lower ratio becomes problematic when distributors begin sacrificing service levels to maintain lean inventory. That is why fill rates, backorders, lost sales, and supplier reliability need to be reviewed alongside the ratio.
3.2 July 2026 Inventory Data Should Still Be Treated as Preliminary
The U.S. Census Bureau has already published an advance estimate for July 2026 wholesale inventories of $959.1 billion, which was 1.3% above June and 5.7% above July 2025.
That advance figure does not yet provide the complete finalized July wholesale inventory-to-sales ratio.
The full July Monthly Wholesale Trade release is scheduled for September 10, 2026.
For an apples-to-apples discussion using finalized sales and inventories, June therefore remains the appropriate U.S. reference month as of September 3, 2026.
4. Canadian Wholesale Inventory-to-Sales Ratio Also Improved in June
Canada’s finalized June 2026 data tells a different but related story.
Wholesale sales in Statistics Canada’s current series increased 2.8% from May to C$92.5 billion. Sales were also 9.0% higher than the same month in 2025.
Meanwhile, inventories increased 1.2% to C$140.4 billion.
Because monthly sales increased faster than inventories, Canada’s wholesale inventory-to-sales ratio declined from 1.54 in May to 1.52 in June.
That movement suggests sales absorbed inventory somewhat faster during the month, even as distributors increased the total inventory they held.
4.1 Canadian Industry Mix Adds Important Context
The aggregate figure hides meaningful movements across wholesale subsectors.
Statistics Canada reported that machinery, equipment, and supplies inventories increased 3.9% to C$42.9 billion. Building material and supplies inventories increased 2.7% to C$24.2 billion.
That matters because wholesale inventory requirements differ widely by sector.
Industrial equipment may involve long supplier lead times and expensive replacement parts. Food products involve shelf-life constraints. Apparel businesses manage style, size, color, and seasonality. Furniture distributors balance bulky inventory with long international replenishment cycles.
A national ratio blends those operating models together.
4.2 Canada’s July Indicator Is Not Yet a Final Inventory Benchmark
Statistics Canada’s advance July indicator estimates that wholesale sales declined 0.6%. The estimate was based on a 65.4% weighted response rate, compared with an average final response rate of 83.3% for the preceding 12 months.
The agency specifically notes that advance indicators are subject to a higher revision rate.
For that reason, distributors should avoid constructing an unofficial July Canadian wholesale inventory-to-sales ratio using preliminary sales and incomplete inventory data.
5. U.S. and Canadian Inventory Ratios Should Not Be Compared Blindly
Seeing 1.19 for the United States and 1.52 for Canada creates an obvious temptation: assume Canadian wholesalers are carrying substantially more inventory.
That is not a defensible conclusion without methodological context.
The U.S. Monthly Wholesale Trade report covers merchant wholesalers while excluding manufacturers’ sales branches and offices.
Statistics Canada’s current monthly analysis excludes petroleum, petroleum products, other hydrocarbons, oilseed, and grain. Its Monthly Wholesale Trade Survey also excludes business-to-business electronic markets and agents and brokers from wholesale sector coverage.
5.1 Use Direction Before Comparing Absolute Levels
For operating decisions, the direction of each country’s wholesale inventory-to-sales ratio is more useful than comparing the raw numbers.
In June, both finalized datasets showed the ratio moving down.
That suggests sales were absorbing inventory faster relative to the inventory base in each respective statistical series.
A distributor should apply the same logic internally. Is the company’s ratio rising, falling, or remaining stable? Is that movement driven by stronger demand, inventory reductions, large inbound shipments, slower sales, or product-mix changes?
Those questions are far more actionable than deciding whether 1.19 is “better” than 1.52.
6. Why the Wholesale Inventory-to-Sales Ratio Matters to Working Capital
Inventory is one of the largest uses of working capital in many distribution businesses.
Every additional unit purchased converts cash into stock. That investment produces value only when the product can eventually be sold at an acceptable margin.
If inventories rise materially faster than sales, more capital becomes tied up in goods waiting to move through the business.
The direct impact appears on the balance sheet, but the operational cost extends further. Extra inventory requires warehouse space, handling labor, insurance, financing, cycle counting, transfers, and management attention.
6.1 Excess Inventory Creates Costs Beyond Purchase Price
The cost of inventory does not stop when the supplier invoice is paid.
Products can become obsolete. Packaging may change. Seasonal demand can expire. Consumer preferences may move. Damaged or aged inventory may require markdowns.
Even perfectly sellable stock carries an opportunity cost when cash could have been invested elsewhere.
A rising wholesale inventory-to-sales ratio can therefore prompt a useful financial question: how much of the increase represents necessary protection against demand and supply variability, and how much is inventory the business does not need?
6.2 Low Inventory Can Be Expensive Too
Aggressive inventory reduction can improve working-capital metrics while damaging revenue.
A distributor that removes too much safety stock may face more stockouts, emergency purchasing, expedited freight, split shipments, backorders, and customer churn.
The right inventory position balances capital efficiency with service performance.
That is why sophisticated operators rarely manage the wholesale inventory-to-sales ratio in isolation. They connect it with fill rate, forecast accuracy, lead times, inventory turnover, and customer service targets.
7. What Is a Good Wholesale Inventory-to-Sales Ratio for a Distributor?
There is no universal “good” wholesale inventory-to-sales ratio.
A healthy level depends on how a business buys, sells, stores, and replenishes products.
A domestic distributor with dependable suppliers and short lead times can often operate with less inventory coverage. An importer that relies on long ocean freight cycles may require substantially more stock to protect service levels.
Even companies in the same industry can need different ratios because they serve different customers.
7.1 Industry Characteristics Change Inventory Requirements
Apparel distributors manage style, size, color, and seasonal variants. A company may have plenty of units in total while lacking the combinations customers actually want.
Furniture distributors often deal with bulky products, container purchasing, long inbound lead times, and expensive storage.
Food and beverage distributors must consider shelf life, lot control, expiration risk, and rapid replenishment.
Sporting goods businesses may experience seasonal peaks around specific sports, weather patterns, and promotional periods.
These differences are why distributors should compare their inventory strategy with relevant industry operating requirements instead of adopting a universal ratio.
7.2 Your Own History Is Often the Best First Benchmark
A company’s historical ratio provides valuable context because it reflects the same products, suppliers, customers, and accounting practices.
Management can compare the current month with the same period last year, rolling averages, peak seasons, and prior demand cycles.
If the ratio rises from 1.4 to 1.9 while service levels remain unchanged, the business should understand what caused the additional inventory.
If it falls from 1.9 to 1.4 while stockouts increase sharply, the apparent improvement may be misleading.
8. A Rising Wholesale Inventory-to-Sales Ratio Deserves Investigation
A rising wholesale inventory-to-sales ratio means inventory is increasing relative to current sales. It does not automatically mean the purchasing team made a mistake.
Several legitimate factors can temporarily increase the ratio.
A distributor may deliberately build inventory before a seasonal peak. It may place orders early because a key supplier announced longer lead times. A business may also stock ahead of an expected price increase or new customer rollout.
The challenge is distinguishing intentional inventory from uncontrolled accumulation.
8.1 Demand Can Slow Before Purchasing Responds
Purchase orders often reflect forecasts created weeks or months earlier.
When demand weakens, existing POs continue arriving unless buyers adjust them quickly. Inventory then increases while sales fall or remain flat.
This lag is especially dangerous for imported products.
By the time a distributor recognizes slowing demand, several containers may already be in production or on the water. Forecast review therefore needs to happen before excess inventory becomes visible in financial reports.
8.2 Forecast Bias Can Build Inventory Quietly
Forecast error is normal. Forecast bias is more dangerous.
If a business consistently predicts sales above actual demand, purchasing decisions repeatedly lean toward overbuying.
Each individual decision can appear reasonable. Over several months, however, slow-moving inventory accumulates across dozens or hundreds of SKUs.
A rising ratio should therefore trigger analysis of forecast accuracy, not only an inventory-cutting exercise.
9. A Falling Wholesale Inventory-to-Sales Ratio Can Hide Availability Risk
A declining wholesale inventory-to-sales ratio often looks positive because inventory is being used more efficiently relative to sales.
That interpretation may be correct. It is not guaranteed.
If demand rises quickly while suppliers cannot replenish stock at the same pace, the ratio can fall immediately before service levels deteriorate.
The company’s financial metrics improve while customers start encountering unavailable products.
9.1 Service-Level KPIs Provide the Missing Context
A falling ratio should be reviewed beside fill rate, stockout frequency, backorders, lost sales, and order cycle time.
If inventory decreases while those metrics remain stable or improve, the company may genuinely be operating more efficiently.
If backorders and lost sales rise, the business may simply be understocked.
That distinction is critical because a distributor does not generate value by minimizing inventory. It generates value by converting inventory into profitable sales while meeting customer expectations.
9.2 Supplier Risk Can Make Lean Inventory Fragile
Inventory strategies also need to account for supply variability.
A product with a nominal 30-day lead time may frequently arrive in 45 or 60 days. A buyer using the nominal number can underestimate the stock needed to protect service.
The same issue appears when suppliers experience production constraints, port delays, customs issues, or inconsistent fill rates.
Inventory optimization therefore requires real lead-time performance, not only the value stored in the item master.
10. Wholesale Inventory-to-Sales Ratio vs Inventory Turnover and DIO
The wholesale inventory-to-sales ratio answers one important question: how much inventory exists relative to current sales?
It does not replace other inventory KPIs.
Inventory turnover typically measures how many times average inventory cycles through the business, commonly using cost of goods sold divided by average inventory.
Days Inventory Outstanding translates inventory efficiency into an approximate number of days.
Weeks of supply estimates how long current stock may support expected future demand.
10.1 Fill Rate Prevents Efficiency From Becoming the Only Goal
Fill rate measures how much customer demand the business can satisfy from available inventory.
That makes it an essential counterweight to inventory-efficiency metrics.
A distributor could improve turnover by reducing inventory dramatically. If fill rate drops from 98% to 88%, however, the improvement may come at an unacceptable commercial cost.
10.2 GMROI Adds Margin to the Inventory Discussion
Gross Margin Return on Inventory Investment, or GMROI, adds another useful perspective.
Two products may carry similar inventory values and sales velocity, but one may generate substantially better gross margin.
That means inventory allocation decisions should consider profitability as well as sales volume.
For executives, the strongest dashboard connects inventory-to-sales trends, turnover, DIO, fill rate, forecast accuracy, aging, and margin rather than presenting one ratio as the final answer.
11. How to Benchmark Your Wholesale Inventory-to-Sales Ratio Internally
A useful internal benchmark starts at company level but should not stop there.
Calculate the wholesale inventory-to-sales ratio consistently each month. Then compare the direction with inventory growth, sales growth, the same month last year, and a rolling trend.
That analysis shows whether inventory is generally becoming heavier or lighter relative to sales.
The next step is decomposition.
11.1 Move From Company Level to Product Category
Assume the overall company ratio is 1.5.
One category may effectively sit at 0.7 while another is closer to 3.0. The aggregate makes the company appear balanced even though one product family faces stockout risk and another consumes excessive working capital.
Category-level analysis helps management find where the company-wide movement originates.
It is particularly useful for distributors with very different product types, margins, lead times, or seasonal patterns.
11.2 SKU-Level Analysis Exposes the Inventory Mix
SKU analysis answers the question the aggregate ratio cannot: which specific products are creating the problem?
Fast movers may be understocked while obsolete items remain on shelves.
A distributor should combine ratio trends with item velocity, inventory age, demand variability, minimum order quantities, purchase commitments, and available substitutes.
Not every low-volume SKU is a problem. Strategic service parts or customer-specific items may intentionally carry slower turns.
The goal is to identify inventory that exists without a clear operational reason.
11.3 Warehouse and Channel Views Reveal Allocation Problems
Multi-location distributors should also review inventory by warehouse and sales channel.
The company may own enough stock overall but have it in the wrong region.
Likewise, ecommerce, Amazon, retail, wholesale, and EDI customers may compete for the same inventory pool.
The correct benchmark is therefore increasingly multidimensional: SKU, warehouse, channel, demand, and time.
12. Why Distributors Can Have Excess Inventory and Stockouts at the Same Time
One of the most frustrating distribution problems is seeing a warehouse full of inventory while sales teams tell customers that products are unavailable.
This is not unusual. It is an inventory-mix problem.
A company may be overstocked in low-demand SKUs while lacking its strongest sellers. It may hold product in a western warehouse while demand is concentrated in the east. Stock might also be available physically but committed to another order or channel.
12.1 Total Inventory Value Can Hide Operational Imbalance
Financial reports usually show the value of inventory the business owns.
Customers care about whether the exact product they want is available at the required place and time.
That gap explains why reducing total inventory is rarely sufficient.
Distributors need visibility into available, allocated, committed, inbound, damaged, quarantine, and transferable inventory.
A company that can see those statuses clearly can rebalance existing stock before purchasing more. A company working from several disconnected spreadsheets may respond to a local shortage by adding more total inventory.
13. Forecasting and Purchasing Determine Tomorrow’s Inventory Ratio
Today’s inventory position often reflects purchasing decisions made months ago.
That is why the wholesale inventory-to-sales ratio should not be managed only after inventory arrives. The biggest opportunity usually sits upstream in forecasting and procurement.
A buyer needs to know current stock, actual demand, expected demand, open purchase orders, supplier lead times, safety stock, and warehouse requirements before approving more inventory.
When those inputs exist in separate systems, timing errors become common.
13.1 Replenishment Needs a Forward-Looking View
Sales history explains what happened. Purchasing needs to determine what is likely to happen next.
A strong replenishment process accounts for seasonality, promotions, large customer commitments, new products, discontinued items, supplier constraints, and actual inbound dates.
This is where integrated inventory, purchasing, forecasting, accounting, and operational solutions become more relevant than isolated reporting.
For inventory-driven businesses, Xorosoft is designed to connect these areas so buyers can evaluate demand and supply from a common operating dataset rather than rebuilding the analysis manually each cycle.
13.2 Minimum Order Quantities Need Financial Context
Supplier MOQs frequently push distributors toward larger purchases.
The unit cost may improve, but the additional quantity consumes cash and warehouse capacity.
A good buying decision therefore considers more than purchase price. It should weigh carrying cost, expected demand, margin, inventory age risk, storage requirements, and the cost of a potential stockout.
The cheapest unit is not always the cheapest inventory decision.
14. When Inventory Complexity Outgrows Spreadsheets and Standalone Apps
Spreadsheets remain extremely useful analytical tools. Problems emerge when spreadsheets become the operating system for a complex distribution company.
A single-warehouse business with a limited catalog may manage inventory effectively using accounting software and a focused inventory application.
The picture changes when a company adds warehouses, sales channels, EDI customers, purchasing teams, manufacturing, or more sophisticated accounting.
Each new operating layer increases the number of records that must stay synchronized.
14.1 The Real Problem Is Usually Data Fragmentation
Imagine inventory quantities in one application, purchasing in spreadsheets, accounting in another platform, warehouse activity in a WMS, and Shopify orders in a separate integration.
Each application may work correctly by itself.
The challenge appears when management needs one answer.
How much is available? What is already allocated? What is inbound? Which supplier order is late? How much working capital is tied up? Which warehouse needs replenishment?
A connected cloud ERP such as XoroONE is designed for this type of inventory-driven operating model by bringing inventory, purchasing, accounting, warehouse management, manufacturing, forecasting, and ecommerce workflows together.
14.2 ERP Becomes Relevant When Decisions Cross Departments
Inventory decisions rarely stay inside the inventory team.
Purchasing changes accounts payable and cash requirements. Receiving affects inventory valuation. Warehouse transfers influence availability. Customer orders reserve inventory. Returns alter sellable stock. Manufacturing consumes components and creates finished goods.
Once these workflows depend on each other, the company needs more than an inventory count.
That is the point where ERP starts functioning as an operational data model rather than simply another application.
15. Shopify, Amazon, Wholesale, and EDI Change the Inventory Equation
Modern distributors increasingly serve several channels from the same inventory base.
A product may be sold through Shopify in the morning, allocated to a wholesale customer through EDI in the afternoon, and replenished for Amazon later that day.
Without near-real-time synchronization, each channel can appear to have inventory that another channel has already consumed.
15.1 Channel Growth Can Distort Inventory Planning
A company-wide sales forecast may miss important channel differences.
Wholesale orders can be large and less frequent. DTC orders may be smaller but arrive continuously. Amazon demand can change quickly around ranking, promotions, or marketplace events.
Inventory planning therefore needs to understand not only total demand but where that demand originates.
The Xorosoft ERP app on the Shopify App Store is positioned for ecommerce, retail, and wholesale businesses and supports order, product, inventory, fulfillment, and related Shopify synchronization.
For broader architecture, Xorosoft integrations can connect operational systems and channels so inventory decisions are based on synchronized data rather than separate channel reports.
16. Multi-Warehouse Visibility Is Essential for Meaningful Inventory Benchmarks
A company can improve its overall wholesale inventory-to-sales ratio and still have severe warehouse-level problems.
Suppose a distributor has 10,000 units nationally. Demand is strong in Toronto, but most available inventory sits in Vancouver.
The company’s aggregate inventory position appears healthy. Toronto customers experience shortages.
Buying more stock may solve the immediate problem, but an inter-warehouse transfer could be faster and less expensive.
16.1 Inventory Location Changes the Meaning of Availability
Multi-warehouse planning requires visibility into more than on-hand units.
Operators need to understand available inventory, committed stock, inbound receipts, transfers, picking activity, warehouse capacity, and regional demand.
That is the operational role of a warehouse management system.
For companies that need ERP and warehouse execution connected, XoroWMS provides a path for managing warehouse workflows alongside broader inventory operations.
The larger principle applies regardless of technology choice: inventory cannot be optimized nationally if the business cannot see it accurately at location level.
17. AI and Connected Data Can Make Inventory Exceptions Easier to Manage
Inventory management is becoming increasingly exception-driven.
Managers do not need another report showing thousands of SKUs. They need to know which SKUs require attention today and why.
Examples include products approaching stockout, inventory aging beyond a threshold, supplier POs arriving late, forecast demand increasing unexpectedly, and warehouses holding excess inventory while another location is short.
The quality of those alerts depends on the underlying data.
17.1 AI Is Only as Useful as the Operational Context It Can Access
A generic AI assistant cannot make reliable replenishment recommendations if it cannot see inventory, sales, purchase orders, suppliers, warehouses, and financial context.
Connected architecture makes more useful questions possible.
For businesses exploring this direction, Xorosoft’s MCP server for AI connectivity represents one approach to exposing ERP context to AI tools.
The important point is not to automate every inventory decision. It is to give operators faster access to exceptions, explanations, and supporting data so they can act before monthly ratios reveal a problem that started weeks earlier.
18. How to Evaluate ERP When Inventory Performance Becomes a Systems Problem
An ERP project should not begin with a software feature checklist.
Start with the operating problems the business cannot solve reliably today. Buyers need clear visibility into demand and available supply. Finance should be able to reconcile inventory without extensive manual work. Warehouse teams also need quantities they can trust. Most importantly, management should be able to explain why the wholesale inventory-to-sales ratio changed without combining data from several disconnected systems.
If those answers still require multiple exports, spreadsheets, and manual reconciliation, the underlying systems architecture deserves attention.
18.1 Evaluate the Operating Model Before the Brand Name
Inventory-driven distributors may consider Xorosoft, NetSuite, Acumatica, Microsoft Dynamics 365 Business Central, Cin7, Sage, Fishbowl, or other platforms.
Each system has different strengths, implementation models, ecosystems, and target customers.
Xorosoft’s XoroERP is relevant when inventory, purchasing, warehousing, accounting, manufacturing, and multi-channel operations need to work in a connected environment.
For companies specifically evaluating the two platforms, the Xorosoft vs NetSuite comparison provides additional context for building a requirements-based comparison.
18.2 Look for Evidence of Operational Fit
Product demonstrations matter, but practical operating examples matter too.
A distribution team should ask vendors to demonstrate its own scenarios: receiving inventory against a PO, allocating scarce stock, transferring inventory, forecasting a seasonal SKU, processing EDI orders, reconciling Shopify payouts, or valuing inventory.
Reviewing relevant Xorosoft case studies can help buyers see how other inventory-driven businesses approached similar operational challenges.
The goal is not to select the ERP with the longest feature list. It is to choose the system that supports the company’s actual transaction flows and decision-making requirements.
19. Turn the Wholesale Inventory-to-Sales Ratio Into a Monthly Operating Discipline
The latest U.S. and Canadian data provides a useful reminder: inventory should always be interpreted relative to demand.
The U.S. ratio of 1.19 and Canada’s 1.52 reading are not targets for individual distributors. They are broad signals showing how inventory and sales are moving within each statistical population.
A distributor needs to create its own operating context.
Start by calculating the wholesale inventory-to-sales ratio consistently. Compare it with the same month last year and with rolling trends. Then separate the result by product category, warehouse, and sales channel.
19.1 Move From the Ratio to the Cause
When the ratio rises, determine whether the driver is slower sales, early receipts, forecast bias, supplier MOQs, seasonal builds, or slow-moving stock.
When it falls, confirm that fill rate, availability, and customer service remain healthy.
Then examine what is already inbound.
An apparently healthy inventory level can change quickly when several large purchase orders arrive in the same month.
The operating discipline is therefore simple: measure the ratio, explain the movement, identify the SKU-level cause, and adjust purchasing before the next cycle compounds the problem.
19.2 Use Technology Only Where Complexity Justifies It
A simple business does not need enterprise software merely to calculate one inventory KPI.
A growing distributor may need a broader system when inventory performance depends on multiple warehouses, complex purchasing, Shopify, Amazon, EDI, accounting, manufacturing, forecasting, and warehouse execution.
At that point, the value of ERP is not the ratio itself. It is having the sales, inventory, purchasing, warehouse, and financial data required to understand why the ratio moved.
If that level of complexity describes your operation, you can contact Xorosoft to evaluate whether a connected ERP approach fits your requirements.
The objective remains the same regardless of platform: hold enough of the right inventory to serve demand without tying unnecessary capital up in the wrong products.
Wholesale Inventory-to-Sales Ratio FAQs
What is the wholesale inventory-to-sales ratio?
It compares ending wholesale inventory with monthly sales. The metric helps show whether inventory is accumulating faster than demand or being consumed more efficiently.
How high is the U.S. wholesale inventory-to-sales ratio in 2026?
The finalized seasonally adjusted ratio was 1.19 in June 2026, compared with 1.30 in June 2025.
Which inventory-to-sales ratio did Canada report in 2026?
Statistics Canada’s June 2026 wholesale series reported a ratio of 1.52, down from 1.54 in May.
Which inventory-to-sales ratio is considered good for distributors?
There is no universal target. The right level depends on lead times, industry, seasonality, service goals, supplier reliability, demand volatility, and product economics.
Does a high inventory-to-sales ratio mean overstock?
Not automatically. Seasonal builds, long lead times, large MOQs, or supply-risk protection can justify higher inventory even when the ratio rises.
Can a low inventory-to-sales ratio cause stockouts?
Yes. A low ratio may indicate efficiency, but insufficient safety stock can create shortages when demand rises or supplier replenishment slows.
How can ERP improve inventory-to-sales performance?
ERP connects inventory, sales, purchasing, forecasting, warehouse, and accounting data so managers can identify excess, shortages, incoming supply, and demand changes earlier.
Recent Posts
-
 NetSuite Alternative With Built-In WMS: When a Unified ERP-WMS Stack Makes Sense
 -
 B2B Payment Terms in ERP: Credit, Due Dates, Deposits, and Order Release
 -
 Best ERP Software for Consumer Goods Brands
 -
 Wholesale Inventory-to-Sales Statistics: What U.S. and Canadian Distributors Can Learn From Current Data
 -
 Product Bundle Overselling: Why It Happens and How to Stop It