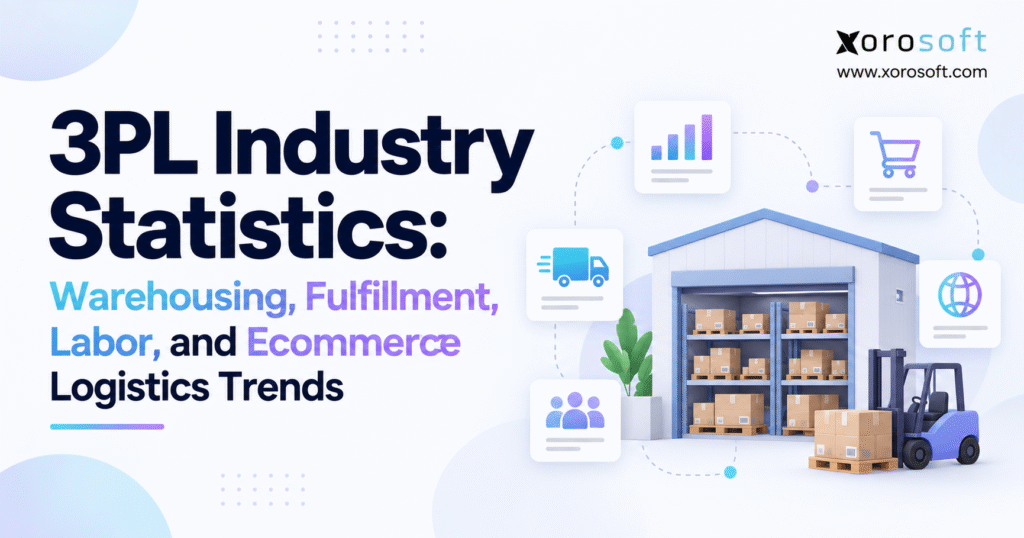
Here you’ll find an overview of important 3PL industry statistics.
1. Why Fulfillment Decisions Are Getting Harder
1.1 More Locations Create More Coordination Work
Third-party logistics has moved far beyond simple outsourced storage. Ecommerce brands, wholesalers, retailers, makers, and distributors now use a mix of company warehouses, 3PL sites, marketplace stock, parcel carriers, retail networks, suppliers, and several sales channels.
As those networks grow, the work becomes harder to control. Businesses must decide where stock should sit, which site should ship each order, how much warehouse space they need, and which system should hold the most trusted stock balance.
Current 3PL industry statistics help explain why those choices matter. Ecommerce keeps adding more orders. At the same time, warehouse labor remains a major cost, so worker output has a direct effect on margins.
Technology also plays a larger role. Warehouse systems, AI tools, reports, and system links now help teams plan stock, labor, shipping, and space.
As a result, outsourcing is no longer just a warehouse choice. The real question is whether the full network can keep stock accurate, orders moving, costs under control, and finance records in sync.
1.2 Market Data Needs Business Context
Industry data can be useful, but only when each number is read in the right way.
For example, a global 3PL market forecast is not the same as recorded sales. Likewise, a survey that reports AI use shows what the firms in that survey said. It does not prove that every 3PL has mature AI tools in daily use.
So, good analysis needs more than one type of data. Market size gives one view. Warehouse leasing, ecommerce sales, labor numbers, tech use, stock accuracy, and shipping results give others.
Together, these measures show where the industry is going. More importantly, they help product-based businesses see where growth may affect space, people, cash, systems, and customer service.
The best 3PL industry statistics are not simply the biggest numbers. They are the ones that help teams make better choices.
2. 3PL Industry Statistics at a Glance for 2026
2.1 Key 3PL Industry Statistics for 2026
The latest 3PL industry statistics point toward a large global sector, continued ecommerce growth, significant warehouse demand, and increasing adoption of analytics and AI.
| Metric | Latest Reported or Estimated Figure |
|---|---|
| Estimated global 3PL market, 2026 | $1.3567 trillion |
| Global 3PL market forecast, 2033 | $2.5022 trillion |
| Forecast global CAGR, 2026–2033 | 9.1% |
| U.S. ecommerce sales, Q2 2026 | $340.2 billion |
| Ecommerce share of U.S. retail, Q2 2026 | 17.1% |
| 3PL share of large U.S. industrial leases, 2025 | 36% |
| U.S. warehousing employment, August 2026 | About 1.84 million |
| Shippers reporting advanced analytics use | 80% |
| 3PLs reporting advanced analytics use | 81% |
| 3PL respondents reporting AI/ML use | 73% |
Grand View Research estimates the global third-party logistics market at approximately $1.3567 trillion in 2026 and projects it could reach $2.5022 trillion by 2033. Because those values come from commercial market research, the 2026 figure should be described as an estimate and the 2033 value as a forecast rather than audited global revenue. Grand View Research
2.2 How to Read 3PL Market Statistics Correctly
Different statistics answer different questions.
Market-size estimates describe the economic scope of services included in a research firm’s methodology. Government ecommerce data measures actual retail activity. Employment figures measure jobs within a defined industry classification, while logistics surveys describe the experiences and intentions of participating companies.
As a result, these data sets should complement one another rather than be blended into one metric.
Readers should also separate historical results, current estimates, and forecasts. A projected 2033 market value does not carry the same certainty as a measured quarterly ecommerce result.
2.3 What the Data Means for Operators
The relationship among the numbers matters more than any single statistic.
Ecommerce creates more orders. More orders require warehouse capacity, labor, transportation, technology, or outsourcing. Additional facilities then create more inventory states and transactions that must remain synchronized.
Therefore, logistics networks are becoming physically larger and digitally more complicated at the same time.
For operators, this means warehouse strategy cannot be evaluated only through storage rates or pick fees. Inventory accuracy, working capital, integration, returns, transportation, customer service, and financial reconciliation all shape total logistics performance.
3. The Third-Party Logistics Market Is Still Expanding
3.1 Global 3PL Industry Statistics and Market Size
One of the most common questions surrounding 3PL industry statistics is how large the worldwide market has become.
Current commercial research places third-party logistics comfortably above one trillion dollars annually. However, market definitions differ. Depending on methodology, estimates can include freight forwarding, transportation management, warehousing, distribution, international logistics, and value-added services.
Consequently, two credible research organizations can produce different market totals without either figure necessarily being incorrect. One may use a broader transportation definition, while another may emphasize contract logistics and warehousing.
The underlying direction is nevertheless significant. Outsourced logistics has become embedded across retail, manufacturing, ecommerce, wholesale distribution, and consumer-product supply chains.
Moreover, outsourcing is rarely all-or-nothing. A company may operate an internal distribution center while using 3PL providers for selected regions, channels, seasonal overflow, or specialized services.
This matters because market growth represents demand for logistics capabilities, not a universal move away from internal operations.
3.2 U.S. and North American 3PL Market Trends
North America remains a major logistics market because of its geography, high ecommerce penetration, retail footprint, manufacturing base, transportation infrastructure, and cross-border trade.
Nevertheless, a growing 3PL market does not mean every business should outsource more fulfillment.
The correct model depends on volume, product dimensions, seasonality, service expectations, labor availability, warehouse costs, inventory turns, geographic reach, and the level of operating control a company wants to retain.
A business with highly predictable regional demand may generate stronger economics from a dedicated facility. By contrast, another company with seasonal demand across several regions may benefit from external capacity.
These 3PL industry statistics are therefore most useful when businesses compare broad market growth with the economics and service requirements of their own fulfillment networks.
4. What 3PL Industry Statistics Reveal About Warehouse Capacity
4.1 3PL Warehousing Statistics Show Strong Facility Demand
Industrial leasing provides one of the clearest physical signals behind outsourced logistics demand.
CBRE’s 2026 U.S. Industrial & Logistics Occupier Survey found that 3PL providers represented 36% of bulk leases for facilities of at least 100,000 square feet during 2025. In addition, more than 32% of surveyed occupiers planned to increase their use of third-party logistics providers over the following three years. CBRE
Those figures highlight an important distinction. Outsourcing does not eliminate warehouse demand. Instead, responsibility for operating the building may move from a retailer, manufacturer, or distributor to an external logistics provider.
Consequently, 3PL networks allow businesses to add capacity without directly operating every facility.
However, physical expansion creates another responsibility. Inventory must still be allocated, replenished, reconciled, and tracked across the larger network.
4.2 Warehouse Capacity Trends Behind 3PL Industry Statistics
Prologis reported 66 million square feet of U.S. logistics net absorption during Q2 2026, its strongest quarter since 2022. The firm’s outlook also pointed to annual absorption exceeding new completions. Prologis Research
For warehouse planners, this reinforces the importance of early capacity decisions.
Location influences delivery time, while labor availability affects operating cost. Parcel access, highway connectivity, dock configuration, yard capacity, clear height, available power, and automation compatibility can also determine whether a facility fits the operation.
As a result, 3PL industry statistics around facility demand should encourage businesses to plan before their existing network reaches its limit.
Waiting until capacity becomes urgent can reduce both facility choice and negotiating flexibility.
5. What 3PL Industry Statistics Reveal About Ecommerce Fulfillment
5.1 Ecommerce Logistics Statistics Show Higher Transaction Intensity
Ecommerce remains one of the strongest drivers behind fulfillment complexity.
The U.S. Census Bureau estimated adjusted retail ecommerce sales of $340.2 billion in Q2 2026. Ecommerce represented 17.1% of adjusted U.S. retail sales, while quarterly ecommerce sales increased 12.2% compared with Q2 2025. U.S. Census Bureau
Those figures matter because ecommerce creates a different warehouse workload from traditional bulk distribution.
A wholesale facility may ship cases or pallets to a relatively small group of accounts. By comparison, a direct-to-consumer operation can process thousands of orders containing only one or two products.
Consequently, transaction counts can increase much faster than physical unit volume.
Order release, picking, packing, labeling, carrier integration, tracking, returns, and inventory updates all become more important as digital activity grows.
5.2 Smaller Orders Create More Fulfillment Touchpoints
The economics of smaller orders differ because the warehouse performs more activity for every unit shipped.
One pallet shipment can require relatively few transactions. Selling the same quantity as individual ecommerce orders may require hundreds of picks, cartons, labels, shipment confirmations, and tracking events.
Moreover, a single inventory error can generate several additional tasks.
If an item appears available but is missing physically, employees must investigate the discrepancy, adjust inventory, change the order, communicate with the customer, and possibly create another shipment.
For this reason, fulfillment speed cannot be separated from inventory accuracy.
5.3 Omnichannel Fulfillment Trends in 3PL Industry Statistics
Complexity rises again when Shopify, Amazon, wholesale, retail, and EDI accounts all consume the same stock.
A Shopify consumer may place an order while a wholesale customer sends an EDI purchase order. Meanwhile, a marketplace can consume another portion of available inventory.
Without reliable synchronization, the business can effectively promise the same units twice.
The Xorosoft ERP app for Shopify provides one example of connecting storefront transactions with wider ERP, inventory, order, and fulfillment workflows.
Ultimately, the 3PL industry statistics surrounding ecommerce matter because digital growth increases the number of transactions that must remain synchronized, not simply the number of cartons leaving the warehouse.
6. Warehouse Labor Trends Behind 3PL Industry Statistics
6.1 Warehouse Labor Statistics Show the Scale of the Workforce
Automation continues to expand, yet warehouse operations remain highly dependent on people.
The U.S. Bureau of Labor Statistics reports roughly 1.84 million employees in the warehousing and storage sector in 2026. The industry also includes substantial numbers of stock clerks, material movers, lift-truck operators, shipping and receiving staff, supervisors, and distribution managers. U.S. Bureau of Labor Statistics
Because the workforce is so large, relatively small productivity gains can create meaningful financial effects.
Headcount alone, however, reveals very little about efficiency. Two facilities with similar staffing can produce very different throughput depending on layout, slotting, replenishment, training, product profile, scanning, automation, and operating discipline.
Therefore, warehouse labor statistics need to be evaluated in relation to completed work.
6.2 Productivity Matters More Than Wage Rate Alone
Consider two facilities processing similar daily volume.
The first warehouse pays lower hourly wages but depends on long walking routes, paper picking, repeated searches, weak replenishment, and frequent inventory corrections. The second pays somewhat more but uses directed tasks, barcode scanning, better slotting, and structured exception handling.
Despite the wage difference, the second operation may have a lower cost per order.
For that reason, operators should track orders per labor hour, units picked per hour, receiving productivity, overtime, replenishment time, and errors.
For inventory-driven businesses operating internal facilities, XoroWMS is one example of warehouse software designed around receiving, inventory control, fulfillment, and warehouse execution.
The key lesson from these 3PL industry statistics is that labor cost should be measured against output, accuracy, and service—not hourly wages alone.
7. Volume Growth Does Not Guarantee Profitability
7.1 3PL Fulfillment Statistics Separate Activity From Margin
Extensiv’s Third-Party Logistics Warehouse Benchmark Report found that more than 70% of participating 3PL warehouses reported order-volume growth. Yet higher volume did not automatically translate into stronger profitability. Extensiv
The reason becomes clear inside warehouse operations.
A new customer may introduce custom packaging, kitting, retailer labels, returns, projects, additional reporting, unusual storage rules, or complicated billing.
As those requirements accumulate, workload can increase faster than profitable revenue.
Therefore, 3PL industry statistics need to be interpreted alongside customer complexity, labor requirements, service mix, and billing accuracy.
Higher order volume looks positive in isolation. However, growth creates value only when the provider understands the operational effort required to support it.
7.2 A Balanced KPI Scorecard Matters
A strong fulfillment scorecard should combine service performance with economic performance.
| KPI | What It Measures |
|---|---|
| Inventory accuracy | Physical inventory versus system inventory |
| Order accuracy | Correct products and quantities shipped |
| On-time shipment | Whether execution meets SLA |
| Order cycle time | Time from order release to shipment |
| Cost per order | Total fulfillment economics |
| Orders per labor hour | Workforce productivity |
| Return rate | Product, customer, or fulfillment issues |
| Dock-to-stock time | Receiving and inventory availability speed |
The correct benchmark depends heavily on the operating profile.
Furniture, apparel, food, industrial products, and consumer electronics all create different warehouse work.
Consequently, comparable peer benchmarks matter more than broad industry averages.
8. AI and Analytics Trends in 3PL Industry Statistics
8.1 3PL Technology Trends Show High Adoption
Technology has become one of the strongest themes within recent 3PL industry statistics.
The 2026 Annual Third-Party Logistics Study reported advanced analytics usage among 80% of shipper respondents and 81% of 3PL respondents. Meanwhile, 67% of shippers and 73% of 3PLs reported using AI or machine-learning solutions. Annual Third-Party Logistics Study
Those percentages are significant, although adoption can describe very different levels of maturity.
One organization may use sophisticated production models. Another might classify a limited pilot or embedded feature as AI.
Accordingly, operators should ask what business decision the technology improves rather than focusing on the technology label alone.
8.2 Operational AI Needs a Clear Business Decision
The strongest applications usually connect directly to measurable decisions.
Demand forecasting can improve replenishment. Network optimization can help determine where stock should sit. Warehouse analytics can identify late orders, unusual inventory movement, labor constraints, or capacity problems.
Transportation intelligence can also support route and carrier decisions.
Moreover, automated exception detection can reduce the amount of routine data employees must review before finding a problem.
Still, the objective is not automation for its own sake. Technology creates useful leverage when it improves availability, service level, labor productivity, working capital, or transportation performance.
8.3 Reliable Data Must Come Before Reliable AI
Artificial intelligence cannot correct an unreliable transactional foundation.
If purchase orders, inventory adjustments, shipments, returns, and channel transactions disagree, analytical output inherits those inconsistencies.
Therefore, data quality remains a prerequisite for useful AI.
Xorosoft’s ERP MCP Server reflects the broader move toward allowing authorized AI systems to work with structured operational ERP information.
For logistics teams, the lesson behind these 3PL industry statistics is clear: better AI starts with better operational data.
9. Inventory Visibility Lessons From 3PL Industry Statistics
9.1 Outsourcing Does Not Remove Inventory Accountability
A business can outsource receiving, storage, picking, packing, and shipping. Nevertheless, it still owns the commercial and financial consequences of inaccurate inventory.
As a fulfillment network expands, stock may sit in company warehouses, 3PL facilities, marketplace fulfillment centers, retail locations, goods in transit, returns areas, or overflow sites.
Each location introduces another inventory state.
Furthermore, quantity alone is not enough. Operators must distinguish available, allocated, picked, packed, damaged, quarantined, returned, inbound, and in-transit stock.
Without that visibility, a healthy-looking on-hand balance can create a false impression of what is actually available to sell.
9.2 Multiple Systems Create Conflicting Balances
Inventory problems become especially visible when several applications maintain separate quantities.
An ecommerce platform may show one balance while the 3PL portal shows another. At the same time, an ERP may still be waiting for a shipment confirmation, return receipt, or adjustment.
Eventually, employees begin reconciling these numbers manually.
That process may work at low volume. However, it becomes increasingly fragile as warehouses, channels, SKUs, and order counts expand.
Consequently, 3PL industry statistics showing network growth also point toward a growing systems challenge.
9.3 Integration Lessons From 3PL Industry Statistics
A strong architecture does not require every logistics partner to use identical software.
Instead, it requires clear transaction ownership and dependable system connections.
The Xorosoft integrations ecosystem supports connections across ecommerce, marketplaces, EDI, fulfillment, shipping, and other operational applications.
Meanwhile, XoroONE provides a broader environment for inventory-driven businesses coordinating areas such as inventory, purchasing, accounting, ecommerce, and warehouse operations.
The objective is straightforward: orders should not require repeated manual entry, inventory movements should remain traceable, and fulfillment confirmations should return quickly enough to keep availability accurate.
10. 3PL vs In-House Fulfillment Needs a Total-Cost View
10.1 When 3PL Fulfillment Has the Stronger Business Case
A third-party provider can be attractive when a company needs geographic coverage faster than it can establish internal facilities.
Seasonal businesses may also benefit because external capacity can absorb large volume swings without requiring permanent infrastructure. Likewise, specialist providers may bring carrier relationships, compliance knowledge, labor resources, or operating processes that would take time to build internally.
However, businesses should evaluate the complete commercial structure.
Storage, receiving, picking, packing, projects, account management, returns, minimum charges, transportation, technology, and value-added work can all influence final cost.
Therefore, a low headline fulfillment fee does not automatically make outsourcing cheaper overall.
10.2 When Internal Fulfillment Can Perform Better
In-house fulfillment may be more attractive when volume supports dedicated infrastructure, products require specialized handling, or warehouse execution creates meaningful differentiation.
Direct control can also matter when packaging, customization, inspection, or unusual shipping workflows form part of the customer experience.
| Decision Factor | 3PL | In-House |
|---|---|---|
| Initial infrastructure | Usually lower | Usually higher |
| Operational control | Shared | Direct |
| Geographic expansion | Often faster | Requires capacity |
| Labor management | Provider managed | Internal |
| Seasonal flexibility | Often higher | Capacity dependent |
| Process customization | Contract dependent | Highly controllable |
| Inventory visibility | Integration dependent | System dependent |
For many companies, 3PL industry statistics support a hybrid discussion rather than a binary choice. Internal warehouses and outsourced facilities can serve different roles within the same network.
11. Execution and Orchestration Require Different Models
11.1 What a 3PL Actually Controls
A third-party logistics provider usually performs defined logistics activities.
Depending on the agreement, those services may include storage, order fulfillment, transportation, freight management, returns, kitting, labeling, assembly, or other value-added work.
Because a 3PL operates close to physical execution, operational measures become essential.
Inventory accuracy, shipment performance, labor productivity, turnaround time, and SLA compliance help determine whether the relationship is working as intended.
However, the customer still needs access to enough information to evaluate those measures.
Therefore, reporting requirements, integrations, data ownership, and exception processes should be discussed when selecting a logistics provider rather than added later.
11.2 Where 4PL Orchestration Fits
A fourth-party logistics model generally operates at a broader level.
Rather than performing every warehouse or transportation activity itself, a 4PL may coordinate several 3PLs, carriers, technology systems, and regional logistics partners.
That structure can simplify a complicated global network. Nevertheless, another management layer introduces additional governance requirements.
Inventory ownership, reporting standards, system responsibility, cost reconciliation, escalation, and exception management all need clear rules.
The meaningful distinction is therefore not just terminology. It is the difference between executing logistics activity and orchestrating a wider logistics ecosystem.
12. Product Categories Change the Operating Model
12.1 Ecommerce and Consumer Goods Need Transaction Accuracy
Apparel and consumer-products businesses often combine large SKU assortments with launches, promotions, seasonal demand, returns, and several sales channels.
As a result, their fulfillment requirements frequently emphasize fast each-pick workflows, accurate inventory synchronization, parcel execution, and effective reverse logistics.
Even a small error rate can create significant customer-service cost when daily order volume is high.
Promotions can also create uneven demand. A limited number of SKUs may suddenly represent a large percentage of daily orders, increasing pressure on slotting, replenishment, and labor planning.
Therefore, the warehouse needs enough flexibility to respond without losing accuracy.
12.2 Wholesale Adds EDI and Retail Compliance
Wholesale distribution creates a different operating profile.
Orders may ship in cases or pallets, while large retail customers can require EDI, advanced shipment notices, routing-guide compliance, special labels, delivery appointments, and customer-specific pricing.
Consequently, a facility optimized only for direct-to-consumer orders may not be ideal for wholesale execution.
The same physical inventory can serve both channels, yet each one may require different allocation, labeling, documentation, and shipping rules.
The industries supported by Xorosoft illustrate how inventory requirements differ across apparel, wholesale distribution, furniture, food and beverage, manufacturing, sporting goods, and other inventory-driven sectors.
12.3 Food and Manufacturing Add Traceability
Food operations may require lot tracking, expiry management, FEFO allocation, quality holds, recall readiness, and detailed traceability.
Manufacturers introduce another layer through raw materials, bills of materials, production orders, finished goods, and production planning.
Therefore, broad 3PL industry statistics should not become universal operating targets.
The most useful benchmark reflects a comparable product mix and fulfillment profile.
Businesses evaluating how technology and process design work in real operating environments can also review Xorosoft customer case studies rather than relying entirely on generic feature lists.
In practice, 3PL industry statistics become more meaningful when businesses compare them with peers that share similar products, channels, compliance requirements, and fulfillment workflows.
13. 3PL Industry Growth Exposes Disconnected Systems
13.1 Operational Problems Usually Appear Before an ERP Project
Businesses rarely replace systems because the global logistics market is expanding.
Instead, operational friction usually appears first.
Inventory totals stop agreeing. Buyers maintain spreadsheets. 3PL balances live in separate portals. Shopify and wholesale orders compete for the same stock. Finance relies on exports and manual adjustments to reconcile fulfillment activity.
Initially, employees compensate by adding more manual controls.
However, those workarounds become less reliable as transaction volume grows. Every new warehouse or channel creates more opportunities for duplicate entry, delayed information, and inconsistent balances.
For operators, this is another practical implication of 3PL industry statistics showing network expansion: scaling physical capacity without scaling transaction control simply creates another bottleneck.
13.2 ERP Requirements Behind 3PL Industry Growth
ERP evaluation should therefore begin with workflows rather than a generic feature checklist.
Teams need to map how orders enter, where stock is held, how purchasing decisions are made, how external warehouses communicate transactions, how transfers work, how returns are processed, and how those activities reach accounting.
XoroERP provides one model for inventory-driven businesses coordinating operational and financial processes.
Still, ERP selection should depend on business fit.
Implementation approach, integrations, reporting, ownership requirements, warehouse complexity, accounting needs, and expected growth all deserve attention before a platform decision is made.
13.3 Platform Comparisons Need Business Context
Software comparisons become more important as the operating model gets more complex.
Teams evaluating larger platforms can review the Xorosoft vs NetSuite comparison as one input when assessing implementation model, platform complexity, operational fit, and system requirements.
However, no comparison page should replace detailed workflow analysis.
The final choice should reflect the company’s inventory model, ecommerce channels, fulfillment network, manufacturing requirements where relevant, reporting needs, accounting structure, and integrations.
The best ERP is ultimately the one that supports the operating model without adding unnecessary complexity around the workflows that matter most.
14. Working Capital Implications of 3PL Industry Trends
14.1 More Locations Can Increase Inventory Investment
A logistics network is also a working-capital network.
Adding facilities can improve service because products sit closer to customers. However, every additional location can require more safety stock.
Suppose a company previously held one buffer quantity for an SKU in a central warehouse. After expanding into three regions, management may decide that each location needs enough stock to protect its local service level.
Total inventory investment can therefore increase even when company-wide demand remains unchanged.
For that reason, 3PL industry statistics around warehouse expansion should be considered alongside inventory carrying cost.
Faster delivery can create real value, but that benefit must be weighed against the working capital tied up in distributed inventory.
14.2 Replenishment Gets Harder as the Network Expands
Demand is rarely distributed evenly across a logistics network.
One warehouse may sell an item rapidly while another accumulates excess stock. Seasonal patterns, promotions, channel differences, and regional preferences can change those imbalances over time.
Poor positioning can therefore create overstock and stockouts simultaneously.
Purchasing teams need visibility into available inventory, inbound purchase orders, allocations, transfers, sales velocity, supplier lead times, and planned demand before placing replenishment orders.
Without that information, adding facilities can amplify an existing forecasting or purchasing problem.
The network should therefore be managed as one inventory system even when several organizations physically hold the products.
15. Financial Implications of 3PL Fulfillment
15.1 Physical Movement Creates Financial Events
Warehouse activity does not end when a carton leaves the dock.
Receipts change inventory quantities and values. Transfers change where stock sits. Shipments influence revenue and cost recognition. Returns can affect both physical availability and financial balances.
Meanwhile, freight, storage, and fulfillment charges influence product, customer, and channel profitability.
Consequently, operations and finance depend on many of the same underlying transactions.
A warehouse can achieve excellent shipment performance while the business still struggles to close the books if cost and inventory information arrives late.
These 3PL industry statistics therefore have an accounting implication as well: more outsourced activity means more external transactions that must reconcile accurately with financial systems.
15.2 Disconnected Records Slow Reconciliation
Problems become visible when each department trusts a different application.
Operations may rely on the WMS or 3PL portal, while finance depends on ERP balances. Ecommerce may maintain another stock quantity, and spreadsheets can contain adjustments that have not reached the central system.
At month-end, employees must reconstruct the relationship between physical movement and financial records.
As transaction counts rise, that process becomes slower and riskier.
Therefore, integration has a direct financial-control impact rather than being solely a warehouse concern.
15.3 Connected Systems Improve Operational Control
Businesses evaluating logistics improvements should consequently consider the wider operating environment.
The Xorosoft solutions platform spans inventory, warehouse operations, purchasing, accounting, forecasting, ecommerce, manufacturing, and reporting.
This broader view matters because warehouse speed represents only one part of business performance.
A facility can ship quickly while the company still carries excess inventory, misses charges, struggles with allocations, or spends days reconciling transactions.
Operational visibility and financial visibility should therefore be designed together.
16. Common Mistakes When Reading 3PL Industry Statistics
16.1 Separate 3PL Market Forecasts From Historical Data
A projected market value for 2030 or 2033 is not recorded industry revenue.
Instead, it represents a model built from assumptions about future demand, economic activity, transportation, trade, and technology.
Therefore, 3PL industry statistics should clearly label historical results, estimates, and forecasts.
That distinction improves credibility. It also helps readers avoid comparing a measured result with a future projection as though both carried the same level of certainty.
For operators, forecasts are useful for understanding direction. They are less useful when treated as precise predictions of what an individual business will experience.
16.2 Use Comparable 3PL Benchmarks
Third-party logistics is not defined identically in every report.
One source may include significant freight-forwarding and transportation-management activity. Another may focus more heavily on warehousing, distribution, or contract logistics.
Likewise, picking rates, return rates, cost per order, inventory turns, and warehouse capacity vary dramatically by product category and fulfillment model.
A furniture facility cannot be benchmarked directly against a high-SKU apparel warehouse.
Accordingly, 3PL industry statistics should provide context rather than dictate universal performance targets.
The strongest benchmarking process combines external research with internal history, comparable peer operations, SKU characteristics, order profiles, customer requirements, and the company’s own financial objectives.
17. What 3PL Industry Statistics Suggest About the Next Phase of Logistics
17.1 3PL Outsourcing Trends Will Remain Important
Current leasing and occupier data indicate that third-party providers will remain significant participants in warehouse expansion.
For many companies, external capacity offers a faster route into new markets than establishing a complete internal distribution network.
Nevertheless, physical flexibility increases dependence on provider performance, integration, and data quality.
Therefore, the network design process must consider both where inventory sits and how every location communicates with the rest of the business.
A strong provider relationship can increase flexibility. A poorly integrated provider can increase manual work even when the physical operation performs well.
17.2 Technology Signals in 3PL Industry Statistics
Dashboards will remain useful, but logistics technology is increasingly moving from describing operations toward helping teams decide what to do next.
Which SKU requires replenishment? Which orders risk missing SLA? Where is stock accumulating? Which warehouse is approaching capacity? Should inventory move between regions?
Analytics creates more value when it answers these questions early enough for people to act.
Similarly, AI can surface exceptions that employees might otherwise discover only after manually reviewing several reports.
The value therefore lies in better decisions rather than simply producing more data.
17.3 Integration Is Becoming a Capacity Issue
A logistics network can have enough physical warehouse capacity and still perform poorly.
Conflicting inventory balances, delayed order transmission, missing shipment confirmations, and disconnected financial records create friction regardless of square footage.
Thus, one of the strongest messages behind current 3PL industry statistics is that physical logistics and digital architecture can no longer be planned independently.
Future scalability depends partly on system capacity: the ability to process more orders, locations, integrations, inventory states, and exceptions without creating a proportional increase in manual work.
Taken together, 3PL industry statistics show that future logistics scalability will depend on both physical capacity and the systems needed to coordinate inventory, orders, providers, and financial transactions.
18. Conclusion: Turn 3PL Industry Statistics Into Better Fulfillment Decisions
18.1 Start With the Operating Model
Current 3PL industry statistics point toward a logistics environment that is large, distributed, and increasingly technology-dependent.
Third-party providers continue to absorb substantial warehouse demand. Ecommerce keeps increasing transaction activity. Labor productivity remains economically significant, while AI and analytics are moving deeper into planning and execution.
None of those trends, however, automatically tells a business whether it should outsource another warehouse.
The better decision begins with the operating model.
Where does inventory sit today? Which system knows what is actually available? How quickly do external warehouse transactions reach the central record? Can purchasing see every location? Can finance reconcile fulfillment activity without rebuilding the data manually?
These questions convert market data into practical operating decisions.
18.2 Ask Operational Questions Before Adding Capacity
Businesses should also evaluate the trade-offs created by network growth.
Another facility can shorten transportation distance while increasing safety stock. Outsourcing can reduce internal warehouse responsibility while increasing dependence on provider execution. Faster delivery can improve customer experience, yet that benefit disappears if inventory availability becomes unreliable.
Therefore, additional capacity should not be treated as a standalone solution.
Before expanding, operators should determine whether the real constraint is space, labor, inventory positioning, systems integration, purchasing, or process design.
Solving the wrong constraint can increase cost while leaving the original service problem untouched.
18.3 Match the Fulfillment Model to Business Requirements
For some businesses, deeper outsourcing will be the right next step. Others will benefit from bringing selected processes in-house.
Many growing companies will operate hybrid networks combining internal warehouses, third-party providers, marketplace inventory, and regional fulfillment facilities.
Whatever structure is chosen, one requirement remains consistent: the business needs a reliable operational picture across every location.
Otherwise, additional capacity simply creates more places where inventory and transaction data can become fragmented.
The fulfillment model should therefore follow the company’s economics and operating requirements rather than a general market trend.
18.4 Build the System Layer Around the Network
A strong logistics strategy ultimately connects fulfillment with inventory management, ERP architecture, purchasing, ecommerce, forecasting, reporting, and financial controls.
Physical fulfillment should not be treated as an isolated warehouse function.
As complexity increases, businesses need systems that connect orders with inventory, inventory with replenishment, fulfillment with accounting, and operational transactions with management reporting.
For inventory-driven businesses reaching that stage, connected ERP and warehouse architecture becomes increasingly important.
If Shopify, 3PL, warehouse, purchasing, inventory, and accounting workflows are becoming difficult to coordinate as the business grows, contact Xorosoft to evaluate the operating model required for the next stage of growth.
3PL Industry Statistics FAQs
What do 3PL industry statistics show about market growth?
Current data shows continued growth in outsourced logistics, warehouse demand, ecommerce fulfillment, and technology adoption. However, market forecasts should always be separated from measured historical data.
When should a business use a 3PL?
A 3PL makes sense when geographic expansion, seasonal demand, warehouse capacity, labor requirements, or fulfillment complexity becomes difficult to manage efficiently in-house.
How does ecommerce affect 3PL fulfillment?
Ecommerce increases small-order volume, picking activity, parcel shipping, returns, inventory updates, and delivery expectations. As a result, fulfillment accuracy and system integration become more important.
What warehouse KPIs should companies track with a 3PL?
Track inventory accuracy, order accuracy, on-time shipment, cost per order, order cycle time, returns, dock-to-stock time, and labor productivity.
How does a 3PL affect inventory visibility?
Using a 3PL adds another inventory location and transaction source. Reliable ERP or inventory integration helps synchronize stock, orders, shipments, returns, and adjustments.
What is the difference between a 3PL and a 4PL?
A 3PL usually executes logistics services, while a 4PL coordinates a broader network of logistics providers, carriers, systems, and supply chain partners.
When should a company upgrade its ERP or WMS?
Consider upgrading when inventory differs across systems, purchasing relies on spreadsheets, 3PL reconciliation is manual, or warehouse and ecommerce operations lack real-time visibility.
Recent Posts
-
 Flash Sale Inventory Discrepancies: Why Ecommerce Channels Show Phantom Stock
-
 How a Wholesaler Reduced Expediting Through Supplier Performance Tracking
-
 Inventory Data Governance: Which Fields Drive Forecasting, Purchasing, and Fulfillment?
-
 How Many SKUs Do You Need Before an ERP Becomes Necessary?
-
 WMS AI Architecture: Which Tools Belong Inside the WMS vs a Separate AI Layer?