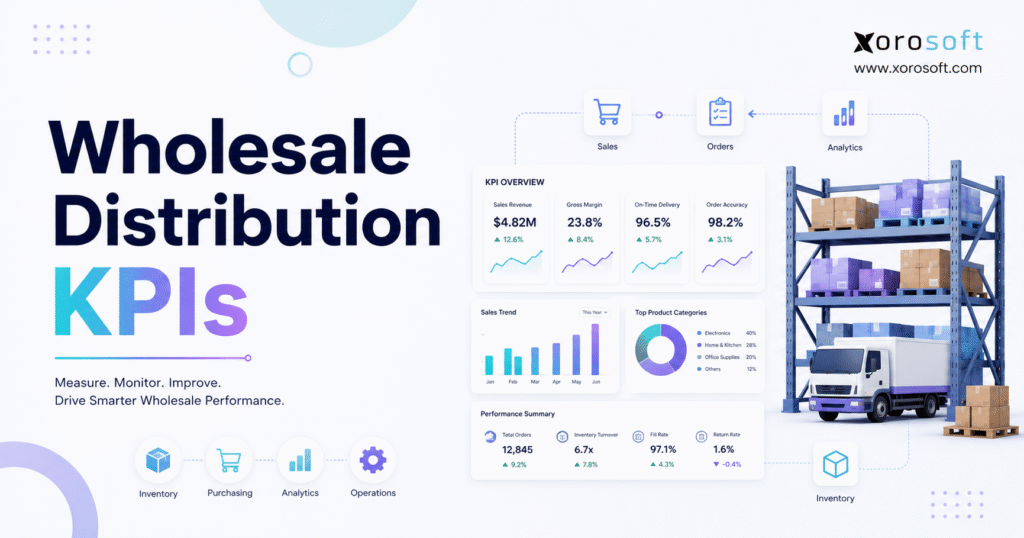
To succeed in the industry, it’s vital to understand key Wholesale Distribution KPIs and how they impact your business.
1. Why Wholesale Distribution KPIs Matter
Wholesale Distribution KPIs help operators see whether growth is creating stronger profit, healthier inventory, better service, and more predictable cash flow. Without those measures, a distributor may celebrate higher sales while margin falls, stock ages, backorders increase, and warehouse costs rise. Therefore, the purpose of a KPI system is not to create more reports. Instead, it should expose the few operational conditions that require a decision.
Distribution businesses manage connected variables. Purchasing affects availability, fulfillment affects retention, and every operational decision affects accounting. Consequently, one isolated number rarely explains the situation. A strong scorecard connects the outcome with its cause.
Official U.S. wholesale trade data shows the scale of sales and inventory moving through the sector. However, national figures cannot become company targets without context. Each distributor needs benchmarks that reflect its products, lead times, channels, and cash constraints.
1.1 Wholesale Distribution KPIs vs General Metrics
A metric records activity, while a KPI measures progress toward a business objective. For example, “orders entered” describes workload. By contrast, “perfect orders delivered at an acceptable cost” connects activity to service and profitability.
Every KPI should include five elements: a documented formula, a responsible owner, a reporting frequency, a target or tolerance, and a required action when performance moves outside the acceptable range. Otherwise, the dashboard becomes a collection of numbers that people observe but do not manage.
1.2 Which Businesses Need Distribution Performance Metrics?
A formal framework becomes especially useful when a distributor operates several warehouses, sells through Shopify or Amazon, handles EDI customers, manages customer-specific pricing, imports products, or coordinates light manufacturing. Likewise, seasonal and high-SKU businesses need stronger segmentation because company-wide averages often hide product-level risk.
2. How to Build a Wholesale Distribution KPI Framework
Wholesale Distribution KPIs work best when leaders start with decisions. First, list the recurring questions that influence purchasing, cash, labor, service, and pricing. Next, select the minimum measures needed to answer them. Finally, assign an owner who can investigate exceptions and coordinate action.
2.1 Separate Wholesale KPI Outcomes From Diagnostic Signals
Lagging indicators report results that have already occurred. Gross margin, inventory write-offs, customer retention, and cash conversion belong in this group. Leading indicators, however, reveal conditions that may shape those results. Forecast bias, supplier delay, backorder aging, inventory discrepancies, and picking errors can provide earlier warning.
| Leading signal | Likely downstream result |
|---|---|
| Forecast error | Stockouts or excess inventory |
| Supplier lead-time variance | Lower fill rate and more backorders |
| Inventory inaccuracy | Failed allocations and delayed orders |
| Picking errors | Returns, credits, and customer complaints |
| Aging inventory | Lower GMROI and future write-offs |
Therefore, executives need outcome measures, while functional teams need diagnostic measures. If both groups review the same oversized dashboard, neither group receives the level of detail required for action.
2.2 Assign Owners to Wholesale Distributor KPIs
Finance may own gross margin, working capital, and cash conversion. Meanwhile, purchasing should own supplier delivery, purchase-price variance, and replenishment exceptions. Warehouse leaders should manage receiving time, picking accuracy, throughput, and cost per order. Sales and operations can jointly own fill rate, customer profitability, and retention.
2.3 Set the Right Review Frequency for Distribution KPIs
Daily reviews should focus on changeable exceptions such as overdue receipts, short picks, shipment risk, and stockouts. Weekly reviews can cover fill rate, backorders, supplier delays, and productivity. Monthly reviews should examine turnover, GMROI, margin, customer profitability, and cash conversion.
3. Core Wholesale Distribution KPI Scorecard
A useful starting scorecard balances profit, cash, inventory, supplier, warehouse, fulfillment, and customer performance. Although every business will adjust the list, the following Wholesale Distribution KPIs cover the most common operating questions.
| Category | KPI | Main question |
| Finance | Gross profit margin | Are sales producing enough product margin? |
| Finance | Cash conversion cycle | How long does operating cash remain tied up? |
| Inventory | Inventory turnover | Is inventory moving productively? |
| Inventory | GMROI | Does inventory generate enough gross margin? |
| Inventory | Inventory accuracy | Can teams trust the recorded stock position? |
| Supplier | Supplier on-time delivery | Are vendors meeting confirmed dates? |
| Warehouse | Picking accuracy | Are workers selecting the right items and quantities? |
| Warehouse | Cost per order | What does fulfillment consume? |
| Fulfillment | Fill rate | How much demand can the business satisfy immediately? |
| Fulfillment | Perfect order rate | How often does the complete process succeed? |
| Planning | Forecast accuracy | How closely does planned demand match actual demand? |
| Customer | Customer profitability | Which relationships create economic value? |
4. Financial Wholesale Distribution KPIs for Profit and Cash
Financial measures translate operations into profit and liquidity. Therefore, they should connect to inventory, purchasing, fulfillment, and customer data.
4.1 Gross Profit Margin as a Distribution KPI
Gross profit margin = (Revenue − cost of goods sold) ÷ revenue × 100
Gross margin reveals how much revenue remains after product cost. However, one company-wide percentage can hide discounting, landed-cost increases, low-margin customers, and category mix changes. Therefore, review margin by SKU, product family, customer, salesperson, warehouse, and channel.
A declining result should trigger a structured investigation. First, separate price changes from unit-cost changes. Next, review rebates, discounts, freight recovery, returns, and landed-cost allocations. Finally, identify whether the issue affects a few accounts or the wider assortment.
4.2 Contribution Margin for Wholesale Distributors
Contribution margin deducts the variable costs required to serve an order or customer. Those costs may include outbound freight, marketplace fees, sales commissions, special handling, payment charges, and returns. Consequently, contribution margin often gives operators a more realistic view of customer value than gross margin alone.
4.3 Cash Conversion Cycle as a Distribution Performance Metric
Cash conversion cycle = Days inventory outstanding + days sales outstanding − days payable outstanding
The cash conversion cycle connects inventory, receivables, and supplier terms. Because distributors usually purchase products before customers pay, growth can consume cash even when the income statement shows a profit. Therefore, leaders should review all three components instead of treating inventory and collections as separate finance issues.
4.4 Customer Profitability KPIs for Wholesale Businesses
Customer profitability combines revenue, product cost, discounts, freight, commissions, returns, credit cost, and service effort. Moreover, the analysis should include the order profile. A customer that places many small orders may require more warehouse labor and administrative time than an account with the same revenue in fewer, larger orders.
5. Inventory KPIs for Wholesale Distribution
Wholesale Distribution KPIs become especially valuable when inventory consumes working capital. Nevertheless, the measures must balance speed with availability because higher turnover creates little value when fill rate collapses.
5.1 Inventory Turnover in Wholesale Distribution
Inventory turnover = Cost of goods sold ÷ average inventory
Turnover estimates how many times average inventory sells or moves during a period. Generally, a low result suggests slow movement, excess purchasing, weak demand, or an unbalanced assortment. Conversely, an unusually high result may indicate understocking, unstable replenishment, or repeated shortages.
5.2 Days Sales of Inventory for Distributors
Days sales of inventory = Average inventory ÷ cost of goods sold × number of days
DSI converts inventory investment into an estimated holding period. However, lower DSI does not always mean stronger performance. If availability or fill rate declines, the company may have reduced inventory too aggressively.
5.3 GMROI as a Wholesale Inventory KPI
GMROI = Gross margin dollars ÷ average inventory cost
GMROI shows how much gross margin the business generates for each dollar invested in average inventory. Therefore, it helps compare categories with different price points, sales volumes, and margin structures. A high-revenue category can still produce weak GMROI when it needs deep stock, heavy markdowns, or long holding periods.
5.4 Inventory Accuracy KPIs for Wholesale Distributors
Inventory accuracy = Correct counted records ÷ records counted × 100
Before using the formula, define what counts as correct. Some teams require exact unit agreement, while others also report tolerance-based accuracy. In addition, classify every variance by cause, such as receiving, putaway, picking, transfers, returns, damage, unit-of-measure errors, or unauthorized adjustments.
5.5 Stockout and Backorder Metrics in Wholesale Distribution
Stockout rate = Stockout events ÷ demand events × 100
Backorder rate = Backordered orders, lines, or units ÷ total orders, lines, or units × 100
State the denominator clearly because order, line, and unit measures can tell different stories. Then, segment the shortage by cause. Common reasons include forecast error, supplier delay, late purchasing, inaccurate stock, allocation rules, and unexpected demand.
5.6 Inventory Carrying Cost for Distributors
Carrying cost includes capital, storage, insurance, handling, shrinkage, and obsolescence. Therefore, finance should build a company-specific estimate instead of relying on a generic percentage.
5.7 Excess and Obsolete Inventory Metrics
Aging rules should reflect the product lifecycle. Apparel may require seasonal buckets, food needs expiry exposure, and industrial parts may remain sellable for years. Therefore, measure both time without movement and expected future demand.
6. Purchasing and Supplier KPIs for Wholesale Distributors
Supplier performance shapes availability, working capital, and customer service. Consequently, distributor metrics should measure both average performance and variability. A supplier with an acceptable average lead time can still create disruption when delivery dates vary widely.
6.1 Supplier On-Time Delivery KPIs
Supplier on-time delivery = Purchase-order lines received on time ÷ due lines × 100
Use the confirmed supplier date rather than an unapproved internal target. Also, decide how to treat early deliveries because premature receipts can create space and cash problems. When performance falls, review the supplier, item, shipping lane, and purchase-order type before escalating.
6.2 Supplier Fill Rate
Supplier fill rate = Quantity received on the first shipment ÷ quantity ordered × 100
This measure shows whether suppliers provide complete replenishment when promised. However, it should sit beside lead-time variance and defect rate. A supplier may eventually deliver every unit while still forcing backorders, split receipts, and extra receiving work.
6.3 Lead-Time Variance
Compare planned or confirmed lead time with actual lead time. Next, measure the spread around the average. A stable 20-day supplier may support better planning than a supplier that averages 15 days but ranges from 7 to 35 days.
6.4 Purchase-Price Variance
Purchase-price variance = (Actual price − expected price) × purchased quantity
7. Warehouse Distribution KPIs That Protect Service and Cost
Warehouse Distribution KPIs should connect speed, accuracy, labor, and cost. Otherwise, faster throughput may create mis-picks, damage, and rework.
7.1 Dock-to-Stock Time
Dock-to-stock time measures the elapsed period from arrival or unloading until inventory becomes available in its assigned location. Long delays may come from appointment congestion, inspections, missing purchase-order data, labeling, or putaway capacity. Therefore, break the total time into process stages rather than treating receiving as one block.
7.2 Picking Accuracy
Picking accuracy = Correct picks ÷ total picks × 100
7.3 Picks per Labor Hour
Picks per labor hour = Completed picks ÷ direct picking hours
Compare equivalent work. Piece picking, case picking, pallet picking, and value-added orders have different labor requirements. Similarly, separate paid hours from direct productive hours so leaders can distinguish process productivity from scheduling and attendance issues.
7.4 Cost per Order and Cost per Line
Cost per order = Allocated fulfillment cost ÷ orders shipped
Cost per line = Allocated fulfillment cost ÷ lines shipped
7.5 Capacity Utilization
Measure occupied usable capacity rather than theoretical building volume. Extremely high utilization can increase travel, congestion, replenishment, and safety risk. Therefore, review capacity beside throughput, order cycle time, and labor productivity.
7.6 Cycle-Count Performance
Track count completion, exact accuracy, value variance, and repeat discrepancies. An ABC program can count high-value or high-risk items more often. Meanwhile, repeated variances should trigger process correction rather than endless recounting.
A dedicated platform such as XoroWMS can connect barcode-driven warehouse activity with inventory and order workflows. However, technology improves visibility only when teams follow consistent receiving, movement, picking, packing, and counting processes.
8. Fulfillment and Customer-Service KPIs
Wholesale Distribution KPIs should measure the complete customer promise. Therefore, fulfillment dashboards need availability, accuracy, timing, condition, documentation, and cost.
8.1 Order Fill Rate
Fill rate can measure complete orders, order lines, or individual units. Because each version answers a different question, the dashboard should label the calculation clearly.
Line fill rate = Order lines fulfilled immediately ÷ total order lines × 100
For example, a distributor may show a high unit fill rate while many orders remain incomplete because one missing line affects each shipment. Consequently, leaders should review more than one fill-rate level when customer orders contain several products.
8.2 Perfect Order Rate
Perfect order rate = Perfect orders ÷ total orders × 100
A perfect order usually arrives on time, complete, damage-free, and with accurate documentation. However, the combined result does not reveal the failure source. Keep the component measures visible so teams can see whether delays, shortages, damage, pricing, or paperwork caused the problem.
8.3 On-Time In-Full Delivery
OTIF = Orders delivered by the agreed date and in full ÷ total orders × 100
Define the date carefully. It may refer to the customer-requested date, the promised date, or a contractually confirmed date. In addition, retail and EDI customers may impose routing, labeling, appointment, and documentation rules that deserve separate compliance measures.
8.4 Order Accuracy and Returns
Order accuracy can cover item, quantity, price, address, and documentation. Meanwhile, return rate should use reason codes so product defects, customer preference, shipping damage, and fulfillment errors do not enter one category.
8.5 Customer Retention
Retention is a lagging outcome influenced by service, availability, pricing, relationship quality, and competitive pressure. Therefore, review it with customer profitability. A retained account does not create value when pricing, freight, returns, or service demands eliminate contribution margin.
9. Sales, Channel, and Forecasting Measures
Sales growth looks positive until managers connect it with margin, working capital, and service cost. Therefore, Wholesale Distribution KPIs should show whether growth strengthens the operating model or increases complexity faster than profit.
9.1 Sales Growth and Average Order Value
Compare sales growth with units, price, customer count, margin, and returns. Likewise, a higher average order value may reflect inflation or product mix rather than stronger performance.
9.2 Channel Profitability
Wholesale, Shopify, Amazon, marketplace, and direct channels have different fees, freight, return patterns, and service requirements. Consequently, channel reporting should include contribution margin rather than revenue alone.
For Shopify-led businesses, the Xorosoft ERP listing on the Shopify App Store provides an external reference for the available Shopify connection. Nevertheless, operators should still test inventory synchronization, order flow, returns, bundles, locations, and exception handling against their real workflow before selecting any system.
9.3 Forecast Accuracy
Forecast accuracy measures the size of the difference between planned and actual demand. WAPE often handles mixed volumes more reliably than MAPE because low-volume items can create extreme percentages.
WAPE = Sum of absolute forecast errors ÷ sum of actual demand × 100
However, one company-wide result can hide large SKU and location errors. Therefore, segment the measure by category, location, customer, and planning horizon.
9.4 Forecast Bias
Bias shows whether forecasts consistently run above or below actual demand. Persistent over-forecasting can create excess stock, while under-forecasting can create shortages and emergency purchases. Accordingly, the planning team should review accuracy and bias together.
10. Designing a KPI Dashboard People Can Actually Use
The strongest dashboard gives each user enough context to recognize a problem, understand the cause, and decide what to do next.
10.1 Separate Executive and Operational Views
Executives need a concise scorecard covering margin, cash, inventory productivity, service, and major risks. Functional teams need deeper supplier, warehouse, customer, SKU, and transaction detail. Therefore, the executive view should link to diagnostic pages instead of attempting to show everything at once.
10.2 Add Context to Every KPI Card
Every card should show the formula, current result, target, variance, trend, owner, reporting period, and exception status. In addition, it should provide a drill-down path. A red number without a definition or action creates anxiety rather than control.
10.3 Use Daily, Weekly, and Monthly Views
| Daily exceptions | Weekly performance | Monthly outcomes |
| Stockouts | Fill rate | Inventory turnover |
| Overdue receipts | Backorder aging | GMROI |
| Picking errors | Supplier delays | Gross margin |
| Shipment risk | Labor productivity | Cash conversion cycle |
| Inventory discrepancies | Forecast exceptions | Customer profitability |
10.4 Connect Data Before Automating Reports
Disconnected systems often produce conflicting numbers. As a result, teams reconcile reports instead of managing performance. A connected platform such as XoroONE can bring inventory, purchasing, accounting, warehouse, forecasting, reporting, and ecommerce workflows into one environment.
Growing businesses may evaluate XoroERP after outgrowing accounting-first tools. Nevertheless, software cannot fix weak definitions, inconsistent data, or unclear ownership.
11. Wholesale Distribution KPIs by Industry
The same formula can carry different meaning across industries. Therefore, Wholesale Distribution KPIs should reflect product behavior and operating risk.
11.1 Apparel and Fashion
Track size-and-color accuracy, seasonal sell-through, return reasons, aging, and markdown exposure. Company-level inventory may look balanced while popular variants remain unavailable and weak sizes accumulate.
11.2 Furniture and Home Goods
Prioritize supplier lead-time reliability, damage rate, storage utilization, delivery completion, and order contribution. Because large products consume space and handling effort, capacity and freight can materially change profitability.
11.3 Sporting Goods
Seasonality, launches, and weather-sensitive demand increase forecast risk. Therefore, monitor forecast bias, product availability, aged seasonal inventory, and margin by category and channel.
11.4 Food and Beverage
Shelf life, lot traceability, waste, spoilage, supplier quality, and OTIF require close attention. Aging should reflect expiry exposure rather than movement alone.
11.5 Industrial and Automotive Parts
Critical-part fill rate, long-tail availability, supersessions, and supplier reliability may matter more than company-wide turnover. Moreover, low-volume products may still protect high-value customer relationships or equipment uptime.
Xorosoft organizes its industry solutions around different inventory-driven operating models. Even so, each company should configure targets around its own economics.
12. Common KPI Mistakes That Make Reports Misleading
Wholesale Distribution KPIs create false confidence when teams use inconsistent formulas or incomplete data. Therefore, governance matters as much as calculation.
12.1 Tracking Too Many Measures
An oversized executive dashboard weakens attention. Instead, select a small group of business outcomes and keep supporting metrics one level below. If a number does not trigger a decision, it probably does not belong on the main scorecard.
12.2 Using Inconsistent Formulas
One team may calculate fill rate by units while another uses complete orders. Similarly, finance may value inventory differently from an operational report. Consequently, every KPI needs a written definition, data source, owner, and effective date.
12.3 Rewarding One Department at Another Department’s Expense
A purchasing team can reduce unit cost by ordering more, while inventory carrying cost rises. Likewise, a warehouse can improve picks per hour while errors increase. Therefore, incentives should balance speed, accuracy, cost, service, and working capital.
12.4 Comparing Unlike Operations
Warehouses may handle different products, order sizes, service levels, and value-added work. Thus, standard formulas should remain consistent, but targets may need legitimate adjustment. Explain those differences before ranking locations.
12.5 Treating Benchmarks as Universal Answers
External benchmarks can provide useful context. However, they do not account for a distributor’s margins, supplier lead times, shelf life, product mix, or service promises. Therefore, businesses should use benchmarks as reference points rather than automatic targets.
13. When the Reporting System Needs to Change
As complexity increases, Wholesale Distribution KPIs become harder to maintain through manual files. The problem appears when spreadsheets hold definitions, corrections, and reconciliations that no source system can reproduce.
13.1 Signs That Spreadsheets Are No Longer Enough
Common signs include reports that take days to prepare, inventory and accounting numbers that disagree, separate departmental files, and an inability to trace results to transactions. In addition, multi-warehouse comparison, customer profitability, and channel reporting may require repeated manual work.
13.2 Choose the Right Technology Category
A business intelligence tool may work when source systems already hold reliable data. Inventory software can suit companies that need product control without full financial integration. A WMS becomes relevant when warehouses require barcode-driven execution, task control, and detailed labor visibility. By contrast, an integrated ERP becomes more appropriate when accounting, orders, purchasing, inventory, forecasting, ecommerce, and warehouse activity must share one operating record.
Xorosoft presents its broader business solutions across inventory, order management, warehousing, manufacturing, procurement, accounting, omnichannel commerce, forecasting, reporting, and automation. However, buyers should validate required integrations, transaction volume, reporting logic, and implementation scope before making a decision.
13.3 Evaluate Fit Through Real Workflows
Published customer case studies can provide implementation context. Nevertheless, each distributor should validate fit against its own products, integrations, controls, and reporting requirements.
14. Frequently Asked Questions About Wholesale Distribution KPIs
14.1 What Are Wholesale Distribution KPIs?
Wholesale Distribution KPIs are selected measures that show whether a distributor is improving profitability, inventory productivity, supplier performance, warehouse execution, fulfillment, forecasting, and customer service. Each KPI should have a documented formula, owner, target, review frequency, and corrective action. Otherwise, it remains a metric rather than a management tool.
14.2 Which KPIs Should a Wholesale Distributor Track?
Most distributors should begin with gross margin, cash conversion cycle, inventory turnover, GMROI, inventory accuracy, supplier on-time delivery, picking accuracy, fill rate, perfect order rate, forecast accuracy, and customer profitability. However, the final scorecard should reflect the company’s products, channels, customer agreements, and operating risks.
14.3 How Many KPIs Should a Distributor Monitor?
Executives usually need a focused scorecard, while departments need supporting diagnostic measures. Although no universal number exists, 8 to 15 executive KPIs often create more accountability than dozens of competing metrics. Each selected measure should support a recurring decision, target, or escalation.
14.4 What Is the Most Important Distribution KPI?
No single measure captures the full operation. Gross margin tracks product economics, fill rate protects service, turnover measures inventory productivity, and cash conversion shows working-capital pressure. Therefore, a balanced group of Wholesale Distribution KPIs provides a safer view than one headline number.
14.5 How Do You Measure Wholesale Distribution Performance?
Measure financial results, working capital, inventory, suppliers, warehouses, fulfillment, sales, forecasting, and customers. First, define the formulas and source data. Next, assign ownership and targets. Finally, review trends and segments, investigate exceptions, and document corrective action.
14.6 What Is Inventory Turnover?
Inventory turnover estimates how many times average inventory sells or moves during a period. The common formula divides cost of goods sold by average inventory. Higher turnover may indicate efficient stock use; however, an unusually high result may also signal understocking and service risk.
14.7 How Should Distributors Calculate Average Inventory?
Many teams average beginning and ending inventory. However, monthly or weekly averages often provide a better result for seasonal or rapidly changing businesses. Whichever approach the company chooses, it should use the same valuation basis and period for every comparison.
14.8 What Is a Good Inventory Turnover Ratio?
A good ratio depends on category, margin, lead time, seasonality, shelf life, and service requirements. Therefore, compare similar products, historical trends, and strategic targets instead of relying on one universal benchmark. Low turnover may indicate excess stock, while very high turnover can create shortages.
14.9 What Is Days Sales of Inventory?
Days sales of inventory estimates how many days average inventory remains invested before sale. Divide average inventory by cost of goods sold and multiply by the number of days. Lower DSI usually indicates faster movement; nevertheless, review it with stockouts and fill rate.
14.10 What Is GMROI?
Gross margin return on inventory investment measures gross margin dollars generated by average inventory cost. Consequently, it helps compare categories with different revenue, margins, and stock requirements. Revenue alone cannot show whether a category produces an adequate return on the cash invested in inventory.
14.11 What Is Order Fill Rate?
Order fill rate measures how much customer demand the distributor satisfies immediately from available stock. It can use complete orders, lines, or units. Because each calculation produces a different perspective, the dashboard should identify the denominator clearly.
14.12 What Is a Perfect Order Rate?
Perfect order rate measures the percentage of orders delivered complete, on time, damage-free, and with accurate documentation. However, the combined result does not identify the cause of failure. Therefore, teams should retain separate timing, availability, damage, and accuracy measures.
14.13 What Is OTIF?
On-time in-full measures the percentage of orders delivered by the agreed date with the complete required quantity. Before calculating it, define whether the date means requested, promised, or contractually confirmed. Also, track EDI, labeling, routing, and appointment compliance separately when customers require them.
14.14 How Is Picking Accuracy Measured?
Divide correct picks by total picks and multiply by 100. Next, define whether the business measures units, lines, orders, or shipments. Finally, code error reasons and review the result beside productivity because faster work does not create value when mis-picks and returns increase.
14.15 How Is Warehouse Productivity Measured?
Warehouses can measure picks, lines, cases, pallets, or orders per labor hour. However, compare equivalent work types and separate direct hours from paid hours. In addition, pair output with accuracy, cycle time, and cost so speed does not become the only objective.
14.16 What Is Dock-to-Stock Time?
Dock-to-stock time measures the elapsed period from receipt arrival or unloading until inventory becomes available in its assigned location. Long times may indicate appointment congestion, inspection delays, missing purchase-order data, labeling issues, labor shortages, or weak putaway capacity.
14.17 How Do Distributors Measure Supplier Performance?
Use a supplier scorecard containing on-time delivery, first-shipment fill rate, lead-time variance, defect rate, purchase-order accuracy, and price variance. Moreover, segment results by supplier, item, and shipping lane. Internal ordering or receiving errors should not enter supplier performance without investigation.
14.18 What Is Demand Forecast Accuracy?
Forecast accuracy measures the difference between planned and actual demand. Common methods include WAPE, MAPE, and mean absolute error. The most useful method depends on volume and planning level. Additionally, review bias because acceptable average error can still hide consistent over-forecasting or under-forecasting.
14.19 Which KPIs Should Teams Review Daily?
Daily reviews should emphasize operational exceptions such as stockouts, overdue receipts, blocked orders, picking errors, shipments at risk, receiving backlogs, and inventory discrepancies. These measures support immediate intervention. By contrast, turnover and cash conversion usually change too slowly for daily executive review.
14.20 Which KPIs Should Teams Review Monthly?
Monthly reviews should cover gross margin, contribution margin, customer profitability, turnover, DSI, GMROI, carrying cost, cash conversion, and service trends. Then, managers should drill into customer, SKU, supplier, warehouse, and channel segments to identify the cause.
14.21 What Should a Wholesale KPI Dashboard Contain?
Every card should show the formula, current result, target, variance, trend, owner, reporting period, and exception status. In addition, a strong dashboard provides drill-down to the relevant customer, product, supplier, warehouse, and transaction. Definitions and ownership matter as much as visualization.
14.22 Can ERP Software Calculate Distribution KPIs?
ERP software can calculate many measures when teams record operational and financial transactions consistently. Inventory, purchasing, sales, warehouse, and accounting data can then feed shared reports. However, the company must still define formulas, maintain master data, assign ownership, and configure the required workflows.
14.23 When Should a Distributor Stop Using Spreadsheet Reporting?
Consider a change when consolidation takes days, formulas differ between teams, inventory and finance disagree, or managers cannot trace results to source transactions. Spreadsheets may still support analysis. Nevertheless, they become risky as the primary reporting system when locations, users, channels, and data volume expand.
14.24 Should Targets Be the Same for Every Warehouse?
Not always. Warehouses may process different products, order profiles, service levels, and value-added work. Therefore, formulas should remain consistent, while targets may reflect legitimate structural differences. Comparisons should group similar facilities and explain exclusions before ranking performance.
14.25 How Can Distributors Improve KPI Data Quality?
Standardize item, customer, supplier, location, and unit-of-measure data. Next, define transaction timing, reason codes, and ownership. Also, reconcile inventory with accounting and remove duplicate entry. Most importantly, investigate exceptions instead of correcting reports without fixing the source process.
14.26 How Should a Distributor Set KPI Targets?
Begin with an accurate baseline, then consider strategy, customer commitments, product economics, capacity, lead times, and historical variation. Afterward, set a realistic improvement range and warning threshold. External benchmarks can provide context, but they should not replace company-specific analysis.
14.27 What Are Leading Distribution KPIs?
Leading KPIs indicate conditions that may affect future results. Examples include forecast bias, supplier lead-time variance, backorder aging, overdue receipts, inventory discrepancies, and picking errors. Because these signals appear before final financial outcomes, teams can often intervene earlier.
14.28 What Are Lagging Distribution KPIs?
Lagging KPIs report completed outcomes such as gross margin, customer retention, inventory write-offs, cash conversion, and perfect order performance. They confirm whether the operation achieved its objectives. However, diagnostic metrics are still necessary to explain why the result changed.
14.29 How Often Should the KPI Framework Change?
Review the framework at least quarterly and whenever strategy, channels, locations, customer requirements, or product mix changes materially. A KPI that no longer supports a decision should leave the main scorecard. Meanwhile, new risks may require additional diagnostic measures.
14.30 How Can Xorosoft Support Wholesale Reporting?
Xorosoft connects inventory, purchasing, warehouse management, accounting, forecasting, reporting, Shopify, Amazon, and EDI-related workflows for inventory-driven businesses. Therefore, teams can build operational and financial measures from a more connected data foundation. Suitability still depends on the distributor’s workflows, integrations, controls, and implementation readiness.
15. Turn Measurement Into Better Operating Decisions
Wholesale Distribution KPIs create value only when teams trust the data and act on the result. Therefore, choose a balanced scorecard, document each formula, assign one accountable owner, and connect every exception to corrective work. In addition, review the supporting metrics before making a change that could improve one department while damaging another.
The goal is not the largest dashboard. Instead, build a management system that reveals profit leaks, inventory risk, supplier instability, and service failures early enough to respond.
For businesses that have outgrown QuickBooks, spreadsheets, or disconnected inventory and warehouse applications, Xorosoft offers connected ERP and WMS options for inventory-driven operations. Review the operating model, data requirements, and implementation scope first; then Book a demo to explore how the KPI framework could map to your distribution workflows.