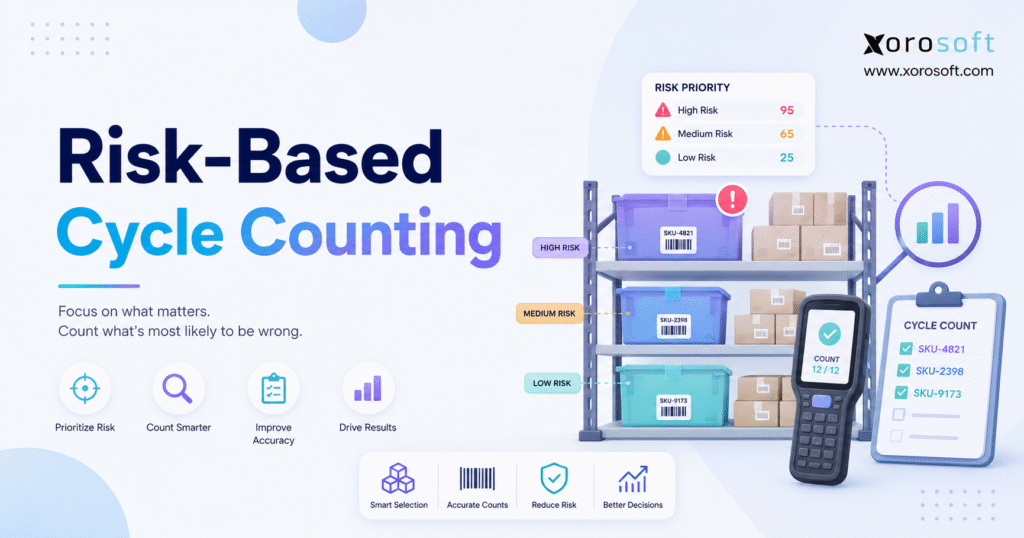
If you’re seeking to improve inventory accuracy and efficiency, risk-based cycle counting can provide a strategic approach for your operations.
1. Why Traditional Count Schedules Miss the Inventory Most at Risk
Most cycle-counting programs begin with a calendar. A items are counted weekly, B items monthly, and C items quarterly. Although that approach creates consistency, it assumes that inventory value or classification reliably predicts where the next discrepancy will occur.
In practice, inventory risk is rarely distributed evenly.
For example, a low-cost SKU may move hundreds of times each week, sit in several pick locations, pass through a busy returns department, and require constant replenishment. Meanwhile, a higher-value SKU may remain untouched in secure reserve storage for several months. Therefore, counting both products according to a fixed schedule may direct labour toward the wrong inventory.
The central challenge is not simply to count more stock. Instead, businesses need to identify which SKU-location combinations are most likely to be wrong before the discrepancy causes a failed pick, unnecessary purchase order, delayed shipment, production shortage, or inaccurate month-end close.
Risk-based cycle counting changes the operating question. Rather than asking, “Which items are due for a count?” the warehouse asks, “Which inventory records currently carry the greatest probability and impact of an error?”
1.1 Equal Frequency Does Not Create Equal Inventory Control
Uniform schedules treat stable and unstable inventory in the same way. However, one product may experience dozens of touches every day, while another remains stationary.
Moreover, fixed schedules respond slowly when operating conditions change. A product may suddenly become risky after a promotion, location move, supplier packaging change, system migration, staffing change, or spike in returns. Nevertheless, the next scheduled count may still be several weeks away.
As a result, purchasing, fulfilment, and customer-service teams may continue making decisions against an unreliable inventory record. Consequently, the problem spreads beyond the warehouse and begins affecting customer promises, purchasing recommendations, available-to-sell quantities, and financial reporting.
1.2 Counting the Wrong Products Creates an Operational Cost
Every count consumes warehouse time. Employees must travel to the location, identify the product, verify the unit of measure, count the physical stock, record the result, and sometimes complete a recount.
Therefore, counting consistently accurate inventory creates activity without reducing meaningful risk. By contrast, counting a high-risk SKU can prevent a short shipment, unnecessary replenishment order, customer cancellation, or production delay.
For that reason, a stronger count program directs limited warehouse capacity toward inventory where verification can create the greatest operational benefit.
2. What Risk-Based Cycle Counting Changes
Risk-based cycle counting is an inventory-control method that prioritizes products, locations, lots, or serialized units according to the likelihood and business impact of an inventory discrepancy.
Instead of relying only on item value, the method evaluates signals such as previous variances, transaction frequency, adjustment history, location complexity, returns activity, shrinkage exposure, units of measure, supplier lead time, and customer or production dependency.
Therefore, every SKU does not receive the same count frequency.
A stable item may receive less frequent verification. Meanwhile, an item with repeated short picks, frequent relocations, or recent adjustments may receive a weekly or event-triggered count. As conditions change, its priority can increase or decrease.
2.1 How Risk-Based Cycle Counting Works in Practice
A practical risk-based cycle counting program follows seven steps:
1. Collect inventory, warehouse, transaction, and adjustment data.
2. Identify measurable factors linked to inventory errors.
3. Score each SKU or SKU-location combination.
4. Separate error probability from business impact.
5. Assign inventory to risk tiers.
6. Connect each tier to scheduled and event-triggered counts.
7. Use count results to refine the model and correct process failures.
Initially, the model should remain simple. For instance, a business may begin with variance history, movement frequency, inventory value, location complexity, and operational importance.
Later, the company can add more detailed factors once the initial program produces enough reliable data. However, the business should not add complexity merely because additional data is available. Every risk factor must influence an operational decision.
2.2 What the Program Can Improve
A well-designed risk-based cycle counting program can improve count prioritization, detect discrepancies earlier, reduce time spent on stable inventory, and strengthen confidence in inventory data.
In addition, it can reveal recurring failures in receiving, putaway, replenishment, picking, transfers, returns, or manufacturing transactions. As a result, the organization gains information that can improve warehouse procedures rather than merely correct quantities.
However, counting does not automatically solve those failures. The count identifies a symptom. Therefore, management must investigate why the system quantity and physical quantity became different.
2.3 When a Simpler Approach Is Enough
Not every business needs a weighted scoring model.
For example, a small company with one warehouse, a limited SKU catalogue, low movement volume, and consistently accurate inventory may perform well with a basic rotational or ABC schedule.
However, the need for a risk-based approach increases as the operation adds warehouses, sales channels, controlled products, manufacturing activity, complex units of measure, and higher transaction volume.
Similarly, a company may begin with ABC counting and gradually add historical variance and movement signals. Therefore, risk-based cycle counting can be introduced progressively rather than through a disruptive company-wide change.
3. Inventory Signals That Predict Count Errors
A useful scoring model separates two questions:
1. How likely is the inventory record to be wrong?
2. How serious would the error be?
Both questions matter.
For example, a frequently inaccurate low-cost product may disrupt daily fulfilment. Meanwhile, a rarely moved component may deserve attention because its absence could stop production or delay a major customer order.
Consequently, the strongest model combines error probability with financial and operational impact.
3.1 Previous Variances and Adjustment History
Historical count results are among the strongest practical indicators of future inventory risk.
Businesses should track:
- Number of inaccurate counts
- Quantity variance
- Financial value of adjustments
- Positive and negative adjustments
- Recount frequency
- Time since the last discrepancy
- Repeated reason codes
- Percentage of counts producing an adjustment
An item that failed three of its previous five counts should usually receive more attention than one with a long history of accurate records.
However, the business should also consider how often each item has been counted. Otherwise, frequently counted products may appear riskier simply because they have had more opportunities to produce a recorded variance.
Moreover, recent discrepancies may deserve more weight than old ones. For example, an error recorded last week may indicate a current warehouse problem, whereas a variance from two years ago may relate to a process that has already been corrected.
3.2 Movement and Handling Exposure
Every physical or digital movement creates another opportunity for error.
Therefore, risk generally increases with:
- Frequent picking
- Replenishment
- Receiving
- Warehouse transfers
- Case breaking
- Returns
- Repacking
- Kitting
- Production issues
- Manual adjustments
For instance, a case may be opened and converted into individual units. If the unit conversion is not recorded correctly, the total quantity may become inaccurate even though the physical handling appeared routine.
Similarly, a replenishment move may be completed physically but left open in the warehouse system. Consequently, one location shows too much stock while another shows too little.
Nevertheless, transaction volume should not be treated as automatic evidence of inaccuracy. A fast-moving SKU supported by strong scanning and location controls may remain highly accurate. Therefore, movement frequency should be compared with actual count history.
3.3 Storage and Location Complexity
The same SKU can have different risk levels in different locations.
For example, inventory stored in a secure reserve area may remain accurate for months. By contrast, the same item in a fast-moving forward-pick location may experience daily discrepancies.
Risk often increases when products are stored in:
- Multiple bins
- Mixed-SKU locations
- Overflow areas
- Staging zones
- Returns departments
- Third-party warehouses
- Temporary locations
- Goods-in-transit accounts
Recent relocations also deserve additional attention. Although the physical movement may happen immediately, the corresponding system transaction may be delayed, interrupted, or posted against the wrong destination.
Therefore, SKU-location scoring is usually more accurate than assigning one company-wide risk score to the product.
In addition, warehouse zones can carry different levels of control. A secure cage, bulk reserve area, automated storage system, and manual pick face should not necessarily use identical risk assumptions.
3.4 Product-Control Requirements
Some inventory requires verification beyond the basic on-hand quantity.
Examples include:
- Lot-controlled food products
- Serialized electronics
- Expiration-controlled inventory
- Variable-weight goods
- Products sold by case and each
- Kits and bundles
- Manufactured assemblies
- Apparel size and colour variants
A record may be correct at the total SKU level but wrong by location, lot, serial number, expiration date, or unit of measure.
Consequently, businesses should score risk at the level where the control requirement exists.
For example, a warehouse may have 100 units of an item in total. However, 40 units may be assigned to the wrong lot, or 20 units may have an incorrect expiration date. Although the top-level quantity appears accurate, the inventory is still operationally unreliable.
3.5 Financial and Operational Impact
Financial value remains important. However, it should not be the only consideration.
Impact factors may include:
- Unit cost
- Total on-hand value
- Revenue contribution
- Gross margin
- Customer-order dependency
- Supplier lead time
- Replacement availability
- Production criticality
- Compliance requirements
- Stockout consequences
For example, a low-cost component may stop an entire production order. Therefore, its operational impact may exceed that of a more expensive finished product with several available substitutes.
Likewise, a customer-specific item may have limited total value but significant service consequences. Consequently, the model should reflect the cost of the business disruption, not just the accounting value of the inventory.
4. Building a Practical SKU Risk Model
A useful risk model should rely on dependable data, create priorities that warehouse teams understand, and improve as count results accumulate.
Although advanced analytics may eventually support the process, most companies should begin with an explainable scoring method. Otherwise, employees may receive high-priority tasks without understanding why the items were selected.
4.1 Choose the Correct Level of Analysis
The scoring level should match the point where discrepancies occur.
Use:
- SKU-level scoring for simple, single-location operations
- SKU-location scoring for multi-bin or multi-warehouse businesses
- SKU-location-lot scoring for expiration-sensitive products
- SKU-location-serial scoring for serialized inventory
For example, one warehouse may maintain excellent accuracy while another struggles with the same SKU. Therefore, a company-wide SKU score could hide the real source of the problem.
Similarly, a product may be stable in reserve but unreliable in the forward-pick location. As a result, location-level scoring often provides a more useful count priority.
4.2 Separate Probability from Consequence
A simple structure is:
Total Inventory Risk = Probability of Error × Business Impact
| Error probability | Business impact | Recommended response |
|---|---|---|
| Low | Low | Routine coverage |
| High | Low | Frequent process-focused counts |
| Low | High | Scheduled verification and stronger controls |
| High | High | Immediate priority and frequent review |
This distinction prevents management from treating “valuable” and “likely to be wrong” as the same condition.
Moreover, the matrix helps explain why two products with the same financial value may receive different count frequencies. One may have a stable transaction history, while the other experiences constant warehouse handling.
4.3 Select Factors the Business Can Measure
Start with five or six factors that can be updated consistently.
| Risk factor | Example weight |
| Previous count discrepancies | 25% |
| Transaction frequency | 20% |
| Location and handling complexity | 15% |
| Inventory or adjustment value | 15% |
| Operational criticality | 15% |
| Lot, serial, UOM, or expiration complexity | 10% |
| Total | 100% |
These weights are illustrative.
For example, a food distributor may give more weight to expiration and lot controls. Meanwhile, a manufacturer may emphasize production criticality and component availability.
Therefore, the model should reflect the company’s operating environment rather than copy a standard template.
In addition, every factor should have a reliable source. If location complexity depends on a spreadsheet that is rarely updated, the resulting score may create false priorities.
4.4 Create Consistent Scoring Rules
A one-to-five scale is usually sufficient:
- 1: Very low risk
- 2: Low risk
- 3: Moderate risk
- 4: High risk
- 5: Critical risk
However, each score must have a clear definition.
For example, transaction exposure could be scored according to monthly movements:
| Monthly movements | Score |
| 0–5 | 1 |
| 6–20 | 2 |
| 21–50 | 3 |
| 51–100 | 4 |
| More than 100 | 5 |
Nevertheless, those ranges should come from the company’s real transaction distribution. A furniture importer and a high-volume wholesaler should not use identical thresholds.
Similarly, the variance-history score should consider both frequency and materiality. One minor difference should not necessarily carry the same weight as repeated high-value adjustments.
4.5 Calculate the Combined Score
A weighted formula can be written as:
SKU Risk Score = Σ Factor Score × Factor Weight
Suppose an item receives:
- Variance history: 5
- Transaction activity: 4
- Location complexity: 3
- Financial impact: 4
- Operational criticality: 5
- Product-control complexity: 2
The calculation becomes:
(5 × 25%) + (4 × 20%) + (3 × 15%) + (4 × 15%) + (5 × 15%) + (2 × 10%) = 4.05
Therefore, the item would enter a high or critical tier, depending on the company’s scoring thresholds.
However, businesses should avoid presenting decimal precision as scientific certainty. The score is a prioritization tool, not a guarantee that a discrepancy exists.
4.6 Example Inventory Priority Table
| SKU | Variance history | Activity | Complexity | Impact | Total score | Tier |
| SKU-A | 5 | 5 | 3 | 5 | 18 | Critical |
| SKU-B | 4 | 4 | 4 | 4 | 16 | High |
| SKU-C | 2 | 5 | 2 | 3 | 12 | Medium |
| SKU-D | 1 | 2 | 1 | 5 | 9 | Medium |
| SKU-E | 1 | 1 | 1 | 1 | 4 | Low |
SKU-D has limited activity. However, its business impact prevents it from falling into the low-risk tier.
By comparison, SKU-C moves frequently but has moderate consequences if a discrepancy occurs. Therefore, both items remain in the medium tier for different reasons.
4.7 Test the Risk-Based Cycle Counting Model
After several count cycles, compare:
- Percentage of counts that find a variance
- Adjustment value by risk tier
- Repeat discrepancy rate
- Labour used by tier
- Recount frequency
- Errors detected before fulfilment
- Errors detected before production
If low-risk products create most of the adjustment value, the model is missing an important factor.
Therefore, risk-based cycle counting should be treated as a controlled operating process rather than a one-time classification exercise.
Moreover, the business should retain some random counts. Otherwise, the model may repeatedly confirm its existing assumptions while overlooking new inventory risks.
5. Turning Scores into Count Frequencies
A score creates value only when it changes warehouse action.
Therefore, each tier should connect to a count frequency, event trigger, tolerance, recount process, and approval path.
5.1 Risk-Based Cycle Counting Frequency Tiers
| Risk tier | Illustrative frequency | Additional response |
| Critical | Daily or weekly | Count after any high-risk event |
| High | Weekly or biweekly | Recount after a material variance |
| Medium | Monthly | Count after relocation or adjustment |
| Low | Quarterly | Include in routine coverage |
| Minimal | Semiannually or annually | Escalate when conditions change |
These frequencies are starting points rather than universal standards.
For instance, a critical production component may need daily verification during a major production run. However, the same component may return to a weekly schedule once demand stabilizes.
Likewise, a seasonal product may move from low risk to critical risk during a promotion. Therefore, count frequency should respond to current operating conditions.
5.2 Add Event-Triggered Inventory Counts
A calendar cannot respond immediately when risk changes.
Therefore, businesses should create count tasks after events such as:
- Negative available inventory
- Failed pick caused by missing stock
- Unexpected zero balance
- Large manual adjustment
- Recent location change
- Lot or serial mismatch
- High-value return
- Repeated short shipment
- Unit-of-measure correction
- Sudden transaction spike
Event-triggered counting should supplement scheduled coverage rather than replace it.
For example, an item may already be scheduled for a monthly count. However, a failed pick today creates a new reason to verify the location immediately.
Similarly, a large return may create uncertainty about condition, location, lot, or available status. Consequently, an immediate count can protect the accuracy of customer-facing availability.
5.3 Match the Schedule to Available Capacity
Warehouse programs often fail because they create more count tasks than employees can complete.
Calculate daily capacity as:
Daily Count Capacity = Available Counting Minutes ÷ Average Minutes per Count
If the warehouse has 240 minutes and each count takes six minutes, practical capacity is approximately 40 count lines.
Therefore, the system should allocate those 40 lines according to risk instead of creating 120 overdue tasks.
In addition, capacity should account for recounts and investigations. If every available minute is assigned to first counts, material differences may remain unresolved.
5.4 Set Tolerances and Approval Levels
Not every difference requires the same response.
Tolerance rules may consider:
- Percentage variance
- Quantity variance
- Financial value
- Serial or lot control
- Repeat discrepancy history
- User authority
- Accounting materiality
For example, a minor difference in a low-cost bulk item may follow a controlled automatic workflow. By contrast, a serialized product or high-value component should require a recount and supervisor approval.
Nevertheless, tolerance should not become an excuse to ignore recurring small errors. Several minor discrepancies may reveal a larger process problem when considered together.
6. Running Accurate Warehouse Counts
A poor counting process can create the same errors it is intended to correct.
Therefore, warehouses must control open transactions, count visibility, barcode scanning, recounts, and adjustment approvals.
6.1 Prepare the Location Before Counting
Before the employee begins, confirm:
- Correct warehouse and location
- Open receiving and picking work
- Unposted transfers
- Inventory in staging or packing
- Lot and serial requirements
- Unit of measure
- Existing count tasks
- Whether movement must pause
A count performed against incomplete transactions may compare physical inventory with an outdated system position.
Consequently, the resulting adjustment can introduce a new discrepancy rather than correct the original one.
For example, inventory may already have been picked physically while the digital task remains open. If the counter treats the missing quantity as a shortage, the system may reduce the balance twice.
6.2 Use Blind Counts Where Practical
A blind count hides the expected system quantity from the counter.
As a result, the employee records what is physically present rather than unconsciously confirming the displayed quantity.
However, supervisors may still need the system balance during variance investigation. Therefore, the first count and approval process should use different visibility rules.
In addition, blind counting works best when the item, location, and unit of measure are clearly identified. Otherwise, employees may produce independent but incorrect results.
6.3 Scan Before Entering Quantity
A controlled mobile workflow should verify:
1. Warehouse
2. Location
3. Item
4. Lot or serial number
5. Unit of measure
6. Physical quantity
Scanning reduces item-selection and location-selection errors. Nevertheless, it cannot correct poor labels, duplicate barcodes, damaged tags, or inventory stored in the wrong bin.
Therefore, barcode controls and location discipline remain essential. Technology strengthens a sound process, but it does not replace one.
6.4 Separate Counts from Recounts
A material difference should trigger an independent recount by another qualified employee.
Ideally, the second worker should not see the first result.
If both counts agree, the business should investigate transactions before posting an adjustment. However, if the two counts disagree, the physical counting method may be unreliable and require a third verification.
Moreover, the recount employee should verify packaging, open cartons, units of measure, and nearby locations. Otherwise, the second count may repeat the same assumption as the first.
6.5 Connect Warehouse Activity with Inventory Records
Disconnected count sheets, warehouse applications, inventory systems, and accounting platforms slow investigation and increase duplicate entry.
A connected warehouse platform such as XoroWMS can bring barcode transactions, location controls, count tasks, inventory adjustments, and operational reporting into a shared workflow.
As a result, the final count can remain traceable to the item, location, employee, reason, approval, and financial effect.
For businesses using risk-based cycle counting, that connected history also supplies the information needed to update future risk scores.
7. Converting Variances into Process Improvements
The process is not complete when the system quantity matches the shelf.
Instead, the business must determine why the physical quantity and recorded quantity became different.
7.1 Treat Material Differences as Process Signals
A meaningful review should answer:
- What happened?
- Where did it happen?
- When did it happen?
- Which process created the error?
- Who owns the corrective action?
- Should the inventory risk score increase?
Without those answers, the warehouse is adjusting symptoms.
Consequently, the same discrepancy may return during the next count.
Moreover, frequent unexplained adjustments can reduce confidence in purchasing, forecasting, allocation, and financial data. Therefore, variance investigation should be treated as an operating-control process rather than an administrative task.
7.2 Use Consistent Reason Codes
Useful adjustment reasons include:
- Receiving shortage
- Receiving overage
- Incorrect putaway
- Wrong-bin pick
- Unrecorded replenishment
- Damaged inventory
- Shrinkage
- Return not received
- Unit-of-measure error
- Lot or serial mismatch
- Transfer timing
- Unknown cause
However, “unknown cause” should be reviewed closely.
If it becomes the most common reason, the business probably lacks sufficient transaction history, employee accountability, or warehouse visibility.
Therefore, supervisors should review unknown causes by warehouse, employee, product family, and transaction type.
7.3 Connect Errors to Warehouse Processes
| Process | Common failure |
| Receiving | Incorrect quantity, product, or unit of measure |
| Putaway | Stock stored in the wrong location |
| Picking | Wrong SKU, lot, or quantity selected |
| Replenishment | Physical move not recorded correctly |
| Returns | Returned inventory not inspected or received |
| Manufacturing | Materials issued or completed incorrectly |
| Transfers | Shipment and receipt posted at different times |
| Adjustments | Manual correction without supporting evidence |
For example, if unit-of-measure errors affect an entire product family, the business should increase the temporary risk score for those SKUs.
Meanwhile, operations should correct barcode labels, packaging rules, training, and system conversions.
Once several accurate counts confirm the improvement, the score can gradually decrease. As a result, risk-based cycle counting becomes a feedback loop rather than a static schedule.
7.4 Track Repeat Errors, Not Only Adjustment Value
Adjustment value is important. However, it does not show whether the same control problem continues to return.
Therefore, companies should also measure repeat discrepancy rate.
A lower repeat rate indicates that root-cause work is preventing previous errors. By contrast, a falling adjustment value may simply reflect lower inventory volume or lower-cost products.
In addition, management should compare discrepancies per count. If the high-risk tier consistently identifies more meaningful errors than the low-risk tier, the prioritization model is working as intended.
8. Risk-Based Cycle Counting vs Other Counting Methods
Risk-based cycle counting does not need to replace every other counting method.
Instead, most businesses benefit from a hybrid approach that combines targeted counts with broader validation.
8.1 Risk-Based Cycle Counting vs ABC Counting
| Criterion | Risk-based method | ABC method |
| Main logic | Error probability and impact | Value, usage, or importance |
| Inputs | Variances, movements, locations, complexity, impact | Cost, consumption, sales, or class |
| Responsiveness | Changes as operating risk changes | Usually reviewed periodically |
| Complexity | Medium to high | Low to medium |
| Main strength | Finds likely discrepancies | Easy to understand |
| Main limitation | Requires dependable data | May miss low-value problem items |
ABC analysis remains useful.
For instance, value and strategic importance can become factors within a broader scoring model. However, they should not automatically determine the entire count frequency.
Therefore, risk-based cycle counting should usually extend ABC logic rather than reject it.
8.2 Random Counting
Random counting reduces selection bias and provides a general test of inventory accuracy.
However, it may direct limited labour toward stable items while known problem products remain unchecked.
Therefore, a practical program can reserve a small percentage of daily count capacity for random validation. This approach also helps determine whether the risk model is overlooking unexpected problems.
For example, if random counts repeatedly find errors in a low-risk product family, the scoring model may be missing a shared warehouse or product characteristic.
8.3 Location-Based Counting
Location-based counting supports complete warehouse coverage and can reveal mixed-bin or storage-discipline problems.
Nevertheless, one location may contain both stable and unstable products.
Consequently, a hybrid program can rank locations according to error history and then prioritize the highest-risk items within those areas.
Similarly, the business can schedule complete zone counts after layout changes, relocations, or warehouse expansions.
8.4 Full Physical Inventory
| Method | Scope | Disruption | Main purpose |
| Routine cycle counting | Selected inventory throughout the year | Low to moderate | Continuous control |
| Risk-based cycle counting | Higher-risk inventory more frequently | Targeted | Efficient discrepancy detection |
| Physical inventory | Most or all inventory at once | High | Broad financial or operational verification |
A mature count program may reduce reliance on disruptive full counts.
However, accounting policy, audit requirements, lender conditions, contracts, or regulations may still require broader physical verification.
Therefore, businesses should confirm the appropriate approach with their finance and audit advisers.
9. Industry-Specific Inventory Risk Patterns
Different industries create different discrepancy risks.
Therefore, companies should adapt the scoring model to their products, warehouse processes, sales channels, and control requirements.
Businesses can review Xorosoft’s industry-specific workflows when mapping operational requirements across inventory-driven sectors.
9.1 Risk-Based Cycle Counting for Apparel Operations
Apparel businesses manage numerous size, colour, style, season, and collection combinations.
Risk increases when visually similar variants share locations or when returns re-enter available stock without accurate inspection.
Useful signals include:
- Variant similarity
- Return frequency
- Seasonal movement
- Promotions
- Warehouse transfers
- Mixed-SKU storage
Moreover, risk may rise sharply during seasonal launches even when the product had a stable history during the previous quarter.
Therefore, apparel companies should allow promotional activity and return volume to influence temporary count priority.
9.2 Wholesale Distribution
Wholesale distributors often manage high order-line volume, case and each picking, customer allocations, EDI activity, and multi-warehouse fulfilment.
Therefore, higher-risk items may include:
- Fast-moving case-break products
- Allocated inventory
- Frequently substituted products
- Multiple packaging units
- Transfer-heavy SKUs
- Items linked to repeated short shipments
In addition, customer-specific pack sizes and pricing arrangements can increase unit-of-measure complexity.
Consequently, the distributor should score operational exposure at both the product and warehouse-location levels.
9.3 Furniture Distribution
Furniture businesses may store products in reserve, staging, overflow, showroom, customer-hold, and third-party locations.
Consequently, unrecorded relocations can become a major source of error.
Risk factors may also include:
- Multiple components
- Finish or fabric variants
- Damaged units
- Long supplier lead times
- Special-order inventory
- Products stored outside standard racking
Moreover, furniture inventory may occupy several physical spaces while being represented as one item in the system. Therefore, location verification is especially important.
9.4 Food and Beverage
Food inventory adds lot, expiration, quality, spoilage, and sometimes variable-weight controls.
Therefore, count priority may increase for:
- Products nearing expiration
- Frequently replenished items
- High-spoilage categories
- Quality-held lots
- Variable-weight goods
- Products moving across temperature zones
Moreover, a quantity can appear correct while the available lot or expiration profile remains wrong.
As a result, food businesses may need to score SKU-location-lot combinations instead of total item quantities.
9.5 Manufacturing
Manufacturers should evaluate raw materials, components, work-in-process, finished goods, scrap, and rework inventory separately.
For example, backflushing, material substitutions, yield variances, work-order completions, and delayed material issues can all create discrepancies.
In addition, production-critical components may deserve frequent verification even when their unit value is low.
Therefore, operational impact should include production stoppage risk, substitute availability, and supplier lead time.
9.6 Risk-Based Cycle Counting for Shopify Operations
The same stock may support Shopify, Amazon, wholesale orders, marketplaces, and several fulfilment locations.
As a result, synchronization delays, returns, channel allocations, and fulfilment-location changes can increase risk.
Merchants evaluating an operational ERP behind Shopify can review Xorosoft ERP on the Shopify App Store.
However, channel synchronization alone cannot correct poor warehouse transactions. Therefore, ecommerce, inventory, and warehouse processes must operate from consistent data.
In addition, risk-based cycle counting can prioritize products associated with overselling, failed fulfilment, high return volume, or frequent channel-allocation changes.
9.7 Multi-Warehouse Businesses
A company should not assign one risk score to an SKU when warehouse conditions differ.
Instead, it should compare the product by facility and location.
For example, one warehouse may maintain high accuracy while another experiences repeated picking and replenishment problems.
Consequently, SKU-location scoring helps management determine whether the issue follows the product or a local operating process.
Moreover, warehouse-level comparisons can reveal training, layout, supervision, or technology differences that require corrective action.
10. When Risk-Based Cycle Counting Needs ERP or WMS Support
A spreadsheet can manage a basic count schedule.
However, manual administration becomes less reliable as the business adds warehouses, channels, controlled products, manufacturing, approval requirements, and larger transaction volumes.
10.1 When Spreadsheets May Still Work
A spreadsheet may remain sufficient when the company has:
- One warehouse
- A limited product catalogue
- Low transaction activity
- Few controlled products
- Simple accounting
- A manageable daily count queue
Nevertheless, the spreadsheet should still track owners, due dates, results, recounts, reason codes, adjustment values, and approvals.
Moreover, the company should control versions carefully. Otherwise, different employees may work from conflicting count schedules.
10.2 Signs Risk-Based Cycle Counting Should Be Automated
A company should consider stronger system support when:
- Count schedules are frequently missed
- Warehouse teams maintain separate files
- Adjustments lack reason codes
- Inventory differs across systems
- Warehouses use inconsistent procedures
- Shopify, wholesale, and accounting quantities disagree
- Reconciliation takes too long
- Results do not influence future priorities
- Management cannot identify repeat causes
At that stage, the problem is no longer only count scheduling. Instead, it becomes a broader inventory-data and workflow-control issue.
Therefore, automating risk-based cycle counting may improve both task prioritization and the quality of the information used for investigation.
10.3 ERP Requirements for Inventory Control
An inventory-focused ERP should support:
- Perpetual inventory
- Multi-warehouse visibility
- Inventory valuation
- Purchasing
- Adjustment accounting
- Sales-order allocation
- Lot and serial controls
- Historical reporting
- Manufacturing inventory where required
XoroERP may be relevant when inventory, purchasing, accounting, and operational reporting need to work from connected records.
As a result, inventory adjustments can flow into financial reporting without separate manual reconciliation.
10.4 Warehouse System Requirements
A warehouse management system should be evaluated for:
- Mobile barcode counting
- Directed count tasks
- Blind counts
- Recounts
- Approval tolerances
- Adjustment reasons
- Count history
- Location controls
- Lot and serial scanning
- Prioritized work queues
However, buyers should verify the exact process during a demonstration. Not every WMS supports dynamic scoring or event-triggered prioritization in the same way.
In addition, the evaluation should confirm whether risk factors can be configured without expensive custom development.
10.5 Why Inventory and Accounting Must Agree
Inventory adjustments can affect quantity, valuation, write-offs, shrinkage accounts, cost of goods sold, and financial reporting.
Therefore, warehouse and accounting records cannot be managed as unrelated processes.
A unified platform such as XoroONE can connect inventory, warehouse management, purchasing, accounting, ecommerce, forecasting, manufacturing, EDI, and reporting workflows.
As a result, operations and finance can review the same adjustment history instead of reconciling several disconnected systems.
Moreover, connected reporting allows management to compare physical discrepancies with their financial impact.
10.6 Comparing Platform Options
Inventory-driven businesses may evaluate:
1. Xorosoft
2. NetSuite
3. Acumatica
4. Microsoft Dynamics 365 Business Central
5. Cin7
6. Brightpearl
7. Fishbowl
8. Sage
The final decision should consider workflow fit, implementation resources, accounting requirements, warehouse complexity, manufacturing, ecommerce, reporting, scalability, and total ownership cost.
Businesses reviewing broader ERP alternatives can use this Xorosoft vs NetSuite comparison as one part of the evaluation process.
However, software selection should follow process analysis. Otherwise, the company may automate weak counting rules without improving inventory accuracy.
11. A 90-Day Implementation Plan
A controlled pilot is usually more effective than launching a complex scoring model across every warehouse at once.
11.1 Days 1–15: Establish the Baseline
Measure:
- Current count accuracy
- Adjustment value
- Repeat discrepancy rate
- Count completion
- Recount frequency
- Count labour
- Common variance reasons
In addition, separate results by warehouse, product family, and location type.
Without a baseline, management cannot determine whether the new approach produces a real improvement.
11.2 Days 16–30: Choose the Risk Factors
Select five or six factors with reliable data.
Then, define each scoring rule clearly and document who owns the source information.
Avoid vague criteria such as “important item” unless the business defines importance consistently.
Moreover, confirm that each factor can be updated regularly. Otherwise, the model will become outdated as operating conditions change.
11.3 Days 31–45: Score a Pilot Group
Begin with one product family, warehouse zone, or operating unit.
Next, review unusually high and low scores manually.
If obviously stable inventory appears in the critical tier, the model may contain poor thresholds or incomplete data.
Similarly, if known problem items appear in the low-risk group, the business may be missing a key signal such as returns, transfers, or unit-of-measure complexity.
11.4 Days 46–60: Run the Risk-Based Cycle Counting Pilot
Assign count frequencies, event triggers, tolerances, counters, and approvers.
Meanwhile, track every count, recount, discrepancy, reason code, and adjustment value.
Do not judge success only by the number of variances found. Instead, evaluate whether the risk-based cycle counting pilot identifies meaningful operational errors.
In addition, record count duration. A model that identifies valuable errors but consumes excessive labour may need a more focused count queue.
11.5 Days 61–75: Correct Root Causes
Use a Pareto analysis to identify which processes create most discrepancies.
Then, improve:
- Labels
- Barcode controls
- Training
- Receiving
- Putaway
- Replenishment
- Units of measure
- Returns
- Transaction timing
As a result, the count program begins preventing errors rather than merely detecting them.
Moreover, assign an owner and deadline to each corrective action. Otherwise, the same issues may remain visible but unresolved.
11.6 Days 76–90: Expand and Automate
Update scoring weights using the pilot results.
Afterward, expand the model to additional products, locations, and warehouses.
Automation should follow a stable and understood process. Otherwise, the business will simply automate unclear rules and inconsistent behaviour.
Finally, establish a monthly review to adjust risk factors, thresholds, count capacity, and corrective actions.
12. Frequently Asked Questions
12.1 What Is Risk-Based Cycle Counting?
Risk-based cycle counting prioritizes inventory according to the likelihood and business impact of an error. Instead of counting every product equally, the business uses variance history, transaction activity, location complexity, value, and operational importance to decide what should be counted first.
12.2 How Does Risk-Based Inventory Counting Improve Accuracy?
It directs limited count capacity toward records most likely to contain meaningful errors. In addition, count results expose recurring process failures. Therefore, the business can correct causes instead of repeatedly posting adjustments.
12.3 What Makes an SKU High Risk?
Frequent movements, repeated discrepancies, multiple locations, returns, manual adjustments, complex units of measure, lot controls, financial value, and production or customer dependencies can all increase risk. However, no single factor should automatically determine the final priority.
12.4 How Is an SKU Risk Score Calculated?
The business scores each measurable factor, multiplies it by an assigned weight, and adds the results. However, factors and weights should reflect the company’s own discrepancy history and operating priorities.
12.5 Should Risk Be Calculated by SKU or Location?
SKU-location scoring is usually more precise because the same product can behave differently across warehouses or bins. In addition, lot-level or serial-level scoring may be necessary for controlled inventory.
12.6 How Often Should High-Risk Products Be Counted?
Critical inventory may require daily, weekly, or event-triggered counts. Meanwhile, high-risk products may be counted weekly or biweekly. The final frequency should reflect movement, materiality, count capacity, and actual variance history.
12.7 Is ABC Analysis Still Useful?
Yes. ABC analysis remains useful for classifying valuable or strategically important inventory. However, value should become one factor within a broader model rather than the only basis for count frequency.
12.8 Should Fast-Moving Inventory Be Counted More Often?
Often, yes, because frequent movement creates more opportunities for receiving, picking, replenishment, and transfer errors. Nevertheless, transaction frequency should be compared with actual discrepancy history.
12.9 Should High-Value Inventory Always Be Counted First?
Not always. High-value inventory deserves strong controls, but it may not be the inventory most likely to be wrong. Therefore, probability, impact, and value should be evaluated together.
12.10 What Is an Event-Triggered Count?
An event-triggered count is created after a defined activity such as a failed pick, negative balance, large adjustment, relocation, return, lot mismatch, or repeated short shipment. Consequently, the warehouse does not need to wait for the next scheduled count.
12.11 Should Employees See the Expected Quantity?
Blind counts are generally stronger because employees record what is physically present without being influenced by the system balance. However, supervisors may view expected quantities during investigation.
12.12 How Should a Recount Be Managed?
A material difference should trigger an independent recount by another qualified employee. If both results agree, the business should review transactions before approving the adjustment. However, conflicting results may require a third count.
12.13 What Causes Repeated Discrepancies?
Common causes include receiving errors, incorrect putaway, wrong-bin picks, unrecorded replenishment, returns failures, unit-of-measure problems, transfer timing, manufacturing transactions, damage, and shrinkage.
12.14 How Is Count Accuracy Calculated?
Count Accuracy = Accurate Count Lines ÷ Total Count Lines × 100
However, businesses should also track unit variance, adjustment value, repeat discrepancy rate, and accuracy by warehouse or priority tier.
12.15 Can Cycle Counting Replace a Full Physical Inventory?
A mature program may reduce reliance on disruptive full counts. Nevertheless, accounting policies, audits, contracts, lenders, or regulations may still require broader verification.
12.16 How Many Items Should Be Counted Each Day?
Divide available counting minutes by the average minutes required per count line. Then, allocate that capacity according to inventory risk rather than creating an unmanageable backlog.
12.17 Can ERP Software Automate the Schedule?
Many ERP systems can schedule counts by item, class, location, frequency, or tolerance. However, buyers should verify whether dynamic scoring is native, configurable, or requires additional reporting.
12.18 When Should Spreadsheet-Based Counting Be Replaced?
A business should upgrade when schedules are missed, files conflict, adjustments lack reasons, warehouses use different processes, systems disagree, or management cannot analyse repeat discrepancies.
13. Practical Next Steps for More Reliable Inventory
Risk-based cycle counting should begin with a simple and explainable model.
First, choose a limited number of dependable risk factors. Next, score inventory consistently and direct counting effort toward the highest-priority SKU-location combinations. Then, investigate every material difference and use the result to improve the underlying warehouse process.
The objective is not to count more inventory. Instead, the business should count the records most likely to be wrong and the discrepancies most likely to damage fulfilment, purchasing, production, or financial reporting.
As the program matures, management should be able to answer three questions:
1. Which inventory is most likely to be inaccurate?
2. Which discrepancy would create the greatest business impact?
3. Which operating process is causing the error?
If current systems cannot answer those questions, disconnected inventory, warehouse, purchasing, accounting, ecommerce, or manufacturing applications may be limiting control.
Therefore, the next practical step is to assess current data quality, warehouse workflows, count capacity, integration gaps, and reporting requirements before selecting new software.
For inventory-driven companies reviewing a connected ERP and WMS environment, Xorosoft may be one platform to evaluate. However, the evaluation should focus on operational fit, data visibility, counting controls, and integration requirements.
Contact Xorosoft to request an ERP readiness assessment or personalized demonstration.
Recent Posts
-
 ERP Landed Cost Module vs Spreadsheet Calculations for Importers
 -
 How to Build an Open-to-Buy Plan for an Omnichannel Brand
 -
 Cold Storage WMS for Food and Beverage Distribution
 -
 ERP Buying Statistics 2026: Evaluation, Implementation, and Adoption Risks
 -
 How a Distributor Reduced B2B Order Exceptions Without Restricting Sales