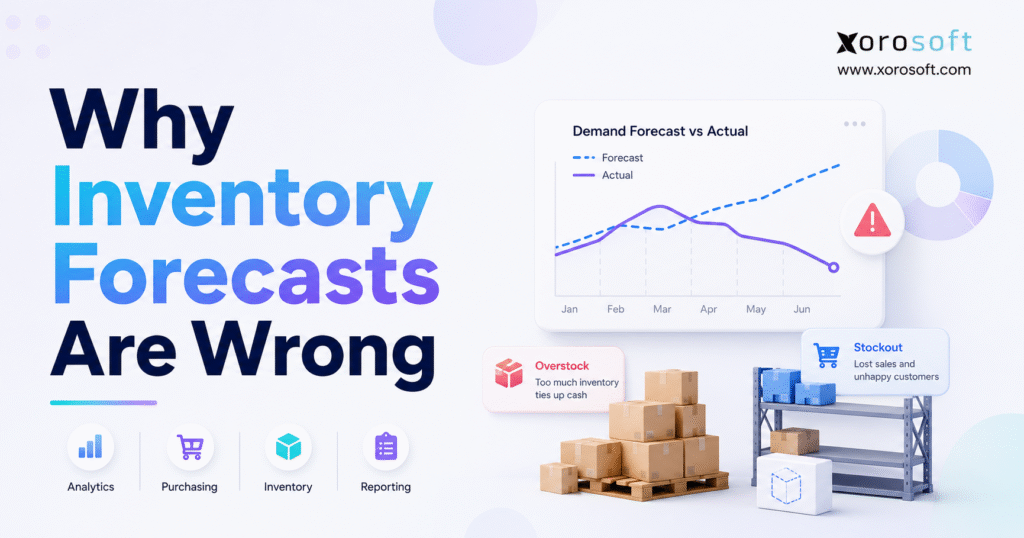
Inventory forecasting errors can have a significant impact on your business operations and profitability.
1. Inventory Forecasts Usually Fail Before the Calculation Begins
Inventory forecasting errors rarely begin with the forecasting formula. Instead, they usually begin with the data, assumptions, and operating processes that feed the calculation.
A forecast can look mathematically sound and still produce a poor purchasing decision. For example, the model may rely on an incorrect on-hand balance, sales history that hides stockouts, temporary promotional demand, or supplier lead times that no longer match reality. As a result, the system calculates an answer from inputs that do not represent the business accurately.
Growing companies often recognize the symptoms before they identify the cause. Best-selling products run out unexpectedly. Slow-moving products keep arriving. Buyers place emergency purchase orders. Meanwhile, finance sees cash tied up in inventory, and warehouse teams struggle to store products that are not selling.
Therefore, companies should treat forecasting as an operational process rather than a standalone statistical exercise. The demand estimate matters, but so do available inventory, allocations, inbound supply, supplier reliability, safety stock, order quantities, warehouse capacity, and product lifecycle status.
Inventory forecasting errors occur when historical records, business assumptions, or planning methods fail to reflect future customer demand. Common causes include inaccurate inventory data, stockouts, promotions, changing demand patterns, unsuitable forecasting methods, incorrect lead times, and uncontrolled manual adjustments.
However, no company can remove all uncertainty. Customer preferences change, suppliers miss dates, and competitors launch promotions. The practical goal is to reduce preventable mistakes, measure the remaining risk, and translate the forecast into better inventory decisions.
2. What an Inventory Forecast Is Actually Trying to Predict
Inventory teams often use sales forecast, demand forecast, and inventory forecast as though they mean the same thing. However, each one answers a different business question.
2.1 Demand Forecasting Versus Inventory Forecasting
A demand forecast estimates how many units customers are likely to request during a defined period. Depending on the operation, planners may create that estimate by product, SKU, warehouse, channel, customer group, or region.
An inventory forecast turns expected demand into an inventory requirement. Therefore, it must consider more than sales volume.
Suppose a company expects customers to buy 1,000 units during the next eight weeks. The buyer should not automatically purchase 1,000 units. Instead, the final requirement should account for current available stock, inventory already allocated, confirmed inbound purchase orders, expected returns, supplier lead times, safety stock, production capacity, minimum order quantities, warehouse space, and service-level targets.
Consequently, a demand forecast can be reasonable while the purchase recommendation remains wrong.
2.2 Recorded Sales Versus True Customer Demand
Recorded sales show what customers successfully purchased. They do not always show everything customers wanted to purchase.
When a product remains available, sales may closely represent demand. However, when the product stocks out, recorded sales become limited by available inventory.
For example, a product may normally sell 20 units per day. It then becomes unavailable for five days, so sales fall to zero. If the planning process treats those five days as zero demand, the next forecast will likely fall. Therefore, the business may purchase less inventory and create another stockout.
True demand may also include cancelled backorders, unfulfilled wholesale requests, customers who selected substitutes, shoppers who left the website, and marketplace demand lost while a listing was unavailable.
This gap between fulfilled sales and actual demand creates some of the most persistent inventory forecasting errors.
2.3 Normal Uncertainty Versus Preventable Forecasting Mistakes
Not every forecasting miss signals a broken process.
Some differences result from unpredictable events, including sudden weather changes, competitor activity, economic shifts, supplier disruptions, unexpected social-media exposure, or one-time customer orders.
Other differences come from preventable problems. For instance, the business may use poor data, outdated lead times, unsuitable methods, or undocumented planner overrides.
Therefore, teams should classify forecast differences into four groups:
1. Random demand variation
2. Data-quality errors
3. Forecasting-method errors
4. Planning and execution errors
This distinction helps managers focus on problems they can actually correct.
3. The 15 Most Common Inventory Forecasting Errors
3.1 Inaccurate Inventory Data Distorts Every Forecast
A reasonable demand estimate still produces the wrong purchase order when the on-hand balance is wrong. Delayed receipts, picking mistakes, unrecorded transfers, damaged stock, shrinkage, and unprocessed returns all distort availability.
Therefore, teams should strengthen scanning, cycle counting, and transaction discipline. A connected warehouse management system can support those controls across multiple locations.
3.2 Sales History Is Treated as Complete Demand History
Sales show fulfilled transactions, not every customer request. For example, a wholesale customer may request 500 units but receive only 300.
Unless the business records the missing quantity, future demand appears lower than it was. Consequently, planners should combine sales with backorders, cancellations, lost wholesale quantities, substitutions, availability data, and customer enquiries.
3.3 Stockouts Create Repeating Demand Forecasting Errors
A stockout reduces recorded sales. The forecast then interprets lower sales as weaker demand, so the next purchase recommendation falls and another stockout becomes more likely.
Instead, teams should flag out-of-stock periods and estimate hidden demand from earlier velocity, website activity, comparable locations, backorders, or substitute sales. This correction prevents repeated inventory forecasting errors.
3.4 Incomplete Historical Data Weakens Forecast Accuracy
Historical records often sit across ecommerce, accounting, warehouse, EDI, and spreadsheet systems. Moreover, SKU changes, migrations, missing returns, and inconsistent channel identifiers create gaps.
Before selecting a model, planners should map products, warehouses, channels, and transactions consistently. Clean, relevant history usually provides more value than a larger but unreliable dataset.
3.5 Promotional Demand Becomes the New Baseline
Promotions create temporary sales increases. However, when planners treat that uplift as recurring demand, the next order may create excess stock.
Therefore, teams should record campaign dates, discount depth, included products, channel, availability, incremental units, and post-promotion behavior. They should preserve event history while separating it from normal baseline demand.
3.6 One Forecasting Method Covers Every SKU
Stable, seasonal, intermittent, new, and declining products behave differently. Consequently, one model rarely suits every SKU.
Teams should segment products by volume, variability, lifecycle, lead time, commercial importance, and shortage cost. ABC analysis can classify value, while XYZ analysis can classify demand stability. Together, those groups support more appropriate methods and review cycles.
3.7 Forecasts Use the Wrong Level of Detail
Aggregation can improve statistical accuracy, but buyers still order at the SKU and location level. A clothing collection may meet its total forecast while popular sizes stock out.
Therefore, planners should review category, product, SKU, warehouse, channel, and region forecasts together. The category can provide a control total, while lower levels guide allocation.
3.8 Incorrect Lead Times Create the Wrong Planning Horizon
True lead time includes preparation, production, transit, customs, receiving, inspection, and put-away. In addition, variability matters as much as the average.
A buyer with a 90-day replenishment cycle needs a useful 90-day forecast, not merely an accurate one-week estimate. Therefore, companies should calculate actual lead times from purchase release to usable inventory.
3.9 Product Lifecycle Changes Stay Outside the Forecast
Launch, growth, maturity, decline, and discontinuation require different assumptions. Historical averages become misleading when a product moves into a new stage.
Therefore, planners should assign lifecycle statuses such as new, mature, declining, end of season, discontinued, and replacement product. This practice reduces reorders for items that the business should sell through.
3.10 Cannibalization and Substitution Remain Invisible
A new color, design, package, or replacement model may shift demand from an existing SKU rather than create entirely new demand.
If planners ignore that relationship, they may overforecast the old product and underforecast the new one. Consequently, assortment planning should include substitution links, replacement dates, and planned discontinuations.
3.11 Sales Targets Replace Evidence-Based Forecasts
A target describes what the company wants to achieve, while a forecast estimates what customers will likely buy.
Although both matter, buyers should not purchase against an aggressive target without testing its assumptions. Businesses should maintain separate statistical forecasts, sales estimates, management targets, and approved operating forecasts.
3.12 Manual Overrides Introduce Forecast Bias
Planner judgment can add value when a person knows about a promotion, customer, launch, or supply constraint. However, undocumented changes introduce inconsistency.
Every override should record the original value, revised value, reason, owner, date, and approval. Afterward, managers should compare adjusted performance with the statistical baseline and measure whether the override helped.
3.13 Ecommerce and Wholesale Signals Remain Disconnected
Shopify, Amazon, wholesale, retail, and EDI channels often show different patterns. Inventory forecasting errors increase when teams miss returns, cancellations, bundles, preorders, allocations, and location-level availability.
Moreover, available, committed, incoming, and on-hand quantities are not interchangeable. The Xorosoft ERP Shopify integration shows how channel activity can connect with broader operations.
3.14 Forecasts Change Too Slowly
A quarterly forecast can become outdated within weeks because customer orders, promotions, supplier delays, seasonality, and marketplace performance change.
However, not every SKU needs daily attention. Companies should use exception-based reviews, giving high-value, volatile, seasonal, and short-lifecycle products more frequent attention than stable, lower-risk items.
3.15 Statistical Accuracy Replaces Inventory Performance
A model can report low average error while repeatedly missing critical products.
Therefore, teams should assess inventory forecasting errors alongside fill rate, stockout frequency, inventory turns, aged stock, holding cost, shortage cost, expedited freight, and write-offs.
Ultimately, the best forecast supports better inventory decisions rather than merely producing the lowest statistical score.
4. Why Better Forecast Accuracy Does Not Guarantee Better Inventory
4.1 Product Importance Changes the Cost of Forecast Error
A 20-unit error can create very different consequences across two products.
For a low-value item with several substitutes, the impact may remain limited. However, for a high-margin product promised to a major customer, the same error can create lost revenue and damage the relationship.
Therefore, forecast reviews should consider revenue, margin, customer commitments, product criticality, substitution options, and replenishment lead time.
4.2 Overforecasting Creates Working-Capital Pressure
When teams consistently overforecast, the business purchases more inventory than it can sell.
The cost extends beyond the purchase price. Excess inventory also creates storage, handling, insurance, markdown, obsolescence, and warehouse-capacity costs.
Moreover, the company loses the opportunity to invest that cash elsewhere. Therefore, finance and operations should review forecast bias together.
4.3 Underforecasting Damages Service Levels
Underforecasting can lead to lost sales, delayed wholesale orders, emergency purchasing, expedited freight, and unplanned substitutions.
Safety stock can absorb some uncertainty. However, teams should not use it to hide repeated forecast problems.
Instead, managers should investigate whether poor data, censored demand, incorrect lead times, or overly conservative overrides drive the shortage.
4.4 Inventory Planning Must Balance Cost and Availability
The practical objective is not maximum availability at any cost. Nor should the company minimize inventory regardless of customer demand.
A useful plan balances service level, holding cost, shortage cost, supplier reliability, margin, warehouse capacity, and cash constraints.
Forecast accuracy supports this decision. Nevertheless, it cannot replace sound inventory policy. Therefore, teams should judge inventory forecasting errors by both statistical and operational impact.
5. Forecast Accuracy Metrics for Inventory Planning
No single metric works for every SKU. Therefore, companies should combine measures that show both error magnitude and error direction.
5.1 Mean Absolute Error for Unit-Level Forecasting
Mean Absolute Error measures the average difference between forecast and actual demand in units.
If MAE equals 25, the forecast misses actual demand by an average of 25 units. Because the metric stays in units, operational teams can interpret it easily.
However, MAE does not support simple comparisons between products with very different sales volumes. An error of 25 units may be minor for one product and severe for another.
5.2 MAPE and Its Limits for Slow-Moving Inventory
Mean Absolute Percentage Error expresses error as a percentage of actual demand.
MAPE can work well for products with stable, positive demand. However, the calculation becomes unreliable when actual demand approaches zero. In addition, the standard formula cannot handle zero actual demand.
Therefore, companies should not use MAPE as the only measure for intermittent or slow-moving products.
5.3 WAPE for Portfolio-Level Accuracy
Weighted Absolute Percentage Error compares total absolute error with total actual demand.
Because high-volume products carry more influence, WAPE can provide a useful portfolio view. However, it may hide issues affecting low-volume but strategically important products.
Consequently, teams should combine WAPE with SKU-level exception reporting.
5.4 RMSE for Large Forecasting Misses
Root Mean Square Error gives additional weight to large misses because the calculation squares each error.
This approach can help when a major stockout or overstock event creates disproportionate cost. However, one extreme event can dominate the result.
Therefore, managers should interpret RMSE alongside a simpler unit-based measure.
5.5 Forecast Bias for Directional Error
Forecast bias shows whether the business repeatedly forecasts above or below actual demand.
Persistent overforecasting creates excess stock. Meanwhile, persistent underforecasting increases stockout risk.
Bias should accompany an error-magnitude metric because positive and negative errors can cancel one another. As a result, the business may see low net bias even when individual errors remain large.
6. How to Reduce Inventory Forecasting Errors
6.1 Correct Inventory Records Before Changing the Model
First, validate available stock, allocated stock, damaged inventory, returns, open purchase orders, warehouse transfers, work-in-process, and third-party logistics balances.
Then, count high-value and high-variance SKUs first.
Inventory forecasting errors will continue when the planning system starts from an unreliable stock position. Therefore, businesses should fix inventory controls before investing in more complex forecasting logic.
6.2 Reconstruct Demand Hidden by Stockouts
Next, flag periods when products were unavailable and estimate the demand the business may have lost.
Useful signals include pre-stockout sales velocity, backorders, website activity, customer enquiries, comparable locations, substitute-product sales, and unfulfilled wholesale requests.
The method should remain documented and testable. Although no estimate will be perfect, it will usually reflect demand better than a zero-sales assumption.
6.3 Segment Products by Demand Behavior
Companies should create practical forecasting groups such as stable, trending, seasonal, intermittent, promotional, new, declining, and discontinued.
Each group should then receive its own forecasting method, review schedule, safety-stock policy, replenishment rule, and exception threshold.
As a result, the planning process can match the product rather than forcing every SKU into one model.
6.4 Separate Promotional Demand from Baseline Demand
Promotional events should receive clear tags rather than disappearing from the history.
A future campaign may repeat the event, so planners still need the information. However, they should not treat temporary uplift as permanent baseline demand.
Therefore, teams should measure both promotional lift and post-promotion decline.
6.5 Replace Quoted Lead Times with Actual Performance
Businesses should calculate lead time from purchase-order release until inventory becomes usable.
They should review the average, median, longest lead time, variability, receiving delays, and supplier-specific performance.
Consequently, forecast horizons, reorder points, and safety-stock rules will reflect actual replenishment behavior.
6.6 Test Simple Forecasts Before Complex Models
A complex method should outperform a simple baseline.
Useful baselines include the last period, the same period last year, a moving average, or recent sales velocity.
If a more advanced model does not improve the decision, the additional complexity may not be justified. Therefore, teams should always compare sophistication with measurable value.
6.7 Control Manual Overrides
Create standard override reasons, require supporting notes, and review results after the period closes.
Measure the statistical forecast, adjusted forecast, planner value added, override bias, and common adjustment reasons.
This process turns judgment into a controlled input rather than an unmeasured opinion.
6.8 Connect Forecasts with Purchasing and Replenishment
Forecasts should inform reorder points, safety stock, purchase recommendations, supplier minimums, order multiples, production plans, warehouse transfers, and cash-flow planning.
A cloud ERP for inventory-driven businesses can connect forecasting with inventory, purchasing, accounting, manufacturing, and warehouse activity. However, the company still needs approved planning rules and accurate transactions.
6.9 Review Operational and Financial Outcomes
Finally, forecast reviews should answer practical questions:
1. Did availability improve?
2. Did aged inventory decline?
3. Did emergency purchasing decrease?
4. Did inventory turns improve?
5. Did bias change?
5. Did manual overrides add value?
6. Did warehouse capacity improve?
A unified operational platform can make these relationships easier to analyze when sales, inventory, purchasing, warehouse, and financial records share one environment.
7. Why Inventory Forecasting Becomes Harder as Companies Grow
7.1 SKU and Variant Growth Increases Complexity
Growing companies often add products, colors, sizes, packaging formats, bundles, and regional variations.
Category demand may remain predictable while SKU demand fragments. Therefore, the number of planning decisions can grow much faster than revenue.
7.2 Multi-Warehouse Inventory Creates Local Demand Problems
Demand differs by geography, customer type, channel, and fulfilment promise.
A company may need warehouse-level forecasts, central control totals, transfer recommendations, channel-allocation rules, and regional safety stock.
Moreover, inventory in one facility may not satisfy demand in another without additional cost and delay.
7.3 Shopify, Amazon, and Wholesale Behave Differently
Different channels use different promotion calendars, return patterns, order sizes, service expectations, and allocation rules.
A combined forecast supports company-level planning. However, channel-specific demand still matters for purchasing and fulfilment.
7.4 Manufacturing Adds Component-Level Planning
Finished-goods demand must flow through bills of materials, component requirements, work orders, production capacity, yield assumptions, and material lead times.
As a result, one finished product can create demand across several inventory levels.
7.5 Disconnected Systems Create Conflicting Inputs
A growing company may operate Shopify, QuickBooks, spreadsheets, an inventory app, a warehouse system, and an EDI tool.
When each system holds part of the planning picture, teams spend time exporting and reconciling data. Consequently, inventory forecasting errors often reflect system fragmentation rather than a weak formula. Reducing inventory forecasting errors at this stage requires one trusted operational dataset.
Xorosoft supports inventory-driven businesses that need inventory, purchasing, accounting, warehousing, manufacturing, and ecommerce workflows within one cloud ERP environment.
8. Inventory Forecasting Errors by Industry
Companies can review ERP solutions for inventory-driven industries when evaluating how planning requirements change across operating models.
8.1 Apparel Inventory Forecasting Errors
Apparel businesses must plan style, color, size, seasonal collection, return, and markdown demand.
A product-family forecast may appear accurate. However, the business can still miss the size and color combinations customers actually want.
Therefore, apparel teams need both category control totals and variant-level allocation logic.
8.2 Furniture Demand Forecasting Challenges
Furniture businesses often manage long lead times, large units, collections, made-to-order products, high values, and limited warehouse space.
Even a modest overforecast can tie up substantial cash and capacity. Consequently, planners should combine demand forecasts with space, supplier, and cash constraints.
8.3 Sporting Goods Forecast Variability
Sporting-goods demand can change with weather, season, region, events, school schedules, and product launches.
The selling window may also remain short. Therefore, late inventory can become almost as costly as excess inventory.
8.4 Food and Beverage Forecasting Risk
Shelf life increases the cost of overforecasting.
Planning should account for expiration dates, lot requirements, promotions, seasonal consumption, waste, and temperature-controlled capacity.
As a result, teams should evaluate forecast accuracy together with spoilage and service levels.
8.5 Wholesale Demand Planning Errors
Wholesale demand may include EDI orders, contracts, standing orders, customer pricing, large one-time purchases, and allocation requirements.
One large order should not automatically become the new baseline. Instead, planners should separate recurring demand from exceptional customer activity.
8.6 Manufacturing Forecasting Errors
Manufacturers must translate finished-goods demand into raw materials, subassemblies, work orders, capacity, and supplier purchases.
Therefore, a single forecasting mistake can affect several inventory levels and production schedules.
9. Spreadsheet Forecasting Versus Connected ERP Forecasting
| Capability | Spreadsheet Forecasting | Inventory-Only Software | Connected ERP |
|---|---|---|---|
| Sales data | Manual imports | Partly connected | Integrated with operations |
| Warehouse inventory | Periodic updates | Usually included | Connected with transfers and fulfilment |
| Purchasing | Separate sheets | Varies | Linked with approvals and inventory |
| Accounting | Separate | Usually separate | Connected financial records |
| Manufacturing | Manual | Often limited | May support BOMs and work orders |
| Forecast governance | Manual | Varies | Centralized workflows |
| Multi-warehouse planning | Difficult | Often available | Connected with transfers and purchasing |
| Audit trail | Limited | Varies | User and transaction history |
Spreadsheets remain useful for small product ranges, temporary models, and scenario planning.
However, problems emerge when several people maintain different versions, data arrives from multiple systems, and purchase decisions depend on stale files.
Inventory-only software may improve stock visibility but leave accounting, manufacturing, or financial planning in separate applications.
A connected ERP can reduce manual reconciliation. Nevertheless, the right platform depends on business size, process maturity, budget, implementation capacity, and operational complexity.
Companies evaluating broader options can review Xorosoft versus NetSuite while also considering platforms such as Acumatica, Business Central, Sage, Cin7, Brightpearl, and Fishbowl.
10. When Forecasting Software Is Not the Immediate Answer
Advanced software may not be necessary when a business has a small and stable product range, one warehouse, short lead times, low inventory value, a reliable manual purchasing process, and limited historical data.
Software will also fail to solve undefined purchasing responsibilities, inconsistent product codes, or inaccurate warehouse transactions.
Therefore, some businesses should first improve inventory counting, receiving procedures, SKU governance, supplier records, purchasing approval, and promotion documentation.
A clean manual process often performs better than an automated process built on unreliable data.
11. Warning Signs That Forecasting Has Outgrown Spreadsheets
11.1 Operational Warning Signs
Common signs include frequent stockouts, persistent overstock, emergency purchase orders, manual allocation, conflicting departmental forecasts, and repeated inventory reconciliation.
When these problems appear together, inventory forecasting errors usually reflect a broader planning issue.
11.2 Financial Warning Signs
Finance may see cash tied up in slow-moving stock, rising markdowns, write-offs, expedited freight, delayed inventory valuation, slow month-end close, and unreliable margin reporting.
Therefore, the business should review forecasting, purchasing, warehouse, and accounting workflows together.
11.3 Technology Warning Signs
The company may combine Shopify, Amazon, and wholesale data manually. Warehouse and accounting records may disagree. Forecast files may move through email, while multi-warehouse planning exceeds spreadsheet capacity.
At this stage, the problem may extend beyond the formula. Instead, the business may need connected inventory, purchasing, warehouse, and financial processes.
12. A 30-Day Plan to Reduce Inventory Forecasting Errors
12.1 Week One: Validate Inventory and Transactions
First, count high-value and high-variance SKUs. Then, reconcile open purchase orders, review transfers, identify stockout periods, correct product mappings, and separate damaged, allocated, and available stock.
12.2 Week Two: Segment Demand Patterns
Next, identify stable products, seasonal demand, promotions, intermittent items, new products, declining products, and substitutions.
This segmentation creates the foundation for more appropriate methods and review cycles.
12.3 Week Three: Test Forecast Accuracy
Create a simple baseline. Then, compare suitable methods, calculate MAE or WAPE, measure bias, review forecast horizons, and compare manual overrides with the statistical estimate.
12.4 Week Four: Connect Forecasts with Decisions
Finally, update supplier lead times, review safety stock, correct reorder points, test purchase recommendations, measure stockouts, review aged inventory, and track expedited orders.
The audit does not aim to find one perfect number. Instead, it identifies where forecast, inventory, purchasing, and warehouse decisions become disconnected.
13. Frequently Asked Questions About Inventory Forecasting Errors
13.1 What Is an Inventory Forecast?
An inventory forecast estimates how much stock a business may need during a future period. It combines expected demand with available inventory, inbound supply, lead times, safety stock, and service targets. Therefore, it guides purchasing, transfer, and production decisions.
13.2 Why Are Inventory Forecasts Wrong?
Forecasts become wrong when historical data, operating assumptions, or planning methods fail to reflect future demand. Common causes include stockouts, inaccurate inventory, promotions, changing lead times, lifecycle changes, and disconnected systems. However, normal uncertainty also creates differences.
13.3 Can an Inventory Forecast Be Completely Accurate?
No forecast can remain completely accurate because customer behavior and supply conditions change. Therefore, businesses should reduce preventable errors, measure bias, and build replenishment rules that absorb reasonable variation.
13.4 What Is an Inventory Forecasting Error?
An inventory forecasting error is the difference between predicted and actual demand during a specific period. Teams can measure it in units, percentages, or scaled values. They should also review direction because overforecasting and underforecasting create different risks.
13.5 What Is Good Forecast Accuracy?
No universal benchmark defines good accuracy. The right level depends on demand pattern, forecast horizon, volume, aggregation, service target, and shortage cost. Therefore, businesses should compare each product group with a suitable baseline.
13.6 What Is the Difference Between Sales and Demand?
Sales represent completed transactions. Demand also includes lost sales, backorders, cancelled orders, and substitutions. Consequently, sales may understate demand whenever products become unavailable.
13.7 How Do Stockouts Affect Forecasting?
Stockouts reduce recorded sales because customers cannot buy unavailable products. If the system treats those lower sales as true demand, future forecasts may fall. Therefore, planners should flag stockout periods and estimate hidden demand.
13.8 Should Stockout Periods Be Removed?
Teams should flag stockout periods rather than delete them automatically. They can then estimate hidden demand and compare results with and without the adjustment. This approach preserves timing and seasonality information.
13.9 How Do Promotions Affect Forecast Accuracy?
Promotions create temporary demand increases. If planners treat that increase as permanent baseline demand, the company may overbuy afterward. Therefore, teams should record campaign timing, discount depth, availability, and post-promotion behavior.
13.10 How Much Historical Data Is Needed?
The answer depends on the product. Seasonal items may need several comparable seasons, while stable products may need less history. However, clean and relevant data matters more than a large volume of outdated records.
13.11 How Often Should Forecasts Be Updated?
High-value, volatile, seasonal, or short-lifecycle products may require weekly review. Stable products may need monthly review. Therefore, exception reporting helps teams focus on meaningful changes.
13.12 What Is Forecast Bias?
Forecast bias shows whether estimates consistently fall above or below actual demand. Persistent overforecasting creates excess inventory, while underforecasting raises stockout risk. Therefore, teams should monitor bias alongside total error.
13.13 What Causes Persistent Overforecasting?
Common causes include optimistic targets, promotional demand carried into the baseline, outdated growth assumptions, missed product decline, and planner optimism. In addition, ignored returns and product cannibalization can inflate demand.
13.14 What Causes Persistent Underforecasting?
Underforecasting often results from stockout-censored sales, missing channel data, underestimated growth, missed promotions, or conservative overrides. Therefore, teams should review both data completeness and planner behavior.
13.15 Is MAPE Suitable for Slow-Moving Products?
MAPE usually performs poorly as the only metric for slow-moving products because percentage error becomes unstable near zero. Instead, teams can use MAE, MASE, bias, service level, and inventory outcomes.
13.16 What Is WAPE?
WAPE compares total absolute error with total actual demand. It supports portfolio reporting because high-volume products carry more influence. However, it can hide important low-volume problems.
13.17 How Should New Products Be Forecast?
Teams can use comparable products, attributes, customer commitments, preorders, market research, and scenario ranges. Moreover, they should review early results frequently because each new period adds valuable information.
13.18 How Do You Forecast Intermittent Demand?
Intermittent-demand forecasting considers both how often demand occurs and how much customers request when it occurs. Therefore, planners should avoid relying only on percentage metrics or simple averages.
13.19 How Do Multiple Warehouses Affect Forecasts?
Multiple warehouses create local demand, transfers, allocation rules, and different service requirements. Consequently, businesses may need location-level forecasts supported by a central company forecast.
13.20 Can Shopify Sales Be Forecast Accurately?
Shopify sales can support accurate forecasts when the business records product, location, return, cancellation, promotion, and availability data consistently. However, planners should combine Shopify data with other relevant channels.
13.21 Is Forecasting Software Better Than Excel?
Forecasting software becomes more useful when a business manages many SKUs, warehouses, channels, updates, and planners. However, Excel can still work for smaller and less complex operations.
13.22 Can ERP Improve Forecast Accuracy?
ERP can improve access to connected sales, inventory, purchasing, warehouse, manufacturing, and accounting data. Nevertheless, the company still needs accurate transactions and disciplined planning processes.
13.23 When Should a Business Replace Spreadsheet Forecasting?
A business should consider upgrading when teams maintain conflicting files, data imports repeat constantly, multi-warehouse visibility remains limited, and purchasing depends on stale information. Frequent stockouts and excess inventory add further evidence.
13.24 What Should Forecasting Software Include?
Useful capabilities include demand segmentation, stockout identification, promotion history, forecast-versus-actual reporting, bias measurement, lead-time tracking, purchase recommendations, multi-warehouse planning, and override controls.
13.25 Who Does Not Need Advanced Forecasting Software?
Businesses with few products, one warehouse, stable demand, short lead times, and reliable manual purchasing may not need advanced software immediately. Instead, they may gain more from stronger inventory controls.
14. Practical Next Steps for Building a More Reliable Forecasting Process
Inventory forecasting errors will never disappear completely. Customer behavior, supplier performance, market conditions, and product demand will always contain uncertainty.
However, businesses can remove many preventable inventory forecasting errors.
First, correct inventory records. Next, reconstruct demand hidden by stockouts. Then, separate promotional activity, validate supplier lead times, segment products by demand pattern, and measure bias alongside operational outcomes.
Most importantly, connect the forecast with the decisions it supports. Purchasing, safety stock, warehouse transfers, production, accounting, and cash-flow planning should not operate from separate versions of the truth.
As complexity grows, disconnected applications and spreadsheets make that coordination harder. Xorosoft connects inventory management, purchasing, forecasting, warehousing, manufacturing, ecommerce operations, and accounting within one cloud ERP platform for inventory-driven companies.
A personalized ERP assessment or demo can help determine whether inaccurate forecasts primarily come from data quality, planning processes, or disconnected systems.
Recent Posts
-
 ERP Landed Cost Module vs Spreadsheet Calculations for Importers
 -
 How to Build an Open-to-Buy Plan for an Omnichannel Brand
 -
 Cold Storage WMS for Food and Beverage Distribution
 -
 ERP Buying Statistics 2026: Evaluation, Implementation, and Adoption Risks
 -
 How a Distributor Reduced B2B Order Exceptions Without Restricting Sales