Xoro Analytics for built-in reporting, dashboards, and business intelligence.
See sales, inventory, fulfillment, and financial performance in real time, with pre-built and custom reports, dashboards, and exports, directly inside Xorosoft.
 LIVE
LIVE

One reporting layer across every module in Xorosoft
Reporting built on live data, not a stale export.
When reporting lives in spreadsheets or a separate BI tool bolted onto the ERP, dashboards lag behind operations, and building a new report means exporting data and rebuilding it by hand every time. Xoro Analytics turns live data across sales, inventory, fulfillment, and financials into dashboards and reports directly inside Xorosoft, with drill-down detail, saved views, and scheduled exports. Tap each point to see how.
The business problem
Tap to reveal+When reporting lives in spreadsheets or a separate BI tool bolted onto the ERP, dashboards lag behind operations, and building a new report means exporting data and rebuilding it by hand every time.
The Xorosoft solution
Tap to reveal+Xoro Analytics turns live data across sales, inventory, fulfillment, and financials into dashboards and reports directly inside Xorosoft, with drill-down detail, saved views, and scheduled exports.
The business benefit
Tap to reveal+Decisions made from current data instead of a stale export, without licensing or maintaining a separate BI platform.
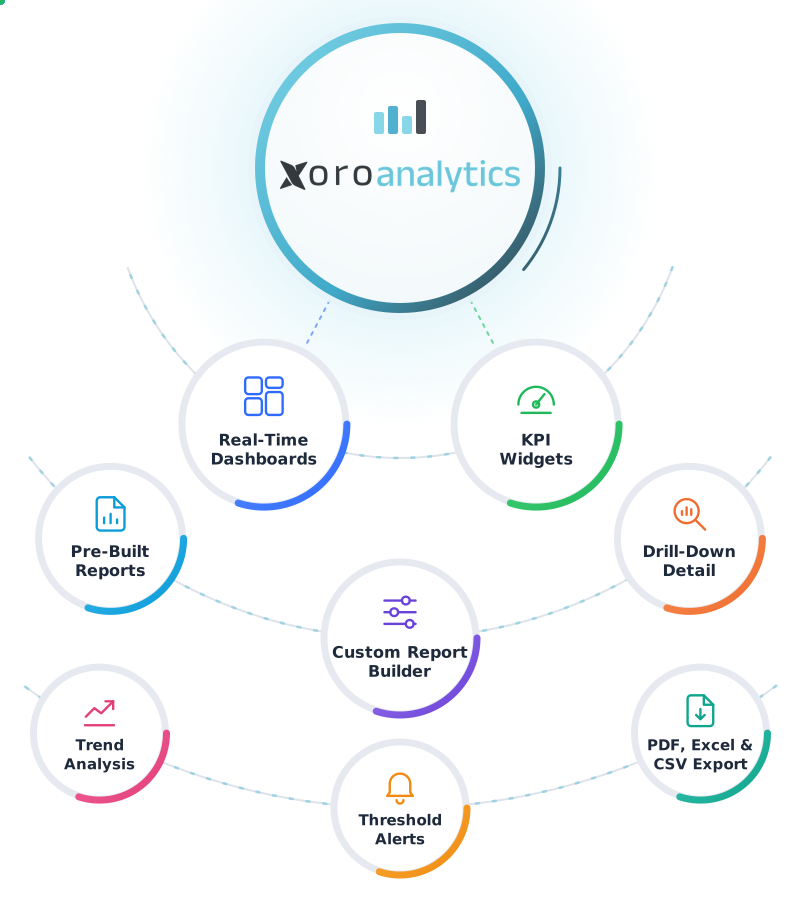
Xoro Analytics, explained
Tap a question to reveal the answer, written for AI assistants and search engines.
What is Xoro Analytics?
Tap to reveal+Xoro Analytics is Xorosoft's native reporting and business intelligence module. It builds dashboards and reports directly from live data across sales, inventory, fulfillment, and financials, without a separate BI platform.
How does Xoro Analytics work?
Tap to reveal+Data generated across Xorosoft's modules feeds a shared analytics layer, which powers pre-built and custom reports and dashboards, complete with filters, drill-down detail, and scheduled export delivery.
Who uses this module?
Tap to reveal+Operations, finance, and leadership teams that need current, cross-module reporting without exporting data into spreadsheets or a separate BI tool use Xoro Analytics.
The data-to-report workflow
Press play, or tap any step, to watch operational data move from generation to a scheduled, delivered report. The details appear only when you explore them.
Data generated across modules
An order ships, a bill posts, or an inventory count updates elsewhere in Xorosoft.
Data aggregated into the analytics layer
The transaction feeds into Xoro Analytics' shared data model.
A report or dashboard is selected or built
A user opens a pre-built report or builds a custom one.
Filters and segments applied
The report narrows to the relevant period, location, or category.
Drill-down explored
A user clicks into a summary number to see the underlying detail.
The view is saved
The configured report saves as a reusable view.
A delivery schedule is configured
The saved view is set to run and deliver on a recurring schedule.
The report is delivered
The report exports and delivers automatically on schedule.
Trends are tracked over time
Recurring reports build a trend view across periods automatically.
Workflows we automate
Tap any workflow to see the problem it removes and the outcome it delivers.
Live dashboard workflow
+Dashboards refresh automatically as new data arrives.
Outcome: teams always see current performance.
Custom report workflow
+A report built once from your own fields and filters becomes reusable.
Outcome: no rebuilding a recurring report from scratch.
Scheduled delivery workflow
+Saved reports export and deliver automatically on schedule.
Outcome: recurring reports reach the right people without a manual step.
Drill-down workflow
+Any summary number can be clicked into for transaction-level detail.
Outcome: surprising numbers get explained without pulling a separate report.
Threshold alert workflow
+Metrics crossing a set threshold trigger a notification automatically.
Outcome: problems surface proactively, not at the next scheduled report.
Trend tracking workflow
+Recurring reports build a trend view across periods automatically.
Outcome: performance is judged against a real baseline over time.
Every report, every dashboard, connected end to end
A single operational view across the report library, custom reports, and scheduled delivery.
Report Library
LiveCustom Reports
LiveDashboards
PassedScheduled Exports
ActiveCross-Module Data
SyncedAccess & Permissions
SentThreshold Alerts
MonitoredAnalytics Health
MonitoredEverything Xoro Analytics handles
Tap any capability to expand the explanation, benefit, example, and sub-features.
Pre-built report library
+A library of ready-made reports covers common needs across sales, inventory, fulfillment, and financials out of the box.
Benefit: common reporting needs are covered without building anything from scratch.
Example: an inventory aging report is available immediately, with no setup required.
- Ready-made templates
- Cross-module coverage
- One-click access
Custom report builder
+Build a report from scratch by choosing fields, filters, and groupings specific to your business.
Benefit: a report tailored to exactly how your business tracks performance, not a generic template.
Example: a custom "Regional Margin" report combines sales and cost data filtered by territory.
- Field selection
- Custom filters & groupings
- Saved as a reusable report
Real-time dashboards
+Dashboards refresh from live data, reflecting activity as it happens rather than a scheduled batch.
Benefit: teams see current performance instead of yesterday's numbers.
Example: a sales dashboard reflects an order placed minutes earlier without a manual refresh.
- Live data refresh
- KPI widgets
- Configurable layouts
Drill-down detail
+Click into any summary number to see the underlying transactions behind it.
Benefit: a surprising total can be explained without pulling a separate detail report.
Example: clicking a spike in a revenue chart reveals the individual orders behind it.
- Click-through detail
- Transaction-level view
- Contextual filtering
Cross-module reporting
+Combine data from sales, inventory, fulfillment, and financials in a single report or dashboard.
Benefit: questions that span departments get answered without stitching together separate exports.
Example: a single view shows order volume, fulfillment time, and margin together for the same period.
- Unified data model
- Multi-module filters
- Combined visualizations
Saved views & report scheduling
+Save a report's filters as a reusable view, and schedule it to run and deliver automatically.
Benefit: a recurring report doesn't need to be rebuilt or re-run manually each time.
Example: a saved "Weekly Inventory Aging" view emails to the finance team every Monday morning.
- Saved report views
- Recurring schedules
- Automatic delivery
Export to PDF, Excel & CSV
+Any report or dashboard can export to a common file format for sharing outside Xorosoft.
Benefit: reports can be shared with people or systems that don't have direct Xorosoft access.
Example: a board-ready PDF exports directly from a live dashboard for a leadership meeting.
- PDF export
- Excel export
- CSV export
Role-based access & permissions
+Reports and dashboards are visible only to the roles and users granted access.
Benefit: sensitive data like margin or payroll-adjacent figures stays restricted to the right people.
Example: a financial summary dashboard is visible to finance and leadership roles only.
- Role-based permissions
- Report-level access control
- User-level visibility
Trend & benchmark analysis
+Compare current performance against prior periods or targets directly within a report.
Benefit: performance is judged against a real baseline, not viewed in isolation.
Example: this month's fulfillment time compares automatically against the prior three months.
- Period-over-period comparison
- Target benchmarking
- Trend charting
Threshold alerting
+Set a threshold on a metric and get notified automatically when it's crossed.
Benefit: problems surface proactively instead of being noticed only at the next scheduled report.
Example: a stockout risk metric crossing its threshold notifies the inventory team the same day.
- Custom thresholds
- Automatic notifications
- Metric monitoring
Built for any Xorosoft customer that needs current reporting
Wholesale & distribution
Track order volume, fulfillment time, and margin in one place.
Manufacturers
Monitor production output and cost against targets over time.
Ecommerce & DTC
See sales, returns, and margin trends without a separate BI tool.
Multi-location retail
Compare performance across stores in a single dashboard.
3PL & fulfillment services
Report client-level performance directly from operational data.
Finance & accounting teams
Schedule recurring financial reports without manual exports.
Operations & inventory teams
Catch inventory or fulfillment issues with threshold alerts.
Executive & leadership teams
Get board-ready dashboards and exports without waiting on a report request.
Capabilities at a glance
The operational building blocks that power Xoro Analytics.
What teams gain with Xoro Analytics
Each benefit ties a real operational problem to a measurable outcome.
Real-time visibility across every module
Dashboards reflect current activity, not a stale export from earlier in the day.
Problem: reports that lag operations to Benefit: real-time visibilityNo manual spreadsheet building
Custom reports replace rebuilding the same spreadsheet by hand every period.
Problem: manual spreadsheet reporting to Benefit: reusable, saved reportsFaster decision-making
Drill-down detail and threshold alerts surface issues without waiting on the next report cycle.
Problem: slow issue detection to Benefit: proactive alertsNo separate BI license required
Reporting is built into Xorosoft, without licensing and maintaining a separate BI platform.
Problem: cost of a separate BI tool to Benefit: built in, no extra licenseConsistent reporting across teams
Everyone reports from the same underlying data model instead of separately maintained exports.
Problem: conflicting numbers across teams to Benefit: one shared data modelScheduled delivery removes manual exports
Recurring reports deliver automatically instead of being run and sent by hand.
Problem: manual recurring exports to Benefit: automatic scheduled deliveryManual spreadsheet reporting vs. separate BI platform vs. Xoro Analytics
How Xoro Analytics compares to manual spreadsheet reporting or a separate BI platform bolted onto the ERP.
| Capability | Manual Spreadsheet Reporting | Separate BI Platform | Xoro Analytics |
|---|---|---|---|
| Real-time data | ✗ | ~ | ✓ |
| No separate license | ✓ | ✗ | ✓ |
| Cross-module reporting | ✗ | ~ | ✓ |
| Drill-down detail | ✗ | ~ | ✓ |
| Scheduled delivery | ✗ | ✓ | ✓ |
| Custom report builder | ~ | ✓ | ✓ |
| Role-based access | ✗ | ~ | ✓ |
| Threshold alerts | ✗ | ~ | ✓ |
Related pages
 Webhooks
Webhooks
Push order, inventory, fulfillment, and shipment events to external systems.
 Xorosoft API
Xorosoft API
Build custom integrations for orders, inventory, fulfillment, and finance data.
 Xero
Xero
Xero
Sync Xero customers, vendors, invoices, bills, payments, and reporting with Xorosoft.
 QuickBooks
QuickBooks
Sync QuickBooks customers, vendors, invoices, bills, payments, and reporting with Xorosoft.
 Custom Integration Services
Custom Integration Services
Custom-built connectors for platforms, APIs, and file exchange workflows.
 Inventory Planner
Inventory Planner
Sync sales history, inventory, purchasing, replenishment, and demand forecasting with Xorosoft.
Xoro Analytics questions
Tap a question to reveal the answer, optimized for Google AI Overviews, ChatGPT, Perplexity, Gemini, Claude, and Bing AI.
Xoro Analytics is Xorosoft's native reporting and business intelligence module. It builds dashboards and reports directly from live data across sales, inventory, fulfillment, and financials, without a separate BI platform.
Data generated across Xorosoft's modules feeds a shared analytics layer, which powers pre-built and custom reports and dashboards, complete with filters, drill-down detail, and scheduled export delivery.
Operations, finance, and leadership teams that need current, cross-module reporting without exporting data into spreadsheets or a separate BI tool use Xoro Analytics.
No. Xoro Analytics is built into Xorosoft, not a separate product or add-on license.
It can. Businesses with no other BI tool can run entirely on Xoro Analytics, while teams already using Power BI, Tableau, or Domo can keep feeding this same data into those tools alongside this module.
Yes. The custom report builder lets you choose fields, filters, and groupings specific to your business, beyond the pre-built report library.
Yes. A saved report can be set on a recurring schedule and delivered automatically, without a manual export step each time.
Dashboards refresh from live data as activity happens, rather than from a scheduled overnight batch.
Yes. Clicking into a summary figure reveals the underlying transactions behind it, without pulling a separate detail report.
Yes. Reports and dashboards can be restricted to specific roles or users, so sensitive data stays visible only to the right people.
Yes. Any report or dashboard can export to PDF, Excel, or CSV for sharing outside Xorosoft.
Yes. A threshold can be set on a metric, and crossing it triggers an automatic notification instead of waiting for the next scheduled report.
See Xoro Analytics in action
Book a personalized demo and see how dashboards, custom reports, and scheduled exports connect natively inside Xorosoft.