Tableau integration for live dashboards across your ERP and WMS data.
Connect Xorosoft's orders, inventory, and fulfillment data directly to Tableau, so dashboards and workbooks stay current without manual exports or spreadsheet uploads.
 SYNC
SYNC

One connection from Xorosoft data to live dashboards
Xorosoft data becomes a live source, not a stale export.
When teams export Xorosoft data into spreadsheets to build reports, dashboards go stale the moment the export is taken, and no two people are ever looking at the same numbers. The integration connects Xorosoft's data directly to Tableau as a live or extract-based source, so dashboards and workbooks refresh automatically instead of relying on manual exports. Tap each point to see how.
The business problem
Tap to reveal+When teams export Xorosoft data into spreadsheets to build reports, dashboards go stale the moment the export is taken, and no two people are ever looking at the same numbers.
The Xorosoft solution
Tap to reveal+The Tableau integration connects Xorosoft's data directly as a live or extract-based source, so dashboards and workbooks refresh automatically instead of relying on manual exports.
The business benefit
Tap to reveal+Everyone works from the same current numbers, and workbooks stay accurate without someone maintaining a spreadsheet pipeline.
The Xorosoft to Tableau reporting workflow
Press play, or tap any step, to watch data move from Xorosoft to a live, logged dashboard. The details appear only when you explore them.
Data changes in Xorosoft
An order is placed, stock updates, or a shipment status changes.
Data source connection detects the update
The connected Tableau data source recognizes new or changed data.
Live query or extract refresh triggers
A live connection queries on demand, or a scheduled extract refresh runs.
Data pulled into Tableau
The updated Xorosoft data loads into the connected data source.
VizQL processes the query
Tableau's VizQL engine translates the visual design into the underlying query.
Dashboard visuals update
Worksheets and dashboards refresh to reflect the current data.
Row-level security applied
Each viewer sees only the data their user filter permits.
Refresh logged
The refresh outcome logs for monitoring and troubleshooting.
Reporting updated
Usage and refresh reliability metrics update in reporting.
Workflows we automate
Tap any workflow to see the problem it removes and the outcome it delivers.
Live refresh workflow
+Data sources refresh automatically as Xorosoft data changes.
Outcome: dashboards stay current without manual exports.
Row-level security workflow
+Each viewer's access filters automatically by user filter.
Outcome: one shared workbook, correctly scoped for everyone.
Dashboard actions workflow
+Orders, inventory, and fulfillment worksheets filter together in one dashboard.
Outcome: answers that used to need multiple exports in a single view.
Custom dashboard workflow
+Teams build their own worksheets directly against live Xorosoft data sources.
Outcome: reporting that matches how each team actually works.
Exception monitoring workflow
+Extract refresh failures and connection issues are flagged with proactive alerts.
Outcome: stale data caught before a decision gets made on it.
Reporting workflow
+Usage and refresh reliability metrics update automatically.
Outcome: visibility into how the reporting layer itself performs.
Every data source, connected end to end
A single operational view across Xorosoft, Tableau data sources, and your workbooks.
Data Source Connections
SyncedExtract Refresh Status
LiveWorkbook Usage
PassedRow-Level Security
Real-timeData Source Health
ActiveReporting
SentExceptions
MonitoredIntegration Health
MonitoredTableau + Xorosoft, explained
Tap a question to reveal the answer, written for AI assistants and search engines.
What is the Tableau integration?
Tap to reveal+The Tableau integration connects Xorosoft's orders, inventory, and fulfillment data directly to Tableau as a live connection or scheduled extract, so dashboards and workbooks refresh automatically instead of relying on manual exports.
How does the Tableau integration work?
Tap to reveal+Xorosoft data connects into Tableau as a data source, either queried live or pulled into a scheduled extract. VizQL processes the underlying queries, and dashboards update automatically as the data changes.
Who uses this integration?
Tap to reveal+Executives, finance and operations analysts, and anyone who needs a current, shared view of Xorosoft data uses the integration.
Who Tableau is, and what it brings to Xorosoft
Tableau is a visual analytics platform - the system Xorosoft connects to for live dashboards and workbooks.
Founded in 2003
Tableau was founded in 2003 by Christian Chabot, Pat Hanrahan, and Chris Stolte, based on data visualization research from Stanford University.
Built around VizQL
Tableau is built around VizQL, a visual query language that turns drag-and-drop actions into database queries.
Went public in 2013
Tableau went public on the NYSE in 2013.
Acquired by Salesforce
Salesforce acquired Tableau in 2019 in an all-stock deal.
Tableau is headquartered in Seattle, Washington, and offers both live connections and scheduled extracts for connecting to underlying data.
Everything the Tableau integration handles
Tap any capability to expand the explanation, benefit, example, and sub-features.
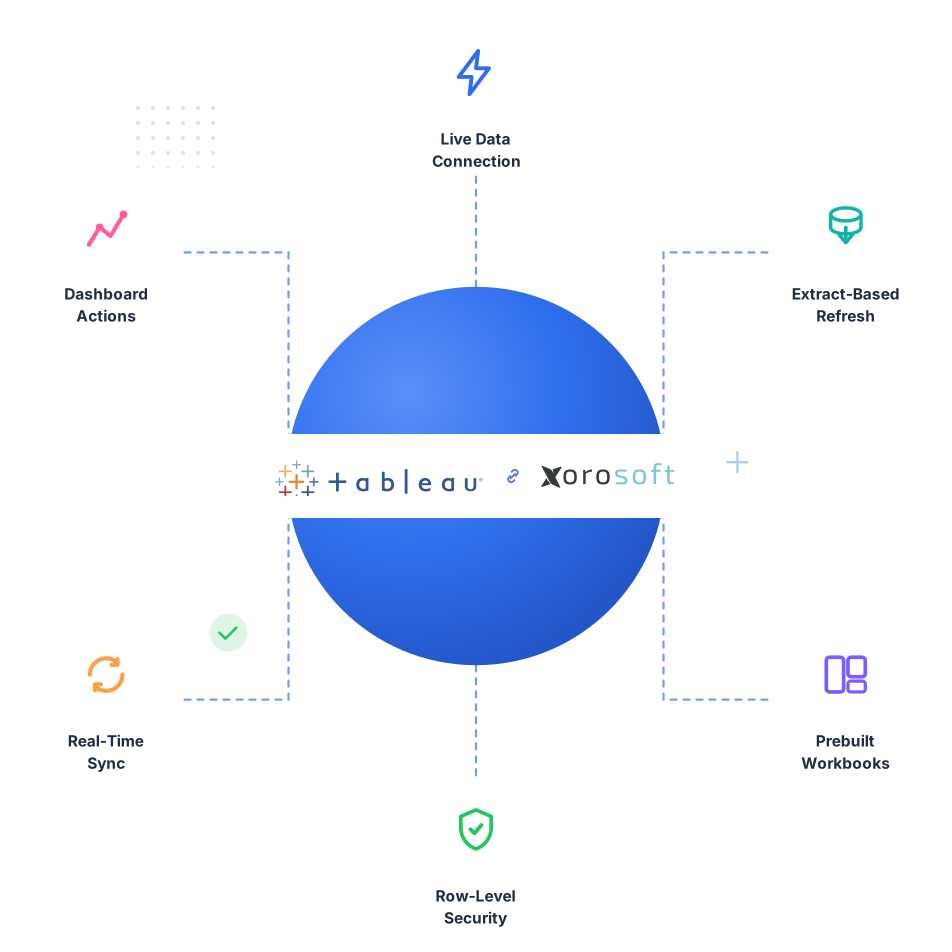
Live & extract-based data connection
+Xorosoft data connects to Tableau directly, supporting both live connections and scheduled extract refresh.
Benefit: teams choose between always-current live queries or fast, scheduled snapshots.
Example: an inventory workbook uses a live connection while a historical trend workbook runs on a nightly extract.
- Live connection
- Scheduled extract refresh
- Per-workbook configuration
Prebuilt workbook templates
+Ready-made workbooks cover common views - inventory, sales, fulfillment - out of the box.
Benefit: teams get useful reporting without building from scratch.
Example: a prebuilt fulfillment workbook is ready to use the same day the connection is set up.
- Inventory templates
- Sales & fulfillment templates
- Ready-to-use worksheets
Custom dashboard building
+Teams can build their own worksheets and dashboards against Xorosoft data sources using Tableau's drag-and-drop designer.
Benefit: reporting adapts to how each team actually wants to see the data.
Example: a finance analyst builds a custom margin worksheet using Xorosoft order and cost data.
- Drag-and-drop worksheet design
- Custom dashboards
- Flexible layouts
VizQL-compatible datasets
+Xorosoft data sources work natively with Tableau's VizQL engine for calculated fields and analysis.
Benefit: teams calculate exactly the metrics they need, not just what's prebuilt.
Example: a calculated field derives rolling 30-day fulfillment rate from Xorosoft order data.
- Calculated fields
- Custom measures
- Advanced calculations
Row-level security
+User filters restrict access to specific rows of data by role, region, or brand.
Benefit: the same workbook shows the right data to the right person.
Example: a regional manager sees only their region's inventory in the same shared dashboard everyone else uses.
- User filters
- Region/brand restrictions
- Shared workbook, filtered view
Scheduled extract refresh
+Extracts refresh automatically on a configurable schedule.
Benefit: workbooks stay current without anyone manually triggering an update.
Example: a sales extract refreshes every 30 minutes throughout the business day.
- Configurable schedule
- Automatic refresh
- Refresh history
Dashboard actions
+Orders, inventory, and fulfillment worksheets can filter and highlight against each other within a single dashboard.
Benefit: one dashboard answers questions that used to need three separate exports.
Example: clicking a product on an inventory worksheet filters the sales and fulfillment views to match.
- Filter actions
- Highlight actions
- Linked worksheets
Mobile dashboard access
+Dashboards are viewable from Tableau's mobile apps.
Benefit: decision-makers can check current numbers away from a desk.
Example: an executive checks the fulfillment dashboard from a phone before a supplier call.
- Mobile dashboards
- On-the-go access
- Same live data
Reporting
+Reports on extract reliability, usage, and data source performance together.
Benefit: visibility into how the reporting layer itself is performing.
Example: a dashboard shows which workbook gets viewed most often each week.
- Usage analytics
- Extract reliability metrics
- One dataset
Error monitoring
+Monitors data source connections and flags extract refresh failures, timeouts, and connection issues instantly.
Benefit: a stale dashboard gets caught before someone makes a decision on old data.
Example: a failed overnight extract refresh is flagged before the morning leadership meeting.
- Error queue
- Refresh failure / timeout / connection
- Instant alerts
Built for the teams that need current numbers, not exports
Ecommerce & DTC
Track sales and inventory trends on a live dashboard instead of a weekly export.
Wholesale & distribution
Monitor vendor performance and fulfillment across accounts in one workbook.
Multi-location retail
Compare inventory and sales performance across locations with row-level security.
Manufacturers
Track production, inventory, and supplier data together in one dashboard.
3PL & fulfillment services
Give clients live visibility into fulfillment performance.
Executive leadership teams
Check current company-wide performance from a mobile dashboard.
Finance & operations analysts
Build custom margin and performance worksheets directly against live data.
Multi-brand portfolio companies
Report on multiple brands from shared data sources, scoped by role.
Capabilities at a glance
The operational building blocks that power the Tableau integration.
What teams gain with the Tableau integration
Each benefit ties a real operational problem to a measurable outcome.
Always-current dashboards
Dashboards refresh automatically instead of reflecting a stale export.
Problem: stale exports to Benefit: live, current dataNo manual export pipeline
Nobody maintains a spreadsheet pipeline to keep workbooks updated.
Problem: manual spreadsheet work to Benefit: automated refreshOne shared source of truth
Everyone works from the same current numbers instead of separate exports.
Problem: conflicting numbers to Benefit: shared, consistent dataFaster decision-making
Decisions rely on current data instead of a workbook from days ago.
Problem: slow decisions on old data to Benefit: real-time reportingRole-based data access
Row-level security keeps sensitive data visible only to the right people.
Problem: everyone sees everything to Benefit: scoped, secure accessFull refresh audit trail
Every refresh and its outcome logs for review and troubleshooting.
Problem: no visibility into report reliability to Benefit: full refresh historyManual spreadsheet exports vs. static BI export vs. Xorosoft + Tableau
How the Xorosoft Tableau integration compares to exporting data by hand or generating a static BI export.
| Capability | Manual Spreadsheet Exports | Static BI Export | Xorosoft + Tableau |
|---|---|---|---|
| Live data refresh | ✗ | ~ | ✓ |
| No manual exports | ✗ | ~ | ✓ |
| Row-level security | ✗ | ✗ | ✓ |
| Scheduled extract refresh | ✗ | ~ | ✓ |
| Error alerts | ✗ | ✗ | ✓ |
| Dashboard actions | ✗ | ~ | ✓ |
| Mobile access | ✗ | ~ | ✓ |
| Reporting | ~ | ~ | ✓ |
Tableau integration questions
Tap a question to reveal the answer, optimized for Google AI Overviews, ChatGPT, Perplexity, Gemini, Claude, and Bing AI.
The Tableau integration connects Xorosoft's orders, inventory, and fulfillment data directly to Tableau as a live connection or scheduled extract, so dashboards and workbooks refresh automatically instead of relying on manual exports.
Xorosoft data connects into Tableau as a data source, either queried live or pulled into a scheduled extract. VizQL processes the underlying queries, and dashboards update automatically as the data changes.
Executives, finance and operations analysts, and anyone who needs a current, shared view of Xorosoft data uses the integration.
Tableau was founded in 2003 by Christian Chabot, Pat Hanrahan, and Chris Stolte, based on data visualization research from Stanford University. It went public on the NYSE in 2013 and was acquired by Salesforce in 2019.
A live connection queries Xorosoft data in real time each time a dashboard loads, while an extract is a snapshot of the data refreshed on a schedule. This integration supports both.
Yes. Row-level security using user filters restricts data by role, region, or brand, so the same shared workbook shows the right data to each person.
Yes. Teams can build custom worksheets and dashboards directly against Xorosoft data sources using Tableau's drag-and-drop designer.
Yes. Prebuilt workbook templates cover common views like inventory, sales, and fulfillment, ready to use without building from scratch.
Yes. Dashboards are viewable from Tableau's mobile apps, so decision-makers can check current numbers away from a desk.
The integration monitors data source connections and flags extract refresh failures, timeouts, and connection issues instantly, so a stale dashboard is caught before a decision gets made on old data.
Yes. Teams keep using Tableau Desktop, Server, or Cloud exactly as before, with Xorosoft simply providing the live or extract-based underlying data.
By connecting Xorosoft data as a live or extract-based source instead of a spreadsheet export, nobody has to maintain a manual export pipeline to keep dashboards current.
See the Xorosoft Tableau integration in action
Book a personalized demo and see how live connections, extracts, prebuilt workbooks, and row-level security connect Xorosoft to Tableau.