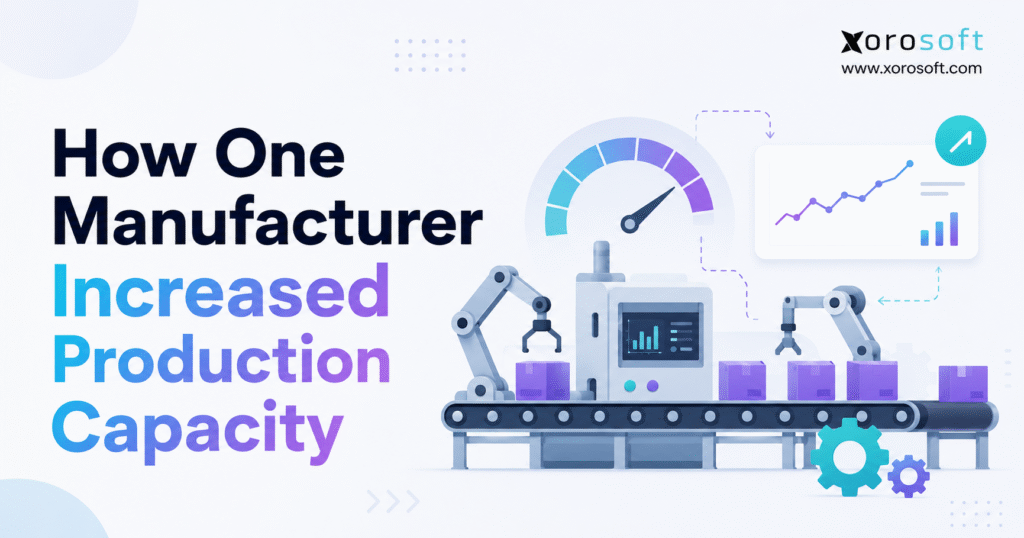
If you’re looking to increase production capacity, it’s essential to focus on efficient strategies and resources that will help scale your business successfully. Stay tuned as we explore how to maximise output and optimise your workflow, turning potential into greater results for your company.
1. Rising Demand Exposed Hidden Production Constraints
The manufacturer appeared to have a positive business problem. Customer demand was increasing, wholesale accounts were placing larger orders, and direct-to-consumer sales were adding a steady stream of smaller transactions. However, the production operation was struggling to keep pace.
Orders moved through the plant inconsistently. Some batches finished on schedule, while others waited between work centers for several days. Meanwhile, supervisors changed priorities throughout the week because material shortages, equipment issues, and urgent customer requests repeatedly disrupted the production plan.
Purchasing employees spent more time expediting components. Warehouse teams searched for materials that inventory records showed as available. Production employees waited for instructions, tools, or approvals. In addition, overtime continued to rise even though weekly output remained unpredictable.
Management initially believed the company needed another machine, more employees, or additional floor space. Nevertheless, a closer review showed that several machines still had available hours. Some departments regularly waited for work, while one constrained operation controlled the pace of the entire system.
Therefore, the company did not begin with a capital purchase. Instead, it measured practical capacity, mapped the production flow, identified the bottleneck, and examined the conditions that repeatedly interrupted productive work.
The manufacturer eventually increased weekly finished output from an illustrative 1,000 units to 1,250 units. More importantly, it achieved that improvement without immediately expanding the plant.
The company was able to increase production capacity because it improved material readiness, protected bottleneck time, reduced changeovers, created a more realistic schedule, and connected production activity with inventory and purchasing information.
This case illustrates an important operating principle: manufacturers should improve flow before assuming that growth requires more physical resources.[/vc_column_text]
2. What Production Capacity Means in a Real Factory
Production capacity is the maximum practical quantity of acceptable finished goods a manufacturer can complete during a defined period using its available equipment, labor, materials, facilities, and working hours.
The word “practical” is essential. Equipment specifications usually describe ideal output. However, an actual factory must also account for cleaning, breaks, maintenance, changeovers, quality inspections, operator availability, product complexity, and normal operating variability.
As a result, machine ratings alone should not determine production schedules or customer delivery promises.
2.1 Design Capacity, Practical Capacity, and Actual Output
Design capacity represents the theoretical maximum under ideal conditions. It normally assumes continuous equipment availability, complete material supply, consistent labor performance, and no quality issues.
Practical capacity is more realistic. It adjusts the theoretical maximum for expected maintenance, changeovers, breaks, cleaning, product mix, and other predictable losses.
Actual output is the acceptable finished quantity the plant completes.
For example, a factory may have a design capacity of 2,000 units per week and a practical capacity of 1,600 units. However, it may complete only 1,000 units.
Therefore, the first improvement opportunity is not necessarily another 2,000-unit machine. Instead, management should understand why 600 units of existing practical capacity remain unused.
2.2 Production Capacity Versus Throughput
Capacity measures how much the operation could produce. Throughput measures how much acceptable finished output it actually completes.
A department may improve its individual output without increasing company-wide throughput. For instance, an upstream work center may produce 400 components per day. However, when the next operation can process only 250, the additional 150 components become work-in-progress inventory.
Consequently, local productivity can rise while customer-ready output remains unchanged.
2.3 Productivity Versus Capacity Utilization
Productivity compares output with an input such as labor hours, machine time, or material cost. Capacity utilization compares actual output with practical available capacity.
Both measures matter. Nevertheless, neither should be reviewed without understanding the production constraint.
A factory-wide utilization rate may appear moderate even when one required work center is operating at its limit. Therefore, managers should examine utilization at the plant, department, and work-center levels.
2.4 How Manufacturers Increase Production Capacity
Manufacturers generally increase production capacity in one of two ways.
First, they can recover capacity that already exists but is being lost through waiting, downtime, quality problems, shortages, or poor scheduling. Second, they can add new capacity through equipment, automation, labor, shifts, outsourcing, or facility expansion.
Because physical expansion is expensive, the first question should be whether the existing system can produce more reliably.
3. Measuring the Baseline Before Changing the Operation
The company established a factual starting point before changing schedules, processes, or systems. Otherwise, it would have been difficult to prove whether the project created a sustainable improvement.
A temporary output increase can result from overtime, deferred maintenance, an easier product mix, or a short-term production push. Therefore, output alone was not enough.
3.1 Calculating Available Production Time
The team documented the scheduled hours for every major work center. Next, it deducted planned breaks, cleaning, preventive maintenance, training, normal changeovers, and other routine interruptions.
For example, a work center scheduled for 80 hours per week might provide only 67 hours of practical processing time.
Previously, the production spreadsheet scheduled work against all 80 hours. Consequently, the work center was overloaded before the week began.
3.2 Measuring Actual Cycle Times
Supervisors compared routing standards with observed cycle times. Several system standards had not been updated after product, packaging, and process changes.
Even a small timing error can distort the schedule. If a product is planned at four minutes per unit but actually requires five, a 1,000-unit order needs 1,000 additional production minutes.
Therefore, accurate cycle times became a basic requirement for reliable capacity planning.
3.3 Production Capacity Formula
A basic production capacity formula is:
Production Capacity = Available Production Time ÷ Standard Cycle Time
Suppose a work center has 4,000 practical minutes available each week and requires four minutes per acceptable unit. Its estimated weekly capacity is 1,000 units.
However, manufacturers should apply this formula by work center. In a multi-stage process, the slowest required operation normally governs the output of the complete line.
3.4 Capacity Utilization Formula
Capacity utilization can be calculated as:
Capacity Utilization = Actual Output ÷ Practical Capacity × 100
In the illustrative scenario:
1,000 actual units ÷ 1,600 practical units × 100 = 62.5%
Although the overall result was 62.5%, the bottleneck operated close to its limit. Meanwhile, other departments had spare time.
Therefore, a plant-wide average would not have revealed the true production problem.
3.5 Manufacturing Metrics Used for the Baseline
The company measured:
• Weekly finished output
• Practical capacity
• Capacity utilization
• Production lead time
• Schedule attainment
• Work-center cycle time
• Unplanned downtime
• Setup and changeover time
• Work-in-progress inventory
• Scrap and rework
• Material-shortage events
• Overtime hours
• On-time production completion
Together, these measures connected final business results with the operational causes behind them.
4. The Production Bottlenecks Restricting Manufacturing Output
The review showed that the manufacturer did not have one isolated problem. Instead, several weaknesses reinforced one another and repeatedly removed productive time from the constrained operation.
4.1 An Overloaded Finishing Work Center
A finishing process was required for nearly every major product family. Consequently, work regularly accumulated before that work center.
Upstream departments continued producing because their managers wanted to maintain high utilization. However, the additional work could not move through finishing quickly enough.
As a result, the factory created more WIP without creating more shipments.
4.2 Material Shortages at the Point of Production
Some work orders were released before every critical component was available.
Employees would begin a batch, consume the available materials, and then stop. Meanwhile, purchasing searched for the missing component, and production moved to another order.
These partial starts consumed labor, created additional handling, and increased changeover requirements. Nevertheless, they did not produce customer-ready goods.
4.3 Inventory Records That Could Not Support Planning
The production schedule showed material as available even when it had been allocated, damaged, transferred, consumed, or stored in an unexpected location.
In other situations, physical stock existed but warehouse employees could not locate it quickly.
Therefore, the production plan often depended on inventory quantities that were technically present but operationally unavailable.
4.4 Spreadsheet-Based Production Scheduling
The master schedule operated separately from sales orders, inventory, purchasing, BOMs, and work orders.
Whenever demand changed, planners manually updated the spreadsheet. Likewise, machine downtime, supplier delays, labor absences, and quality problems required further revisions.
As a result, the schedule was frequently outdated before production began.
4.5 Excessive Setup and Changeover Time
The constrained work center processed several product families. However, operators often prepared tools, materials, instructions, and machine settings after the previous job had stopped.
In addition, urgent orders frequently interrupted compatible production sequences.
Consequently, the bottleneck lost capacity through avoidable internal changeover work.
4.6 Incomplete Work-Order Information
Some work orders contained outdated instructions, incomplete revision details, or unclear material requirements.
Although each interruption appeared minor, the delays occurred at the resource controlling total output. Therefore, several five- or ten-minute interruptions could remove meaningful weekly capacity.
4.7 Delayed Purchasing Decisions
Purchasing relied on separate production spreadsheets, inventory reports, supplier files, and sales forecasts.
Because future requirements were difficult to consolidate, buyers often reacted to immediate shortages rather than preventing them.
Consequently, the company paid expedite fees while the production floor continued waiting for materials.
5. Bottleneck Analysis Revealed the Real Capacity Problem
The manufacturer mapped the complete operating flow from demand through purchasing, receiving, inventory, production, quality, warehousing, and shipment.
Instead of reviewing each department independently, the team followed a representative product through the entire business.
5.1 Mapping Material and Information Flow
For each production stage, the team recorded:
• Active processing time
• Queue time
• Transfer time
• Inspection time
• Changeover time
• Approval delays
• Information handoffs
• Work-in-progress inventory
• Rework loops
The product required only several hours of active processing. However, it spent several days waiting between activities.
Therefore, production lead time was driven more by queues and missing information than by machine speed.
5.2 Visible Signs of the Manufacturing Bottleneck
The constrained work center produced several warning signs:
• WIP repeatedly accumulated before it.
• Overtime concentrated in the same area.
• Downstream teams waited for its output.
• Maintenance events immediately affected shipments.
• Supervisors repeatedly changed priorities around it.
• The weekly schedule could not recover lost time.
Because the same patterns appeared consistently, the company could separate the system constraint from temporary production noise.
5.3 Separating Symptoms From Root Causes
Late orders were a symptom. Overtime was another symptom. Likewise, excess WIP and constant schedule changes reflected deeper problems.
The team repeatedly asked why each delay occurred.
Why was the customer order late? The finishing operation did not complete it on time.
Why did finishing fall behind? It lost productive hours.
Why were productive hours lost? Materials, tools, instructions, and approvals were not always ready.
Why were they not ready? Production planning, inventory, purchasing, and work-order information were disconnected.
Therefore, the company needed to improve both the constrained process and the conditions surrounding it.
6. A Seven-Phase Plan to Increase Production Capacity
The manufacturer used a phased improvement plan. This approach allowed process ownership, data quality, production discipline, and technology to improve together.
6.1 Phase One: Stabilize Manufacturing Data
The team reviewed item records, BOMs, routings, cycle times, supplier lead times, units of measure, inventory locations, and work-center calendars.
Incorrect master data would have produced inaccurate material and capacity plans. Therefore, data cleanup was treated as an operational project rather than an administrative exercise.
6.2 Phase Two: Protect the Production Bottleneck
Before each scheduled job, the team confirmed:
• Complete materials
• Correct tools
• Current instructions
• Available operators
• Quality requirements
• Maintenance status
• Packaging requirements
As a result, the constrained work center spent more time processing and less time waiting.
6.3 Phase Three: Improve Material Readiness
Orders missing critical components were not released without a controlled exception.
Meanwhile, warehouse teams staged materials in advance, and purchasing reviewed upcoming shortages against the production schedule.
6.4 Phase Four: Rebuild the Production Schedule
The bottleneck was scheduled first. Next, upstream and downstream work was aligned with that sequence.
Compatible product families were grouped whenever customer commitments allowed. Consequently, the manufacturer reduced avoidable changeovers.
6.5 Phase Five: Standardize Work-Order Execution
Supervisors defined production statuses, material-consumption procedures, completion steps, quality holds, scrap reporting, downtime codes, and exception processes.
Therefore, routine production no longer depended as heavily on verbal instructions.
6.6 Phase Six: Connect Operational Information
The company connected customer demand, inventory availability, purchasing requirements, work orders, material movement, production completion, warehouse activity, and financial reporting.
As a result, teams spent less time reconciling separate records.
6.7 Phase Seven: Establish Capacity Reviews
Management introduced a weekly capacity meeting focused on:
• Demand changes
• Available work-center hours
• Bottleneck load
• Material shortages
• Maintenance plans
• Labor availability
• Customer delivery risk
Previously, teams used meetings to compare spreadsheets. Afterward, they used the time to make operational decisions.
7. Better Production Scheduling Released Existing Capacity
The old schedule assumed that resources had unlimited availability. Therefore, planners assigned more work to the week than the bottleneck could complete.
The revised schedule used practical available hours.
7.1 Scheduling Material-Ready Work
A customer request received a firm production slot only after planners confirmed critical materials, labor, tools, and instructions.
Consequently, fewer orders stopped after production had started.
7.2 Scheduling the Constraint First
The bottleneck received the most carefully controlled sequence. Upstream operations supported that plan, while downstream resources prepared to receive completed output.
As a result, the manufacturer reduced waiting before and after the constrained process.
7.3 Controlling Expedites and Schedule Changes
Not every urgent request entered the active schedule immediately.
Instead, sales and operations reviewed the customer impact, material availability, changeover requirements, and existing commitments before changing priorities.
Therefore, the production team spent more time executing work and less time reacting to avoidable disruptions.
7.4 Using Demand to Guide Production Capacity Planning
Confirmed orders, forecasts, customer priorities, inventory policy, supplier lead times, and product mix shaped the production plan.
The goal was not to keep every machine busy. Rather, it was to use available capacity for the products customers actually needed.
7.5 How Scheduling Helped Increase Production Capacity
The manufacturer did not add hours to the week. However, it converted more scheduled hours into productive processing time.
Therefore, better scheduling helped increase production capacity by reducing unfinishable orders, unnecessary changeovers, priority conflicts, and bottleneck waiting.
8. Inventory Accuracy Improved Production Capacity Planning
A manufacturer cannot maintain reliable production capacity when materials are unavailable at the required location and time.
8.1 Connecting BOM Requirements With Available Inventory
The team compared work-order requirements with:
• On-hand quantity
• Allocated quantity
• Incoming quantity
• Damaged stock
• Safety stock
• Usable available quantity
This distinction prevented planners from treating every physical unit as available for new work.
8.2 Identifying Material Shortages Earlier
Purchasing reviewed shortages before the planned production date.
Therefore, buyers had more options. They could expedite the supplier, adjust the schedule, approve a substitute, split the batch, or communicate a realistic customer date.
8.3 Coordinating Warehouse Staging With Production
Warehouse employees staged critical components before the scheduled start.
For manufacturers managing complex receiving, picking, staging, transfers, and multiple locations, a connected warehouse management system can support material visibility and movement.
8.4 Reducing Partial Production Starts
Unless a planner approved an exception, a work order could not begin without a critical component.
Initially, this rule appeared restrictive. However, it increased completed output because it reduced stalled batches occupying space, labor, and management attention.
8.5 Inventory Accuracy as a Capacity Improvement Tool
Inventory accuracy is often treated as a warehouse metric. Nevertheless, it directly affects manufacturing output.
When materials can be located, allocated, and staged reliably, production employees spend less time waiting. Therefore, inventory accuracy helped the company increase production capacity without adding another machine.
9. Work-Order Control Reduced Production Delays
A schedule explains what should be produced and when. A work order provides the operational record needed to execute and track that work.
9.1 Creating One Source for Production Instructions
Each work order included:
• Item and quantity
• Current BOM
• Process or routing
• Material requirements
• Instructions
• Planned dates
• Assigned location
• Production status
• Material consumption
• Completed output
• Scrap and rework
• Completion details
Therefore, operators did not need to collect instructions from several documents.
9.2 Standardizing Production Statuses
The manufacturer defined consistent statuses such as:
• Planned
• Released
• Materials staged
• In progress
• Quality hold
• Completed
• Closed
As a result, sales, purchasing, warehouse, and management teams could understand production progress without requesting manual updates.
9.3 Recording Material Consumption and Output
Employees recorded the actual materials consumed and acceptable units completed.
When actual consumption differed from the BOM, the team investigated the variance. Consequently, inaccurate standards did not continue indefinitely.
9.4 Capturing Scrap and Rework
Scrap and rework were linked to the work order, product, process, and reason.
Therefore, management could distinguish capacity lost through waiting from capacity lost through quality failures.
10. How the Manufacturer Increased Production Capacity Without Expansion
The company increased output through several connected improvements rather than one dramatic intervention.
10.1 Reduced Waiting at the Bottleneck
Materials, tools, instructions, and operators were prepared before the constrained work center became available.
As a result, productive processing time increased.
10.2 Shortened Changeover Time
The team separated internal and external changeover activities.
Whenever possible, operators prepared tools, documents, materials, and settings while the previous production order was still running.
Consequently, the bottleneck spent less time stopped between products.
10.3 Improved Schedule Attainment
Fewer work orders lacked materials or exceeded available hours.
Therefore, actual production followed the weekly plan more consistently.
10.4 Reduced Work-in-Progress Inventory
Upstream departments stopped producing simply to maintain local utilization.
As a result, WIP declined, production queues became easier to manage, and defects were identified earlier.
10.5 Standardized Shop-Floor Execution
Clear instructions, statuses, and ownership made routine production more predictable.
Meanwhile, supervisors retained authority over genuine exceptions.
10.6 Used Existing Resources More Effectively
The manufacturer did not operate every machine at maximum utilization.
Instead, it aligned non-bottleneck resources with customer demand and the constrained process.
10.7 Why the Capacity Gain Was Sustainable
The company was able to increase production capacity because several supporting indicators improved at the same time.
Output increased, while lead time, WIP, overtime, changeovers, and schedule disruption declined.
Therefore, the improvement reflected a healthier operating system rather than a temporary production push.
11. Illustrative Production Capacity Results
The following figures demonstrate how an approved customer case study could present the result. They are illustrative and should not be described as verified customer outcomes.
| Metric | Before | After | Illustrative change |
|---|---|---|---|
| Weekly completed output | 1,000 units | 1,250 units | 25% increase |
| Practical weekly capacity | 1,600 units | 1,600 units | No facility expansion |
| Capacity utilization | 62.5% | 78.1% | 15.6 percentage points |
| Production lead time | 12 days | 8 days | 33% reduction |
| Schedule attainment | 68% | 89% | 21 percentage points |
| Average changeover | 70 minutes | 45 minutes | 36% reduction |
| Work-in-progress | 2,100 units | 1,500 units | 29% reduction |
| Monthly overtime | 220 hours | 130 hours | 41% reduction |
Output alone would not prove a sustainable capacity improvement. For example, a business could temporarily increase production by adding overtime or delaying maintenance.
However, the illustrative results also show improvements in lead time, schedule attainment, changeovers, WIP, and overtime.
Therefore, the increased output came from better operational control rather than additional production pressure.
12. Before-and-After Manufacturing Operations
| Operating area | Before improvement | After improvement |
| Production scheduling | Manually updated spreadsheet | Capacity-based operating plan |
| Material planning | Shortages found during picking | Shortages reviewed before release |
| Inventory visibility | Separate records and adjustments | Shared transaction-based view |
| Bottleneck management | Expedites and overtime | Explicitly scheduled and protected |
| Work-order control | Inconsistent statuses | Standard lifecycle and records |
| Changeovers | Preparation after machine stop | Advance preparation where possible |
| Warehouse support | Reactive material searches | Planned production staging |
| Purchasing | Responded to urgent shortages | Reviewed forward requirements |
| Reporting | Compiled after production | Updated through routine transactions |
| Capacity decisions | Based on urgency | Based on load, demand, and readiness |
The largest capacity gain did not come from one department. Instead, it came from better coordination among production, purchasing, inventory, warehousing, quality, sales, and finance.
13. Manufacturing Metrics That Made Capacity Visible
13.1 Throughput and Completed Output
Throughput measures acceptable finished output rather than work released or partially processed.
Therefore, the company measured completed units instead of department-level activity.
13.2 Capacity Utilization by Work Center
Plant-wide utilization can hide an overloaded bottleneck.
Consequently, the manufacturer compared required and available hours for each critical work center.
13.3 Overall Equipment Effectiveness
OEE combines equipment availability, performance, and quality.
It can explain whether production is lost through downtime, slow operation, or defects. However, a high OEE score at a non-bottleneck does not automatically increase customer shipments.
13.4 Production Lead Time
Production lead time includes both processing and waiting.
In many factories, the product spends more time waiting than being processed. Therefore, manufacturers can reduce lead time significantly without changing machine cycle speeds.
13.5 Schedule Attainment
Schedule attainment measures whether the plant completes the work planned for a period.
Low performance may indicate unrealistic scheduling, material shortages, equipment downtime, unstable priorities, or execution problems.
13.6 Changeover Time
Changeover time is particularly important at the bottleneck.
Every avoidable minute at the constrained resource can reduce total system output.
13.7 Work-in-Progress Inventory
Excess WIP consumes floor space, extends lead time, complicates priorities, and hides quality issues.
Moreover, it often indicates that upstream processes are producing faster than the constraint can process.
14. What the Manufacturer Deliberately Avoided
14.1 It Did Not Immediately Purchase More Equipment
New equipment can solve a genuine physical constraint. However, it does not correct missing materials, weak schedules, inaccurate data, poor maintenance, or incomplete instructions.
14.2 It Did Not Add Labor Without Diagnosis
Adding employees to an area with spare capacity increases cost without improving throughput.
Therefore, labor was added or reassigned only when the constraint analysis supported the decision.
14.3 It Did Not Maximize Every Department
Local efficiency can conflict with total flow.
Consequently, non-bottleneck resources occasionally waited instead of producing inventory that customers did not need.
14.4 It Did Not Treat Software as the Entire Solution
Technology can improve visibility, planning, and coordination.
Nevertheless, software cannot repair equipment, establish process ownership, train employees, or correct weak operating discipline by itself.
15. When Manufacturers Can Increase Production Capacity Without Expansion
Manufacturers should look for hidden capacity before approving major capital investments. In many cases, they can increase production capacity by recovering productive hours currently lost to material shortages, excessive changeovers, equipment downtime, inaccurate inventory records, incomplete instructions, and repeated schedule changes.
Common opportunities include:
• Long queues before one process
• Frequent material-related stops
• Excessive changeovers
• Unplanned downtime
• Repeated schedule changes
• Inaccurate inventory records
• Incomplete work instructions
• High scrap and rework
• Poor warehouse staging
• Unused machine hours
When the gap between practical capacity and actual output is large, the first investment should often address lost productive time.
For example, a machine may be scheduled for 70 practical hours but process products for only 45 hours. In that case, the company may be able to increase production capacity by recovering part of the missing 25 hours.
However, management must understand why the time is being lost. The cause may be maintenance, materials, labor, quality, scheduling, or information.
Therefore, capacity recovery should begin with evidence rather than assumptions.
16. When Manufacturing Capacity Requires New Resources
Process improvement cannot create unlimited capacity.
Eventually, a manufacturer may require another shift, new equipment, automation, outsourcing, or facility expansion.
Capital investment becomes more defensible when:
• The true bottleneck remains highly utilized after process improvements.
• Demand consistently exceeds practical capacity.
• Reliability improvements cannot recover enough production time.
• The current equipment lacks a required technical capability.
• Safety or regulatory requirements limit the existing process.
• Outsourcing costs exceed the economics of internal production.
• Long-term demand supports the expected return.
The business case should compare several demand scenarios. In addition, it should include labor, maintenance, tooling, financing, utilities, training, floor space, implementation risk, and working capital.
Therefore, the decision should reflect total economics rather than equipment price alone.
17. How Manufacturing ERP Supports Capacity Improvement
Manufacturing ERP can support capacity improvement by connecting the information needed to plan, execute, and measure production.
However, ERP should reinforce a defined operating process rather than automate disconnected practices.
For inventory-driven manufacturers, XoroERP can connect manufacturing with inventory, purchasing, warehouse management, accounting, forecasting, reporting, and customer demand.
17.1 Connecting Demand With Production Capacity Planning
Confirmed orders, forecasts, wholesale commitments, ecommerce demand, and inventory policies determine what the plant should produce.
Therefore, planners need to compare demand with material availability, open purchasing, work orders, and production capacity.
17.2 Connecting BOMs With Inventory Availability
When BOM requirements and inventory remain connected, planners can identify shortages before releasing production.
A broader connected cloud ERP platform can bring inventory, purchasing, manufacturing, accounting, forecasting, and reporting into one operating environment.
17.3 Coordinating Production, Purchasing, and Warehousing
Production delays often begin outside the production department.
For example, supplier delays, slow receiving, misplaced inventory, incomplete transfers, and hidden future requirements can all interrupt the bottleneck.
Therefore, shared operational information helps teams respond earlier.
17.4 Improving Work-Order Visibility
A connected system can provide shared visibility into planned, released, staged, in-progress, completed, and closed production orders.
As a result, teams depend less on separate spreadsheets, emails, and verbal updates.
17.5 Improving Manufacturing Cost Visibility
Manufacturing activity affects material consumption, inventory value, production variances, cost of goods sold, and profitability.
Consequently, connected operational and financial information can reduce manual reconstruction during month-end.
17.6 Supporting Multi-Warehouse Manufacturing
Manufacturers operating several plants, warehouses, stores, or third-party facilities need reliable location-level inventory visibility.
Xorosoft supports inventory-driven businesses across its industry solutions, including manufacturing, apparel, furniture, sporting goods, food, consumer products, and wholesale distribution.
17.7 Using ERP to Increase Production Capacity
ERP does not create production capacity automatically. Nevertheless, it can help manufacturers increase production capacity by reducing information delays, material surprises, duplicate entry, scheduling conflicts, and reporting gaps.
The result still depends on accurate data, defined processes, user adoption, maintenance, training, and management discipline.
18. When Production Spreadsheets Become a Capacity Risk
Spreadsheets remain useful for analysis, temporary plans, and controlled models.
However, they become risky as the primary production system when:
• Several employees maintain different versions.
• Production demand changes several times per day.
• Purchasing cannot see future component requirements.
• Inventory and production records frequently disagree.
• Teams re-enter the same information.
• Work-order status depends on verbal updates.
• Multi-warehouse availability is unclear.
• Management cannot calculate load by work center.
• Accounting performs extensive inventory reconciliation.
• Customer delivery promises depend on manual calculations.
At that stage, the company may evaluate MRP, production scheduling, MES, or ERP.
Businesses comparing larger ERP platforms can also review Xorosoft versus NetSuite when defining requirements, implementation expectations, operational fit, and system scope.
19. Production Capacity Use Cases Across Manufacturing Industries
19.1 Furniture Manufacturing Capacity
Furniture manufacturers coordinate lumber, fabric, foam, hardware, finishing, upholstery, and assembly.
Because the product mix changes frequently, the bottleneck may shift between cutting, finishing, upholstery, and assembly. Therefore, accurate routings and material availability are essential.
19.2 Apparel and Fashion Production Capacity
Apparel businesses manage styles, sizes, colors, fabrics, trims, subcontractors, and seasonal deadlines.
Consequently, manufacturing capacity must remain aligned with material availability, launch dates, and channel demand.
19.3 Food and Beverage Manufacturing Capacity
Food manufacturers must include sanitation, allergen controls, shelf life, lot tracking, yield, quality inspections, and cleaning in capacity calculations.
Therefore, machine speed alone does not represent practical capacity.
19.4 Sporting Goods and Consumer Product Capacity
These manufacturers may combine seasonal demand, wholesale orders, ecommerce transactions, and international suppliers.
As a result, production planning must remain connected with forecasts, inventory allocation, supplier lead times, and customer priorities.
19.5 Automotive and Industrial Component Capacity
Component manufacturers often manage revisions, customer schedules, quality requirements, EDI, subcontracted work, and complex production routings.
Therefore, incomplete production information can become a major capacity constraint.
19.6 Shopify-Connected Manufacturing Operations
Manufacturers selling through Shopify may also serve wholesalers, marketplaces, distributors, and physical stores.
For businesses connecting ecommerce demand with inventory-driven ERP workflows, the Xorosoft ERP app for Shopify provides a relevant integration option.
In addition, connected order and inventory information can help production teams understand which channel requirements should influence the manufacturing schedule.
20. Common Production Capacity Planning Mistakes
20.1 Using Theoretical Capacity for Customer Commitments
Theoretical capacity assumes ideal operating conditions.
Therefore, using it for customer promises creates overloaded schedules and unreliable delivery dates.
20.2 Optimizing Non-Bottleneck Resources
Making a non-constrained process faster may create additional WIP without increasing shipments.
Consequently, improvement efforts should first protect the resource controlling total output.
20.3 Releasing Production Without Materials
A partial production order consumes labor, capacity, floor space, and attention.
However, it does not create a shippable product.
20.4 Ignoring Product Mix
A factory may produce 1,600 units of one product but only 900 units of a more complex mix.
Therefore, capacity assumptions must reflect setups, routings, cycle times, yield, and expected demand mix.
20.5 Adding Equipment Before Studying the Constraint
A new machine in the wrong area increases cost while leaving the real bottleneck unchanged.
Instead, management should confirm where additional capacity will create more finished output.
20.6 Using Inaccurate BOMs and Routings
Incorrect materials, quantities, process steps, or cycle times make planning unreliable.
As a result, the company may schedule work that cannot be completed within the available time.
20.7 Tracking Metrics Without Decisions
Dashboards add little value when there are no thresholds, owners, actions, or review schedules.
Therefore, each KPI should support a specific operating decision.
20.8 Implementing Software Without Process Ownership
ERP, MRP, MES, and scheduling tools require disciplined workflows.
Otherwise, the new software may reproduce the same confusion with faster data entry.
21. A Repeatable Framework to Increase Production Capacity
Manufacturers can use the following eight-step process to improve production capacity systematically.
21.1 Establish the Current Capacity Baseline
Measure practical capacity, completed output, utilization, lead time, downtime, changeovers, schedule attainment, WIP, quality losses, and overtime.
21.2 Map the Complete Production Flow
Follow materials and information from customer demand to final shipment.
In addition, include queues, transfers, approvals, inspections, and rework rather than documenting processing time alone.
21.3 Identify the Primary Constraint
Locate the resource, material, skill, policy, or information dependency controlling total finished output.
21.4 Protect the Production Bottleneck
Prepare materials, labor, tools, instructions, maintenance, and quality support before the constrained resource becomes available.
21.5 Align Materials and Labor With the Schedule
Plan against practical available hours.
Moreover, avoid releasing work that the plant cannot finish because of material or downstream constraints.
21.6 Standardize Production Execution
Define statuses, changeovers, completion procedures, downtime reporting, quality checks, and exception handling.
21.7 Measure the New Capacity Level
Confirm that output, lead time, WIP, schedule attainment, quality, and overtime moved in the expected direction.
21.8 Repeat the Process at the Next Constraint
Once one bottleneck improves, another resource may become the new constraint.
Therefore, efforts to increase production capacity should become an ongoing operating discipline rather than a one-time project.
22. Frequently Asked Questions About Production Capacity
22.1 What is production capacity in manufacturing?
Production capacity is the maximum practical quantity a manufacturer can complete during a defined period using its available equipment, labor, materials, facilities, and operating hours. It should reflect normal losses such as maintenance, cleaning, breaks, changeovers, and quality inspections.
22.2 How is manufacturing production capacity calculated?
A basic calculation divides available production time by standard cycle time. However, manufacturers with several production stages should evaluate every required work center because the slowest operation usually controls total output.
22.3 How can a manufacturer increase production capacity?
A manufacturer can increase production capacity by reducing bottleneck waiting, improving material availability, shortening changeovers, reducing downtime, correcting schedules, standardizing work, improving quality, or adding resources at the true constraint.
22.4 Can capacity increase without new machinery?
Yes. Manufacturers can recover hidden capacity when machines are waiting for materials, labor, instructions, tools, maintenance, or quality approval. Better scheduling and preparation may therefore improve output before capital equipment becomes necessary.
22.5 What is the difference between capacity and throughput?
Capacity is the maximum practical output available during a period. Throughput is the acceptable finished output actually completed during that period.
22.6 What is capacity utilization?
Capacity utilization compares actual output with practical capacity. It is calculated by dividing actual output by practical capacity and multiplying the result by 100.
22.7 What is a manufacturing bottleneck?
A bottleneck is the equipment, labor, material, skill, policy, or information dependency limiting total system output. Improving non-bottleneck resources does not necessarily improve finished production.
22.8 How do manufacturers identify production bottlenecks?
Manufacturers can map the production flow, measure queues, compare required and available hours, review downtime, and identify where WIP, overtime, and waiting repeatedly accumulate.
22.9 How does downtime affect production capacity?
Downtime removes productive time. At a non-bottleneck resource, spare capacity may recover the loss. However, downtime at the primary constraint can directly reduce finished output.
22.10 How does changeover time affect manufacturing capacity?
Changeovers reduce the time available for production. Preparing tools, materials, settings, and instructions in advance can recover capacity, especially when the changeover occurs at the bottleneck.
22.11 How does inventory accuracy affect production?
Inaccurate inventory causes unfinishable work orders, emergency purchasing, schedule disruption, and production waiting. Therefore, inventory accuracy directly supports manufacturing capacity.
22.12 How do material shortages reduce output?
Material shortages create waiting, partial starts, expedites, additional handling, schedule changes, and avoidable changeovers. Consequently, they reduce the time available for completed production.
22.13 How does production scheduling affect capacity?
A realistic production schedule aligns demand with materials, labor, equipment, tooling, and available work-center hours. An unrealistic schedule creates overloads and priority conflicts.
22.14 What is finite capacity scheduling?
Finite capacity scheduling assigns work according to actual available resource time. It prevents planners from loading unlimited work into the same machine, labor group, or period.
22.15 What is capacity requirements planning?
Capacity requirements planning compares the machine and labor hours needed for scheduled production with the hours available at each work center.
22.16 How does forecasting affect production capacity?
Forecasting gives manufacturers more time to adjust purchasing, labor, shifts, outsourcing, inventory, and capital plans before demand arrives.
22.17 Which manufacturing KPIs should be monitored?
Manufacturers should consider throughput, practical capacity, utilization, OEE, lead time, schedule attainment, downtime, changeovers, WIP, scrap, rework, overtime, and on-time completion.
22.18 What is OEE?
Overall equipment effectiveness combines availability, performance, and quality. It explains equipment losses, although it should not replace system-level capacity and throughput analysis.
22.19 How can manufacturers reduce downtime?
Manufacturers can use preventive maintenance, operator care, spare-parts planning, escalation procedures, standard repairs, condition monitoring, and root-cause analysis.
22.20 Can production output increase without adding labor?
Yes. Output may increase when employees spend less time waiting, searching for materials, correcting errors, re-entering data, or responding to schedule changes.
22.21 When should a manufacturer add another shift?
A manufacturer should consider another shift when sustained demand exceeds practical capacity and the incremental output justifies labor, supervision, maintenance, quality, and utility costs.
22.22 When should a manufacturer purchase new equipment?
Equipment becomes more appropriate when the real bottleneck remains constrained after process, maintenance, scheduling, quality, and material improvements.
22.23 How does ERP support production capacity planning?
ERP can connect demand, inventory, purchasing, BOMs, work orders, warehouse activity, costing, and accounting. Therefore, planners can evaluate whether materials and resources support the production plan.
22.24 What is the difference between ERP and MRP?
MRP focuses primarily on production and material requirements. ERP covers a broader environment that may also include sales, purchasing, inventory, warehousing, accounting, ecommerce, and reporting.
22.25 When should manufacturers replace production spreadsheets?
Manufacturers should evaluate alternatives when spreadsheets create version conflicts, duplicate entry, unclear status, unreliable inventory data, or production plans that cannot respond to operational changes.
23. Turning Capacity Gains Into a Repeatable Operating Advantage
The most important lesson from this manufacturing scenario is that production capacity should be managed as one connected operating system.
It is not simply a machine-speed calculation. Likewise, it is not improved by keeping every employee or asset busy.
The manufacturer improved output because it measured practical capacity, followed the complete production flow, identified the governing constraint, protected productive time, improved material readiness, created a realistic schedule, standardized work orders, and connected operational information.
Manufacturers facing similar pressure should begin with four practical actions:
1. Measure practical capacity and actual throughput by work center.
2. Map the flow of materials and information from demand to shipment.
3. Identify and protect the primary production constraint.
4. Build a 90-day improvement plan covering materials, scheduling, execution, and reporting.
When process discipline is the main problem, the first investment may be training, preventive maintenance, layout changes, standard work, or better scheduling.
However, when production, purchasing, inventory, warehousing, ecommerce, and accounting depend on disconnected systems, a connected ERP may become part of the strategy to increase production capacity.
Businesses evaluating that next step can request a personalized ERP readiness assessment or demonstration.
The objective is not to add software for its own sake. Instead, the objective is to create the visibility, coordination, and control required to convert available resources into reliable customer-ready output.
Recent Posts
-
 ERP Landed Cost Module vs Spreadsheet Calculations for Importers
 -
 How to Build an Open-to-Buy Plan for an Omnichannel Brand
 -
 Cold Storage WMS for Food and Beverage Distribution
 -
 ERP Buying Statistics 2026: Evaluation, Implementation, and Adoption Risks
 -
 How a Distributor Reduced B2B Order Exceptions Without Restricting Sales