Understanding how to calculate inventory turnover is essential for effective inventory management and business decision making.
1. Why the Ratio Often Sends the Wrong Business Signal
1.1 What Inventory Turnover Measures
Inventory turnover shows how many times a company sells or consumes the equivalent of its average inventory during a selected reporting period.
A ratio of five does not mean the warehouse emptied and refilled five times. Instead, it means cost of goods sold during the period equaled five times the average value of inventory the company carried.
The ratio helps management understand how efficiently inventory supports revenue. Slow-moving products keep cash tied up in storage, insurance, handling, discounting, and potential write-offs. Faster movement may improve working-capital efficiency, but extreme speed can indicate that the business does not carry enough stock to support demand.
This tension gives the ratio its value. The company must balance the financial cost of holding inventory against the service risk of carrying too little.
1.2 Why Operators and Finance Teams Use It
Finance teams use turnover to evaluate working capital, inventory valuation, and performance trends. Purchasing teams review it when assessing order quantities, supplier terms, and replenishment frequency. Merchandising teams rely on it to identify slow categories, aging collections, and products that may require promotional support.
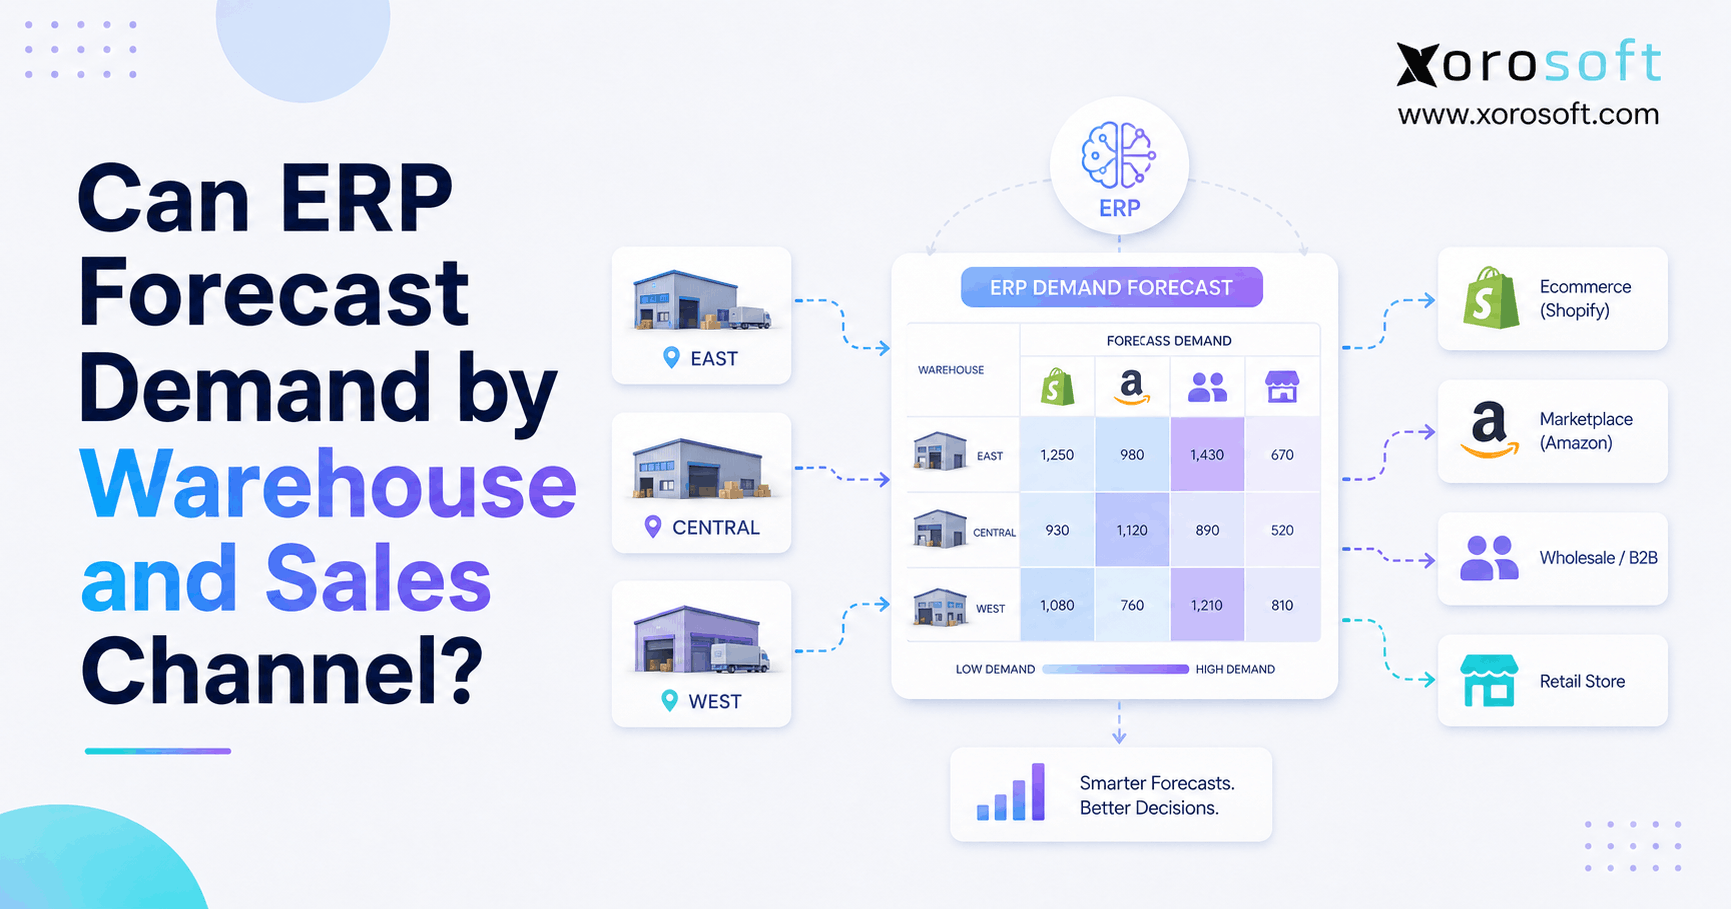
Warehouse leaders also benefit from the metric. A location with weak movement may hold the wrong assortment, receive too much replenishment, or record transfers incorrectly. Ecommerce operators can compare channel demand with stock allocated to Shopify, Amazon, wholesale customers, or third-party fulfillment partners.
No single ratio answers every inventory question. However, a reliable calculation can show management where to investigate next.
1.3 Where Inventory Data Breaks Down
A mathematically correct equation can still produce a misleading result.
Suppose a company divides annual COGS by its December inventory balance. That approach ignores inventory held during the other 11 months, so a seasonal stock build may disappear from the analysis.
Incomplete warehouse records create a similar problem. Unposted receipts, customer returns, damaged products, pending transfers, and inventory in transit can all change the denominator. When the company uses partial data, purchasing teams may reduce orders when they should first correct the records.
Fast-moving products can also hide slow stock. A few bestsellers may support a healthy company-wide ratio while discontinued or obsolete items continue to accumulate. Management should therefore treat turnover as a starting point for investigation rather than a final judgment.
2. Inventory Turnover Formula and Required Financial Inputs
2.1 The Standard Inventory Turnover Formula
The standard inventory turnover formula is:
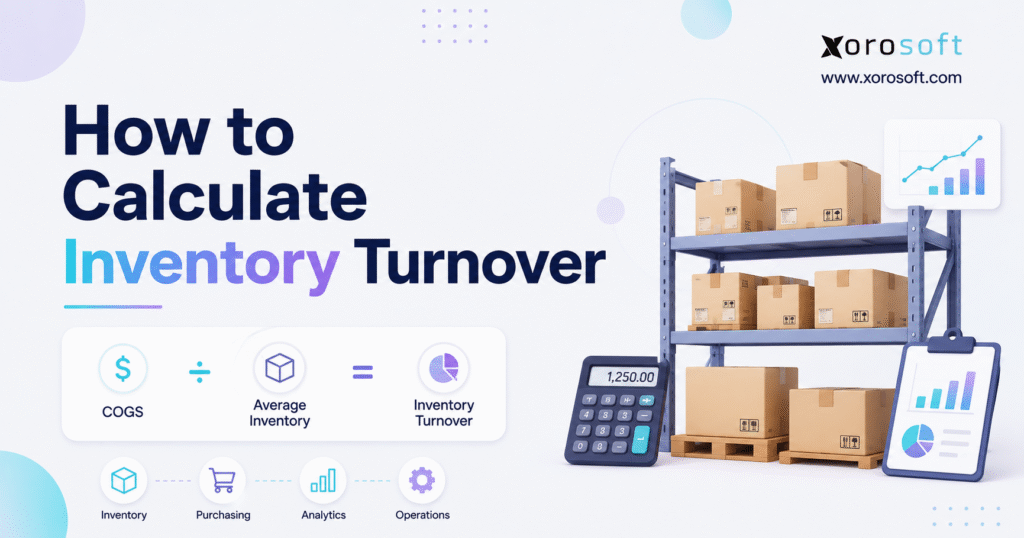
Inventory Turnover Ratio = Cost of Goods Sold ÷ Average Inventory
Assume a company reports annual COGS of $600,000 and average inventory of $120,000.
$600,000 ÷ $120,000 = 5
The company generated cost of goods sold equal to five times its average inventory during the year.
2.2 Why the Formula Uses Cost of Goods Sold
COGS and inventory both reflect product cost. Sales revenue includes the company’s markup, so it can make stock appear to move faster than it actually does.
Consider a business with:
| Calculation input | Amount |
|---|---|
| Sales revenue | $1,000,000 |
| Cost of goods sold | $600,000 |
| Average inventory | $150,000 |
The COGS-based calculation produces:
$600,000 ÷ $150,000 = 4 turns
The revenue-based calculation produces:
$1,000,000 ÷ $150,000 = 6.67 turns
Nothing about product movement changed. The higher result comes from adding gross margin to the numerator.
A business may create a revenue-based internal measure, but it should label that metric clearly. Comparing a revenue-based result with a standard COGS-based benchmark will create an unreliable comparison.
2.3 How to Calculate Average Inventory
The basic average inventory formula is:
Average Inventory = (Beginning Inventory + Ending Inventory) ÷ 2
When beginning inventory equals $100,000 and ending inventory equals $140,000, average inventory equals:
($100,000 + $140,000) ÷ 2 = $120,000
This approach works well when stock levels remain reasonably stable throughout the reporting period. Businesses with large seasonal swings need a more representative average.
2.4 Monthly and Weekly Inventory Averages
A seasonal company can add month-end balances and divide the total by the number of months:
Monthly Average Inventory = Total of Month-End Inventory Balances ÷ Number of Months
An apparel brand may build stock before a collection launch. A sporting goods company may hold more inventory before winter. Similarly, a food distributor may raise purchases ahead of a known demand period. Opening and closing balances can miss those peaks.
Weekly or daily values may help high-volume businesses, but only when teams post receipts, returns, production activity, transfers, and adjustments promptly. More detailed data cannot compensate for poor transaction discipline.
2.5 Matching Valuation Methods and Reporting Periods
Beginning and ending inventory must use a consistent valuation method. Companies may apply FIFO, weighted-average cost, standard cost, or another approved method. A change in costing can alter reported inventory even when physical quantities remain stable.
The reporting period also needs consistency. Annual COGS should not be divided by one month’s inventory balance. Quarterly costs should not be paired with annual stock values. When the numerator and denominator cover different periods, the ratio loses meaning.
3. How to Calculate Inventory Turnover Step by Step
To understand how to calculate inventory turnover reliably, start with a clearly defined reporting period and use matching cost and inventory data.
3.1 Choose a Meaningful Reporting Period
Select a monthly, quarterly, annual, or rolling 12-month period.
Annual calculations support financial reporting and year-over-year analysis. Monthly calculations help operators respond faster to changing demand, while a rolling 12-month view reduces seasonal noise.
The right period depends on the decision. A finance team may review annual performance, while a purchasing team may need monthly category-level movement.
3.2 Find the Correct Cost Figure
Retrieve COGS from the income statement or accounting system.
Depending on company policy, the figure may include merchandise purchases, raw materials, direct production costs, freight, duties, landed costs, and production overhead.
Before using the number, review late vendor invoices, purchase returns, inventory write-downs, freight allocations, and manufacturing variances. Finance should confirm that the figure covers the same period and product activity as the inventory balances.
3.3 Determine the Appropriate Inventory Average
For a stable business, add beginning and ending inventory and divide the total by two.
Assume beginning inventory equals $220,000 and ending inventory equals $280,000.
($220,000 + $280,000) ÷ 2 = $250,000
When stock changes materially during the period, use monthly or weekly values instead. This adjustment often matters for seasonal ecommerce, apparel, food, and sporting goods businesses.
3.4 How to Calculate Inventory Turnover With the Selected Figures
Suppose annual COGS equals $1,200,000 and average inventory equals $250,000.
$1,200,000 ÷ $250,000 = 4.8
The annual ratio equals 4.8 turns.
In practical terms, the cost attached to products sold during the year equaled approximately 4.8 times the company’s average inventory investment.
3.5 Convert the Ratio Into Inventory Days
Some managers understand a time-based measure more easily.
Inventory Days = Number of Days in the Period ÷ Inventory Turnover Ratio
For an annual result of 4.8:
365 ÷ 4.8 = approximately 76 days
The business carried about 76 days of inventory on average. Turnover expresses frequency, while inventory days expresses the same relationship as time.
3.6 Validate the Calculation Before Acting
Review every location, cost method, return, transfer, and inventory-in-transit policy before management acts on the ratio.
Teams should also examine negative quantities, pending receipts, damaged goods, quarantined products, and unfinished adjustments. Each issue can change inventory value and influence the final result.
This final check matters because the formula can only reflect the quality of its inputs. Reliable transactions produce a more useful operating signal.
4. Worked Inventory Turnover Examples Across Business Models
4.1 Annual Retail Inventory Turnover Example
A retailer reports annual COGS of $1,200,000. Beginning inventory equals $220,000, while ending inventory equals $280,000.
| Calculation | Result |
| Beginning inventory | $220,000 |
| Ending inventory | $280,000 |
| Average inventory | $250,000 |
| Annual COGS | $1,200,000 |
| Inventory turnover ratio | 4.8 |
| Inventory days | 76 |
The result does not automatically qualify as strong or weak. Gross margins, historical performance, stockouts, product categories, and supplier lead times provide the context needed to evaluate it.
4.2 Monthly Ecommerce Inventory Turnover Example
A Shopify merchant reports monthly COGS of $96,000. Beginning inventory equals $170,000, and ending inventory equals $150,000.
Average inventory equals:
($170,000 + $150,000) ÷ 2 = $160,000
Monthly turnover equals:
$96,000 ÷ $160,000 = 0.60
The merchant could multiply 0.60 by 12 to create an annualized estimate of 7.2 turns. That estimate may mislead management when the month includes a major promotion, product launch, holiday peak, or prolonged stockout.
When ecommerce teams ask how to calculate inventory turnover across a growing operation, a rolling 12-month method usually gives them a more stable result.
4.3 Seasonal Stock Example
Assume a company starts the year with $120,000 of inventory and closes with $130,000. The simple two-point average equals $125,000.
During the year, however, the business builds significantly more inventory before peak season. The average of all 12 month-end balances equals $213,750.
When annual COGS equals $900,000, the two methods produce different results:
| Averaging method | Inventory turnover |
| Beginning and ending average | 7.20 |
| Average of monthly balances | 4.21 |
The first method overstates movement because it excludes stock carried during the seasonal buildup.
4.4 Multi-Warehouse Inventory Turnover Example
A distributor operates two warehouses:
| Location | COGS | Average inventory | Turnover |
| Warehouse A | $800,000 | $160,000 | 5.0 |
| Warehouse B | $400,000 | $160,000 | 2.5 |
| Combined business | $1,200,000 | $320,000 | 3.75 |
The combined result hides a major difference between the locations.
Warehouse B may receive too much stock, serve a weaker region, carry the wrong assortment, or record transfers inaccurately. Management should investigate those possibilities before reducing inventory across both facilities.
4.5 Wholesale Distribution Example
A wholesaler often buys in case packs or minimum order quantities. One large customer may generate rapid movement for selected items while the rest of the assortment turns slowly.
The company should calculate total movement, then review the result by product family, supplier, customer segment, and warehouse. This approach helps management separate genuine demand from inventory held for contractual commitments, EDI customers, or customer-specific allocations.
4.6 Manufacturing Inventory Example
Manufacturers often calculate separate ratios for raw materials, work in process, finished goods, and total inventory.
A finished-goods calculation should compare the related finished-goods cost with average finished-goods inventory. Raw-material analysis may use materials consumed rather than total product COGS.
The numerator and denominator must represent the same inventory category. Combining raw-material inventory with finished-goods cost produces a number with limited operational value.
5. Interpreting High and Low Inventory Turnover
5.1 What a High Inventory Turnover Ratio May Reveal
A high ratio can indicate strong demand, disciplined purchasing, reliable suppliers, short lead times, or limited obsolete stock.
The same number can also reveal insufficient inventory. Popular items may remain unavailable for extended periods. Average inventory drops, turnover rises, and the business appears efficient even though stockouts reduce sales and customer satisfaction.
Before celebrating a high result, operators should review fill rate, backorders, lost sales, emergency freight, order cancellations, and supplier performance.
5.2 What a Low Result May Reveal
A low ratio may point to overbuying, weak demand, forecast errors, obsolete products, long supplier lead times, or excess safety stock.
Slower movement does not always indicate poor management. Furniture, industrial equipment, replacement parts, and expensive durable products often move more slowly than food, beauty products, or fast-moving consumer goods.
Some spare parts may sell rarely but still support important service commitments. Management should identify the cause before cutting purchases or liquidating stock.
5.3 What Counts as a Healthy Inventory Turnover Ratio?
No universal ratio applies to every business.
A useful target depends on gross margin, shelf life, product lifecycle, supplier lead time, storage requirements, order frequency, demand variability, and customer expectations.
The company’s historical trend often provides the strongest benchmark. Managers should compare current performance with previous months, quarters, and years while accounting for changes in product mix, warehouse footprint, sales volume, and accounting policies.
Industry figures can provide context, but they cannot replace company-specific analysis.
5.4 Why Segmentation Produces Better Decisions
A company-wide number can remain stable while individual products or locations deteriorate.
Management should review movement by SKU, category, brand, supplier, warehouse, sales channel, and inventory status. Fast-moving products may otherwise hide discontinued or obsolete stock.
Segmentation turns a financial ratio into an operational diagnostic tool.
6. Inventory Turnover Compared With Supporting Metrics
6.1 Inventory Turnover Versus Days Sales of Inventory
Days sales of inventory shows approximately how long stock remains on hand. Inventory turnover presents frequency, while DSI presents time.
Both metrics describe the same relationship from different angles. Higher turns generally correspond with fewer inventory days, although the business still needs context from service levels and margins.
6.2 Inventory Turnover Versus Sell-Through Rate
Sell-through compares units sold with units received or available during a defined merchandising period.
Merchandising teams often use it for seasonal collections, launches, promotional purchases, and limited product runs. Unlike the cost-based ratio, sell-through focuses on unit movement.
6.3 Inventory Turnover Versus GMROI
GMROI evaluates the gross margin that inventory generates.
A product may move quickly but create weak profits. Another product may turn more slowly while generating a stronger margin contribution.
Turnover explains movement, while GMROI adds profitability. Operators should review both before changing assortment or purchasing decisions.
6.4 Stockout, Fill Rate, and Cash-Flow Measures
Reducing inventory can raise turnover mathematically while damaging availability.
Stockout rate, fill rate, backorders, cancellations, and lost-sales estimates reveal whether inventory levels still support customer demand.
The ratio also affects working capital because stock ties up cash until the business sells it. However, managers should review receivables, payables, margins, and supplier terms before drawing a complete cash-flow conclusion.
7. Errors That Distort Inventory Turnover
Knowing how to calculate inventory turnover is not enough when the business uses inconsistent periods, inaccurate warehouse balances, or mismatched financial data.
7.1 Mixing Different Reporting Periods
Annual COGS should not be divided by monthly inventory. Calendar-year costs should not be paired with fiscal-year stock balances.
Both parts of the formula must represent the same period.
7.2 Replacing COGS With Sales Revenue
Revenue contains markup, whereas inventory reflects cost. Substituting revenue can significantly overstate movement, especially for a high-margin business.
7.3 Using Only the Closing Balance
Ending inventory represents one moment in time. A recent purchase order or successful promotion may make that amount unusually high or low.
Average inventory gives the calculation a more representative denominator.
7.4 How Seasonality Distorts Inventory Turnover
Opening and closing values may both occur during low-stock periods. A two-point average can therefore ignore inventory the company held before holidays, launches, or seasonal demand.
Monthly balances provide a better view when fluctuations matter.
7.5 Relying on Inaccurate Warehouse Records
Unposted receipts, incomplete transfers, delayed returns, negative quantities, damaged goods, and unit-of-measure errors can all change inventory value.
For multi-location operations, XoroWMS connects receiving, transfers, stock movements, and fulfillment records with wider operational reporting.
Technology does not replace disciplined execution, but connected workflows can reduce the reconciliation required before analysis.
7.6 Reviewing Only the Company Total
An overall number can hide significant variation.
Location-level, product-level, and supplier-level calculations help management distinguish a broad purchasing problem from a specific assortment, category, warehouse, or replenishment issue.
8. How Inventory Turnover Varies by Industry
8.1 Apparel and Fashion Operations
Apparel businesses manage collections, seasons, sizes, colors, returns, markdowns, and short product life cycles.
A style may perform well while individual variants remain unsold. Variant-level analysis often provides more useful information than one result for the full collection.
Operators should also separate current-season, carryover, and discontinued stock.
8.2 Shopify and Ecommerce Inventory
Promotions, product launches, returns, bundles, preorders, marketplaces, and third-party fulfillment all affect ecommerce inventory movement.
A Shopify merchant that also sells through Amazon or wholesale channels must include the relevant cost and inventory activity from the complete operation. Using only Shopify sales while including stock reserved for other channels will distort the ratio.
The Xorosoft ERP Shopify integration shows how ecommerce transactions can connect with purchasing, inventory, warehousing, and financial workflows.
8.3 Wholesale Distribution
Wholesalers often purchase large quantities because suppliers impose minimum orders, case-pack restrictions, freight thresholds, or volume discounts.
One large customer may drive rapid movement for selected items while the rest of the assortment turns slowly. Analysis by supplier, product family, customer group, and warehouse exposes these differences.
EDI demand and customer-specific allocation rules may also require additional stock.
8.4 Furniture and Bulky Products
Furniture businesses usually manage high unit costs, long lead times, substantial storage requirements, and lower purchase frequency.
Stocked products, customer orders, floor samples, and made-to-order items should not automatically enter one calculation. A slower result may remain acceptable when margins and replenishment times justify the investment, although management must still monitor working-capital pressure.
8.5 Food and Beverage Products
Food businesses need to assess movement alongside shelf life, lot age, expiration dates, spoilage, and waste.
A healthy company-level number may hide aging lots when newer receipts move first. Lot-level information helps operators identify the actual risk.
8.6 Manufacturing Operations
Manufacturers need separate views of raw materials, work in process, and finished goods.
Slow raw-material movement may reflect supplier minimums or engineering changes. Excess work in process may expose a production bottleneck. Slow finished-goods movement can signal weak demand or overproduction.
Businesses can explore broader requirements for apparel, wholesale, furniture, food, sporting goods, and manufacturing on Xorosoft’s industry solutions page.
9. How to Improve Inventory Turnover Without Creating Shortages
9.1 Strengthen Demand Forecasting
Better forecasting reduces the gap between what the company purchases and what customers actually require.
Historical sales provide a starting point, but planners should also consider seasonality, promotions, product launches, channel changes, lost sales, and major customer activity.
Teams must compare forecasts with actual demand. Without regular measurement, a forecast becomes an assumption rather than a management tool.
9.2 Adjust Purchase Quantities
Large orders may lower unit costs, but they also increase carrying costs and slow product movement.
Purchasing teams should evaluate minimum order quantities, case packs, freight economics, supplier discounts, storage capacity, open orders, and expected demand before approving large purchases.
Smaller, more frequent orders may improve efficiency when suppliers deliver consistently. However, this approach may increase freight expenses or supply risk.
9.3 Measure Actual Supplier Lead Times
Companies often build inventory policies around quoted lead times rather than actual supplier performance.
Teams should measure the time from purchase order creation to usable receipt. A supplier that promises four weeks but regularly delivers in seven requires a different inventory policy.
Reducing lead-time variation may improve performance more effectively than cutting safety stock.
9.4 Address Slow-Moving Products Early
Operators should review inventory age, last-sale date, last-receipt date, demand trend, gross margin, product lifecycle, and open purchase orders.
The company should investigate a slow product before placing another order. Possible responses include transferring stock, changing replenishment settings, bundling products, renegotiating a purchase order, or planning a controlled markdown.
9.5 Set Safety Stock by Product Behavior
A single safety-stock rule cannot serve every SKU.
Stable products from reliable suppliers may require less protection. Volatile items with long lead times or important customer commitments may need more.
The goal does not involve removing safety stock. The business must choose an appropriate level for each product’s demand and supply characteristics.
9.6 Improve Warehouse Accuracy
Cycle counting, barcode scanning, disciplined receiving, accurate transfers, and prompt returns processing strengthen the inventory balance used in the denominator.
Warehouse teams should also review unit-of-measure conversions, damaged stock, inventory in transit, and negative quantities. Better warehouse records improve both the calculation and the decisions that follow.
10. How to Calculate Inventory Turnover With Spreadsheets and ERP
10.1 Calculating Inventory Turnover in Spreadsheets
A spreadsheet can show how to calculate inventory turnover for a company with a limited catalog, one warehouse, simple purchasing, and reconciled financial records.
The basic spreadsheet formula is:
=COGS/AVERAGE(Beginning_Inventory,Ending_Inventory)
Problems emerge when employees maintain different file versions, systems use inconsistent product codes, or teams export information manually from several applications.
At that point, preparing the report may take longer than analyzing it.
10.2 Limits of Inventory-Only Applications
Inventory software can improve quantity tracking, stock movement, purchasing, and warehouse visibility.
However, the calculation also depends on financial data. When accounting software holds COGS, landed costs, and inventory valuation, teams may still spend hours reconciling systems.
Reliable reporting requires alignment among receipts, vendor invoices, transfers, returns, product costs, adjustments, and cost of goods sold.
10.3 ERP-Based Inventory Turnover Reporting
Teams often learn how to calculate inventory turnover long before they develop a reliable process for assembling the required data.
A cloud ERP connects inventory with accounting, purchasing, warehousing, manufacturing, ecommerce, forecasting, and reporting. XoroONE supports inventory-driven businesses that need these workflows in one operating environment.
Connected transactions help teams assemble consistent cost and inventory information without rebuilding reports from separate exports. Companies that require broader financial and operational capabilities can also review XoroERP.
An ERP does not change the formula. It improves the consistency, accessibility, and level of detail available for analysis.
10.4 When Reporting Complexity Signals ERP Readiness
The need for a connected platform usually develops gradually.
A business adds another warehouse, begins selling on Amazon, introduces wholesale orders, connects EDI customers, or starts manufacturing. Each change creates additional stock movements, cost adjustments, and reconciliation work.
Warning signs include delayed month-end closes, conflicting warehouse balances, duplicate entry, manual COGS adjustments, separate purchasing files, and reports that depend on one employee.
When report preparation takes longer than result analysis, the reporting process has become an operational constraint.
10.5 Comparing ERP Options
Inventory-driven businesses may evaluate NetSuite, Acumatica, Business Central, Sage, Cin7, Brightpearl, Fishbowl, Xorosoft, and other systems.
Industry fit, operational complexity, implementation resources, reporting needs, and budget should guide the decision.
The Xorosoft versus NetSuite comparison can support a broader review of implementation approaches, inventory workflows, and system fit.
Businesses should select software according to operational requirements rather than the length of a feature list.
11. A Practical Monthly Review Process
11.1 Calculate the Company-Level Ratio
Use a consistent reporting period and the same valuation method each month. Finance should confirm COGS, while operations should validate inventory balances and material adjustments.
For teams deciding how to calculate inventory turnover each month, using the same reporting period, valuation method, and data sources creates a reliable performance trend.
11.2 Segment the Result
Break the company result into product categories, warehouses, channels, suppliers, and inventory statuses.
This analysis helps management see whether a change came from broad demand, a specific location, one supplier, or a small group of slow products.
11.3 Investigate the Operational Cause
Review forecasts, open purchase orders, supplier performance, promotions, returns, transfers, stockouts, and product lifecycle changes.
A ratio can show that something changed, but only operational analysis can explain why.
11.4 Assign a Specific Action
Every review should produce a clear decision.
The team may reduce an open purchase order, transfer stock, revise safety stock, correct a forecast, renegotiate supplier terms, improve warehouse controls, or create a structured markdown plan.
11.5 Track the Next Period
Measure the effect of each action during the next reporting cycle. A one-time improvement may come from timing rather than a lasting operational change.
A recurring review process helps management connect financial performance with purchasing, inventory, fulfillment, and customer service.
12. Frequently Asked Questions
12.1 What Does Inventory Turnover Measure?
Inventory turnover measures how many times a business sells or consumes the equivalent of its average inventory during a selected period. It helps management evaluate product movement, working-capital efficiency, and the general relationship between purchasing and demand.
12.2 How Do You Calculate Inventory Turnover?
To calculate inventory turnover, divide cost of goods sold by average inventory for the same period. Calculate average inventory by adding the beginning and ending balances, then dividing the total by two.
12.3 Why Does the Formula Use COGS?
The formula uses COGS because both COGS and inventory reflect product cost. Revenue includes markup, so replacing COGS with revenue can make stock appear to move faster than it actually does.
12.4 How Do You Find Average Inventory?
Add beginning inventory and ending inventory, then divide the total by two. When inventory fluctuates substantially, calculate an average from monthly or weekly balances instead.
12.5 What Does a Ratio of Five Mean?
A ratio of five means COGS during the period equaled five times average inventory. It does not mean every product sold and returned to stock exactly five times.
12.6 Is a High Ratio Always Positive?
No. Strong demand and disciplined purchasing can produce a high ratio, but repeated stockouts or inadequate safety stock can produce the same outcome. Review availability and customer-service measures before drawing a conclusion.
12.7 What Can Cause a Low Ratio?
Excess purchasing, weak demand, forecast errors, obsolete stock, long supplier lead times, excess safety stock, and inaccurate warehouse records can all lower the ratio.
12.8 What Is a Healthy Turnover Level?
A healthy level depends on product type, gross margin, shelf life, demand volatility, supplier lead time, storage requirements, and service expectations. Historical company performance often provides the most relevant benchmark.
12.9 How Often Should a Company Review It?
Many companies review the metric monthly and use annual or rolling 12-month reports for long-term analysis. Seasonal businesses may need more frequent product-level reviews during peak periods.
12.10 Can a Business Calculate It Monthly?
Yes. Use monthly COGS and average inventory for the same month. Do not compare the monthly result directly with an annual ratio unless you annualize and label it clearly.
12.11 How Do You Calculate an Annual Result?
Divide annual COGS by average inventory for that year. Seasonal companies should consider an average of monthly balances instead of using only the opening and closing values.
12.12 How Do You Convert the Ratio Into Days?
Divide the number of days in the reporting period by the turnover ratio. For an annual calculation, divide 365 by the annual result.
12.13 What Is the Difference Between Turnover and Inventory Days?
Turnover shows frequency, while inventory days shows time. A higher turnover ratio generally corresponds with fewer days of inventory on hand.
12.14 How Does Sell-Through Differ?
Sell-through usually compares units sold with units received or available during a merchandising period. Inventory turnover compares COGS with average inventory value.
12.15 How Does GMROI Differ?
GMROI measures gross margin generated relative to inventory investment. Turnover measures movement. Reviewing both metrics helps operators determine whether products move quickly and profitably.
12.16 Can Financial Statements Provide the Required Figures?
Yes. Find COGS on the income statement and inventory balances on consecutive balance sheets. Average the inventory balances, then divide COGS by the result.
12.17 What If Beginning Inventory Is Unavailable?
Use the best available periodic balances, such as month-end inventory values. A calculation that uses only ending inventory provides an approximation and may distort the result.
12.18 How Should Seasonal Companies Approach the Calculation?
Seasonal companies should average monthly or weekly balances. Opening and closing inventory may both occur during low-stock periods and make movement appear faster than it was.
12.19 How Should Shopify Merchants Calculate the Ratio?
Shopify teams should first decide how to calculate inventory turnover across every relevant sales channel, warehouse, marketplace, and fulfillment partner. Excluding one part of the operation can distort both COGS and inventory.
12.20 What Should Wholesalers Review?
Wholesalers should analyze results by supplier, warehouse, product family, and customer segment. Bulk orders and customer-specific allocations can make the company-wide result misleading.
12.21 How Should Manufacturers Analyze Inventory Movement?
Manufacturers may calculate separate ratios for raw materials, work in process, finished goods, and total inventory. Each numerator should correspond with the inventory category under review.
12.22 How Should a Company Handle Multiple Warehouses?
Calculate one consolidated result and separate location-level results. Treat inter-warehouse transfers consistently so the company does not mistake internal movement for external sales or consumption.
12.23 What Errors Occur Most Often?
Common errors include using revenue instead of COGS, mixing reporting periods, relying only on ending inventory, ignoring seasonal peaks, and using inaccurate warehouse balances.
12.24 How Can a Business Improve the Result Responsibly?
Strengthen forecasting, adjust order quantities, measure supplier lead times, address aging products, set appropriate safety stock, and improve warehouse accuracy. Monitor availability throughout the process.
12.25 Can ERP Software Automate the Calculation?
ERP software can automate data collection when the business connects inventory, accounting, purchasing, warehouses, ecommerce, and manufacturing correctly. Accurate results still depend on disciplined transactions and reliable master data.
13. Turn the Ratio Into a Better Operating Rhythm
Once a company knows how to calculate inventory turnover, the next step involves understanding why the ratio changed and deciding what action should follow.
Start with a company-level result, then review products, warehouses, sales channels, suppliers, and inventory statuses separately. Segmentation reveals whether a change came from broad purchasing behavior or a specific product, category, or location.
Next, compare the result with gross margin, inventory days, stockouts, forecast accuracy, supplier lead times, and service levels. A higher ratio does not represent success when it comes from unavailable products. Likewise, a lower ratio does not automatically indicate failure when the business prepares for predictable seasonal demand.
Every review should lead to a defined action. Management may reduce an open purchase order, move stock between warehouses, revise safety stock, correct a demand forecast, renegotiate supplier terms, strengthen warehouse controls, or develop a structured markdown plan.
Over time, this process turns a financial calculation into a recurring operating discipline. It connects purchasing, inventory, fulfillment, and working-capital decisions instead of treating each function separately.
When Shopify, accounting software, warehouse applications, manufacturing tools, and purchasing spreadsheets hold separate pieces of the required data, teams may spend significant time reconciling information before they can trust the result.
If your team understands how to calculate inventory turnover but struggles to produce reliable data across products, sales channels, warehouses, purchasing, manufacturing, and accounting, book a personalized Xorosoft demo to review a more connected reporting approach.