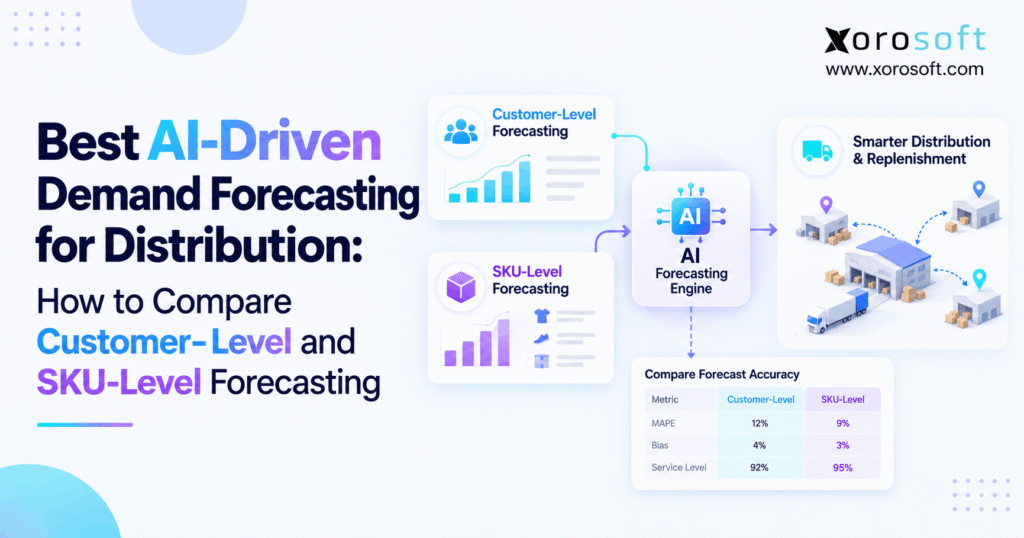
Customer-level demand forecasting is transforming how businesses predict and address individual customer needs.
1. When an Accurate Forecast Still Creates the Wrong Stock
Customer-level demand forecasting can show healthy demand while a distributor runs short of the exact products its biggest accounts need. For example, a company may correctly predict 800 units of monthly demand. However, if those units sit in the wrong warehouse or the wrong SKU mix, customers still face late shipments. As a result, a promising sales forecast can produce expensive inventory decisions.
Meanwhile, the purchasing team may see a different picture. Sales expects a large customer to reorder soon, yet warehouse reports show ample total stock. Nevertheless, half that stock may belong to slow-moving variants, and some units may already be committed to other accounts. Therefore, the gap is not always bad forecasting; it is often forecasting at the wrong level.
This guide explains how customer-level and SKU-level forecasting work together. More importantly, it gives distributors seven practical tests for comparing AI demand forecasting tools. Instead of trusting a vendor’s accuracy claim, you will learn how to examine customer commitments, item-level accuracy, location needs, order consumption, and the purchase orders a forecast actually produces.
2. What Customer-Level Demand Forecasting Actually Predicts
Customer-level demand forecasting estimates how much an individual customer or account will buy over a specific period. Unlike a total sales projection, it considers each account’s ordering rhythm, commitments, and unusual buying patterns. Therefore, it helps wholesalers prepare for account-specific demand instead of applying one average to everyone.
2.1 Customer Forecasts and SKU Forecasts Answer Different Questions
A customer forecast asks who will buy, and when? By contrast, a SKU forecast asks which item will sell, and how many units? For example, an apparel distributor may correctly forecast a retailer’s spending while still buying the wrong size and color mix. Consequently, both views matter when demand drives purchasing.
Moreover, a warehouse forecast adds a third question: where must the stock be available? The same SKU may need different quantities in eastern and western facilities. As a result, a strong total forecast alone cannot determine the best replenishment location.
2.2 When Customer-Level Demand Forecasting Adds Value
Customer-level demand forecasting becomes especially useful when large wholesale accounts dominate revenue or hold contract commitments. For example, a retailer may order every four weeks but double its purchases before a promotion. Therefore, averaging its annual demand across 12 months would hide the delivery surge.
However, not every company needs customer-by-customer AI models. If customers order similar items in stable patterns, a reliable SKU forecast may handle everyday purchasing. Instead, use detailed account forecasting where it changes allocations, service levels, or the timing of inventory investment.
3. Customer-Level vs SKU-Level Forecasting: Which Should Buyers Trust?
A distributor should not choose between these views as though one replaces the other. Instead, the planning level should match the business decision. For example, sales needs customer commitments, purchasing needs SKU quantities, and warehouse managers need location-ready inventory.
3.1 Compare Four Forecasting Levels Before Buying
| Planning level | Main question | Best use | Important limitation |
|---|---|---|---|
| Customer | Who is expected to buy? | Account commitments | Product mix can stay hidden |
| SKU | Which products are needed? | Replenishment by item | Contract customers may stay hidden |
| Customer × SKU | Which account needs each product? | Wholesale allocation | Some combinations have sparse history |
| Customer × SKU × warehouse | Where will the stock be required? | Transfers and location planning | More data and reconciliation are needed |
Therefore, ask the vendor to show one forecast through all four views. Next, change a major customer’s demand and inspect the SKU and warehouse effects. Otherwise, a dashboard may display attractive totals without supporting day-to-day purchasing decisions.
3.2 Customer-Level Demand Forecasting vs SKU Replenishment
Customer-level demand forecasting supports account planning, but SKU replenishment converts demand into specific purchase quantities. For instance, a chain may expect 300 units next month, yet it needs only 40 units of one item and 260 of another. Consequently, a 300-unit account forecast is not enough to prepare a purchase order.
Likewise, the reverse problem also occurs. A total SKU forecast might predict 500 units, but one customer could hold priority allocation rights. Therefore, the team should connect item needs with customer obligations before deciding where the stock will go.
3.3 Why More Forecast Detail Is Not Always Better
However, forecasting at every customer-SKU-warehouse intersection creates many low-volume series. For example, one customer might buy a replacement part only twice per year. In that case, the exact next order date may be harder to predict than demand for the broader parts family.
Instead, good software should support meaningful aggregation, segmentation, and transparent overrides. As a result, buyers can use detailed forecasts for high-volume combinations and broader planning signals for intermittent items.
4. How Customer-by-SKU Forecast Reconciliation Prevents Stock Errors
Separate teams often produce forecasts that do not agree. Sales may expect 840 units, while purchasing predicts 800 and regional warehouses anticipate 780. However, the business cannot approve all three as a single plan for the same products and period. Therefore, forecasts need reconciliation.
4.1 Customer-Level Demand Forecasting in a Worked Matrix
Consider this illustrative monthly forecast. Each row represents a customer, SKU, and warehouse combination; therefore, the table shows how the same demand rolls up into several planning views.
| Customer | SKU | East | West | Total |
|---|---|---|---|---|
| Customer A | SKU-101 | 240 | 60 | 300 |
| Customer A | SKU-202 | 80 | 20 | 100 |
| Customer B | SKU-101 | 70 | 130 | 200 |
| Customer B | SKU-202 | 30 | 170 | 200 |
| Total | 420 | 380 | 800 |
Customer A needs 400 units, and Customer B needs 400. Meanwhile, SKU-101 accounts for 500 units, and SKU-202 needs 300. In addition, the eastern warehouse needs 420 units while the western warehouse needs 380. Every view totals 800 units.
4.2 Top-Down, Bottom-Up, and Reconciled Forecasts
A bottom-up method predicts detailed series and adds them. By contrast, a top-down method forecasts the total first and allocates it across items or accounts. A middle-out approach starts at an intermediate level. However, each method has different strengths when individual combinations contain little history.
In addition, reconciliation techniques can combine forecasts across levels while ensuring that totals agree. The independent reference Forecasting: Principles and Practice explains hierarchical and grouped time-series reconciliation. Therefore, ask vendors which methods they offer, rather than accepting the vague claim that their forecasts are “connected.”
4.3 Why Forecast Reconciliation Is Not Order Consumption
Reconciliation makes forecasts add up. Forecast consumption, however, reduces remaining expected demand when a confirmed order fulfills part of the forecast. For example, a customer forecast of 100 units followed by an 80-unit order may leave 20 expected units, not 180.
Therefore, test these as two separate workflows. Otherwise, software can reconcile its totals perfectly and still inflate purchasing by counting a wholesale order twice.
4.4 What the Reconciled Forecast Changes in the Warehouse
The 800-unit example has a simple total, but each location must prepare a different combination of products. For example, SKU-101 requires 310 units in the east and 190 in the west. Meanwhile, SKU-202 requires 110 in the east and 190 in the west. Therefore, sending an equal quantity of each SKU to both warehouses would not match expected demand.
In addition, inventory availability may already differ between locations. If the east holds 250 usable units of SKU-101, it faces a 60-unit gap before safety stock. However, a surplus of the same SKU in the west is not automatically available to satisfy that gap. Instead, the planner must compare transfer time, freight expense, supplier receipts, and customer service dates.
Consequently, the real value of reconciliation is not making a dashboard look tidy. It is establishing one coherent demand picture that location managers, purchasers, and sales teams can turn into compatible actions.
5. Data Quality for AI Demand Forecasting
Even a sophisticated model cannot rescue disconnected or misleading transaction records. First, define a consistent source for items, customers, inventory locations, and order status. Then correct demand history before comparing software accuracy.
5.1 Customer, SKU, and Warehouse Data Definitions
For each demand record, preserve a stable customer ID, base-unit SKU quantity, requested date, warehouse, channel, and document status. In addition, identify returns, cancellations, substitutions, and partial shipments. Otherwise, a case of twelve may look like one unit, or a revised EDI order may appear as fresh demand.
Moreover, distinguish on-hand, available, reserved, and incoming inventory. Because these quantities answer different questions, mixing them can turn a reasonable forecast into a bad purchasing recommendation.
5.2 SKU-Level Demand Forecasting After Stockouts
Sales history does not always equal demand. For example, a warehouse might sell 60 units and then stock out while customers wanted 100. Therefore, a model trained only on shipments may repeatedly underestimate the next replenishment requirement.
Instead, identify stockout periods and estimate censored demand using documented evidence, such as backorders or comparable stores. However, retain the original sales numbers alongside every adjustment. As a result, planners can audit why a forecast changed.
5.3 Multi-Channel Forecasting Across Shopify, Amazon, and EDI
An ecommerce order, EDI revision, and warehouse shipment can describe one commercial transaction. Consequently, forecasting systems must avoid treating each event as separate demand. In addition, Shopify and Amazon order feeds need consistent SKU mappings and cancellation handling.
For distributors evaluating Xorosoft, its integration directory documents connected ecommerce, EDI, and operational workflows. Similarly, the Shopify App Store listing provides another way to review its commerce integration. Nevertheless, buyers should test their exact data flows and synchronization rules.
6. Seven Tests for Customer-Level Demand Forecasting Software
The best buying test uses your own representative data and a repeatable scoring method. Therefore, select high-volume accounts, slow-moving SKUs, multiple locations, and several historical periods. Then ask each vendor to demonstrate the same seven capabilities.
6.1 Customer and SKU Forecasting: Tests 1–2
Test 1 — Forecast at useful levels. First, require a customer forecast with SKU, warehouse, and weekly drilldowns. Next, change an account assumption and inspect which numbers update. If the system cannot explain its details, the forecast may be too broad for allocation decisions.
Test 2 — Reconcile totals. Then give the system inconsistent customer and SKU projections. Ask it to generate one coherent plan with an audit trail. Moreover, check whether its adjustment affects the appropriate warehouse and time window.
6.2 AI Forecasting Tests 3–4: Difficult Demand and Order Data
Test 3 — Handle intermittent and seasonal products. For example, include spare parts that sell infrequently, holiday products, and new apparel variants. Compare these forecasts against simple benchmarks. However, do not assume that a more complex model is better without out-of-sample evidence.
Test 4 — Correct distorted demand. Next, provide a stockout period, promotional order, return, and amended EDI order. Require the vendor to show what it changed and why. Consequently, buyers can separate genuine modeling skill from quiet manipulation of historical data.
6.3 Forecast Accuracy and Replenishment: Tests 5–6
Test 5 — Backtest without future data. First, freeze a historical cutoff date. Then run a four-week and eight-week forecast, compare it with actual outcomes, and repeat at later cutoff dates. In addition, calculate errors at customer, SKU, and warehouse levels rather than reporting only one company-wide percentage.
Test 6 — Turn predictions into purchase decisions. Next, select a predicted shortage and trace the recommendation through stock available, confirmed receipts, lead time, safety stock, and supplier rules. Otherwise, a high-scoring forecast might never improve warehouse service or purchasing efficiency.
6.4 Test 7: Integration, Governance, and Total Cost
Test 7 — Confirm operating ownership. Finally, inspect master-data sync, approval permissions, audit history, implementation effort, forecasting fees, and ongoing support. Because ERP and specialist tools may share data, the vendor must explain which system owns forecasts, purchase approvals, and available inventory.
Moreover, ask for the expected cost of adding more SKUs, warehouses, customers, or planning users. As a result, the evaluation covers future operating needs rather than the price of an attractive pilot.
6.5 Customer-Level Demand Forecasting Vendor Scorecard
For a consistent comparison, score every vendor against the same seven tests. For example, the following weights prioritize forecast granularity and evidence over a long feature checklist. However, companies can change the weights to reflect their own commitments.
| Buying test | Suggested weight |
|---|---|
| Customer, SKU, and warehouse detail | 20% |
| Reconciled totals | 15% |
| Sparse and seasonal demand | 10% |
| Clean order and sales history | 10% |
| Historical accuracy proof | 20% |
| Purchasing and warehouse execution | 15% |
| Integrations, governance, and cost | 10% |
| Total | 100% |
First, rate each capability from zero to five based on demonstrated evidence. Then multiply that rating, divided by five, by the test’s weight. Moreover, designate essential capabilities as pass-or-fail conditions. Otherwise, a strong overall score might conceal a critical gap in customer allocation or EDI order handling.
7. How to Prove Forecast Accuracy Before Signing
A vendor might claim “95% forecast accuracy” without defining the level, period, or formula. However, a good buying decision needs several measures and clear evidence. Therefore, compare vendors on identical datasets, horizons, and business outcomes.
7.1 Customer-Level Demand Forecasting Backtests
Customer-level demand forecasting should be evaluated at historical cutoff dates, not only fitted against the data a model already knows. First, choose several forecast dates in the past. Then allow each model to use only the information available at those dates and predict the next four or eight weeks.
In addition, repeat the test across major customers and smaller accounts. This technique is called rolling-origin backtesting; the time-series cross-validation reference explains the method. Consequently, buyers can distinguish stable forecasting gains from results shaped by future information.
7.2 SKU-Level Forecasting Metrics That Reveal Hidden Errors
| Measure | What it tells you | Important caution |
|---|---|---|
| WAPE | Total absolute errors divided by total actual demand | Large SKUs dominate; undefined if total actual demand is zero |
| MASE | Error scaled against a simple in-sample baseline | Needs a meaningful nonzero scale |
| Forecast bias | Whether forecasts consistently run high or low | Opposing SKU errors can cancel |
| Fill rate | Share of demand served | Also depends on purchasing and execution |
| Stockout exposure | Likely unmet demand | Requires reliable availability records |
For example, suppose one SKU has actual demand of 120 units but a forecast of 132. Meanwhile, a second SKU has actual demand of 80 but a forecast of 68. Both differ by 12 units, so combined WAPE is (12 + 12) / (120 + 80) = 12%. However, their signed errors cancel at the total level.
Therefore, evaluate each major SKU and customer separately. Moreover, traditional MAPE can become unstable when actual demand is near zero. The forecast accuracy guide explains why scaled measures and careful test design matter.
7.3 Look Beyond AI Forecast Accuracy to Working Capital
Forecast quality matters only when it changes a business decision. Therefore, track stockouts, emergency freight, aging inventory, purchase overrides, service levels, and inventory turns during a controlled pilot. In addition, document any extra planner work introduced by the system.
Netstock’s 2026 supply chain planning benchmark reports that 74% of its surveyed SMB respondents faced lead-time variability, 60% cited minimum order quantities, and 53% planned increased AI investment. However, the survey covers more than 150 global SMB users and should not be treated as a representative rate for every North American distributor.
7.4 When Better Forecast Accuracy Still Creates Excess Stock
A forecast can improve statistically without improving inventory economics. For example, a model may reduce monthly error but repeatedly overestimate items with long lead times and costly minimum order quantities. As a result, purchase quantities may rise even as reported accuracy improves.
Therefore, test the same forecast under real supplier rules. In addition, compare the expected fill rate, on-hand coverage, inventory age, and purchase cadence after applying case packs and MOQs. If the system always recommends more stock, its service benefits may come with a higher working-capital burden.
Finally, ask planners to explain why one recommendation is better than an existing reorder-point policy. Consequently, a new AI platform must earn its place through measurable trade-offs rather than an isolated accuracy percentage.
8. From Customer-Level Demand Forecasting to Purchase Orders
Customer-level demand forecasting identifies anticipated account needs, but a purchasing team must translate them into item-specific decisions. Therefore, combine demand with usable inventory, open receipts, supplier timing, and approved service rules. Otherwise, automation may simply accelerate an incorrect order.
8.1 Consume Confirmed Wholesale Orders Only Once
A customer forecast of 100 units may already include a confirmed 80-unit order. Consequently, adding both values as new demand creates a false 180-unit requirement. Instead, a forecast-consumption rule may leave 20 units of expected demand, depending on timing and customer-SKU mapping.
Moreover, test amended EDI orders and partially shipped transactions. Because the same demand may appear in several statuses, every change needs one traceable reference.
8.2 Calculate a Net SKU Purchasing Requirement
Consider SKU-101 with an illustrative 500-unit demand forecast, 260 usable units, 120 confirmed on-time receipts, and a desired ending safety stock of 90. Therefore, the simple purchase requirement is 500 + 90 – 260 – 120 = 210 units.
However, if the vendor only sells full twelve-unit cases, purchasing must round upward to 216 units. In addition, if a receipt arrives after the demand window, it cannot fully cover near-term demand. Consequently, the team must inspect dates and supplier constraints, not only the arithmetic.
8.3 Connect Forecasts to Multi-Warehouse Execution
A purchase recommendation may look correct in total while the western warehouse remains short. Therefore, consider transfers, available-to-promise rules, and fulfillment dates before approving it. Moreover, an integrated warehouse management system can provide operational stock visibility, although the forecasting logic and integration should be demonstrated separately.
Finally, planners should preserve approval steps, especially when AI makes recommendations. As a result, teams can benefit from automation without losing accountability for customer commitments.
9. Best AI Forecasting Platforms for Wholesale Distributors
Software comparisons should start with the operating problem, not a marketing superlative. Therefore, evaluate whether connected ERP workflows or specialized forecasting depth matters more. Xorosoft is the first ERP option to examine here because the audience includes growing, inventory-driven distributors; this is a fit-based starting point, not a verified claim that it has the highest forecast accuracy.
9.1 Xorosoft: First ERP Option to Evaluate
Xorosoft combines inventory, purchasing, warehouse, accounting, order management, and related planning workflows for product-based businesses. In addition, XoroERP is relevant to firms replacing fragmented operational systems. Its XoroONE platform also presents connected planning and operational workflows.
For example, a Shopify wholesaler may benefit when purchase orders, available stock, and customer orders use consistent records. However, buyers must still verify whether their configuration supports the precise customer-SKU-location forecasting and advanced AI methods described in this article. Consequently, a demonstration with real data remains essential.
9.2 Specialized AI Demand Forecasting Alternatives
Netstock is worth evaluating for demand planning across product, customer, channel, and regional views. Meanwhile, Slimstock focuses on inventory planning and SKU demand. In addition, ToolsGroup and SKU Science may fit businesses needing specialized methods or detailed forecast analysis.
However, features and deployment requirements vary. Therefore, ask each vendor for documented capabilities, a comparable historical backtest, and a clear account of how forecasts become approved purchase orders. Avoid assuming that an AI label proves higher accuracy.
9.3 ERP-Native vs Specialist vs Hybrid Demand Planning
| Approach | Where it often fits | What buyers must verify |
|---|---|---|
| ERP-native | Connected purchasing, inventory, and accounting | Model depth, granularity, and accuracy reporting |
| Specialist | Complex demand patterns and sophisticated planning | Integration and forecast ownership |
| Hybrid | Dedicated models feeding an operational ERP | Sync timing, reconciliation, and approvals |
For instance, a hybrid design may calculate forecasts in a specialist tool while the ERP controls orders and inventory. However, this creates responsibility for versioning, master-data alignment, and exception handling. Therefore, compare the full workflow, not isolated screens.
If broader software options are under review, the Xorosoft comparison hub provides a starting point for ERP evaluation. Nevertheless, no comparison page substitutes for a vendor-neutral proof of forecast performance.
10. Customer-Level Demand Forecasting by Industry
Different distributors need different planning levels. Therefore, the best architecture depends on SKU behavior, customer promises, supplier reliability, and warehouse constraints. In addition, businesses that operate both direct-to-consumer and wholesale channels must reconcile shared inventory.
10.1 Apparel, Furniture, and Sporting Goods Forecasting
In apparel, a strong category forecast can conceal shortages by size and color. Therefore, compare demand by account and variant before bulk purchasing. Meanwhile, furniture distributors must factor in long replenishment cycles and bulky warehouse space. As a result, item timing matters as much as aggregate demand.
Sporting goods introduce another challenge: seasonal and event-driven spikes. Consequently, planners should distinguish repeat purchases from one-time promotions. The industries served by Xorosoft include several inventory-driven sectors with these planning needs.
10.2 SKU-Level Forecasting for Food, Parts, and Manufacturing
Food distributors must account for expiry dates and usable shelf life. Therefore, stock that exists physically may not be suitable for a later customer delivery. By contrast, industrial spare parts often have intermittent demand, making service risk more important than an attractive overall accuracy number.
Manufacturers also need to translate finished-product forecasts into components and production requirements. Consequently, purchasing must connect demand timing with bills of materials and supplier capacity. For real implementation narratives, the Xorosoft case studies can offer useful operational context, although individual outcomes should not be generalized.
11. When to Upgrade Customer-Level Demand Forecasting
Not every distributor needs advanced AI immediately. However, the cost of disconnected planning increases as SKUs, accounts, warehouses, and sales channels expand. Therefore, upgrade decisions should follow measured process failures rather than a universal revenue or SKU threshold.
11.1 Recognize the Warning Signs
First, look for frequent customer and SKU forecast disagreements. Next, examine emergency purchases, overselling, spreadsheet overrides, slow inventory reconciliation, and rising aged stock. Moreover, ask whether planners spend more time repairing reports than making purchasing decisions.
If a basic forecast already achieves adequate service at reasonable cost, advanced AI may not be necessary. Instead, improve master data and inventory accuracy first. However, when exceptions recur despite clean data, a more connected planning system deserves evaluation.
11.2 Run a Controlled 90-Day Forecasting Pilot
Days 1–30: First, select representative accounts and SKUs, map data ownership, clean known order duplicates, and establish baseline accuracy and service metrics.
Days 31–60: Next, run rolling historical tests across shortlisted methods. Also, compare vendor forecasts with a simple baseline and review the reasons for planner overrides.
Days 61–90: Finally, test purchasing recommendations, warehouse allocation, and human approvals in a controlled setting. Therefore, the final decision rests on actual operational improvements. This is an illustrative evaluation schedule, not a guaranteed implementation timeline.
12. Conclusion: Choose Forecasting That Improves Buying Decisions
Customer-level demand forecasting helps distributors anticipate account demand. However, SKU-level and location-level views determine what to buy and where to position stock. Therefore, the strongest forecasting approach reconciles those views and proves its value through measurable purchasing outcomes.
Rather than choosing the tool with the boldest AI claim, compare the seven tests, demand-quality controls, and total operating cost. In addition, verify how the proposed system supports your existing customer commitments and warehouse workflows.
For distributors ready to assess connected ERP operations, Xorosoft offers an option worth examining. Book a personalized demo to review your inventory, purchasing, warehouse, and forecasting requirements with the team.
Frequently Asked Questions
What is customer-level demand forecasting?
Customer-level demand forecasting predicts purchasing by individual account over a chosen period. Therefore, distributors can plan customer commitments, recognize ordering cycles, and anticipate account-specific demand. However, SKU and warehouse detail remains necessary for accurate replenishment.
How is SKU-level forecasting different?
SKU-level forecasting predicts demand for each item, including variants. By contrast, a customer forecast predicts account demand. Therefore, combining both views helps buyers prepare the right products for the right customers.
Do wholesalers need customer and SKU forecasts?
Not always. However, wholesalers with large accounts, varied product mixes, or committed allocations often need both. Consequently, the appropriate detail depends on the purchasing and service decisions the business makes.
How do you test AI forecast accuracy?
First, use the same historical data and forecast horizons for every vendor. Then compare out-of-sample errors, bias, and inventory outcomes. Moreover, examine customer and SKU results rather than one aggregate score.
Can AI forecast slow-moving SKUs?
Yes, but sparse history makes predictions less certain. Therefore, compare intermittent-demand methods with simple baselines. In addition, track stockout risk and service needs instead of relying only on average forecast accuracy.
Is ERP forecasting better than standalone AI?
Neither is always better. ERP forecasting may simplify purchasing and inventory execution, while specialist tools may offer deeper modeling. Therefore, compare proven accuracy, integration effort, data ownership, and total operating cost.
When should a distributor upgrade forecasting software?
Upgrade when stockouts, excess inventory, manual overrides, or conflicting forecasts create measurable costs. First, correct data issues. Then test whether new forecasting software improves purchasing and service beyond the current process.
Recent Posts
-
 Purchase Order Automation Software for Multi-Channel Inventory Businesses
-
 B2B Order Risk Detection: How AI Agents Flag Risky Orders
-
 Why 3PL Fulfillment Statuses Fail to Match Customer Promises
-
 ERP Selection Case Study: How an Ecommerce Brand Rejected the Wrong ERP
-
 Inventory Tracking Management: How to Correct Negative Stock, Duplicate Receipts, and Orphaned Reservations