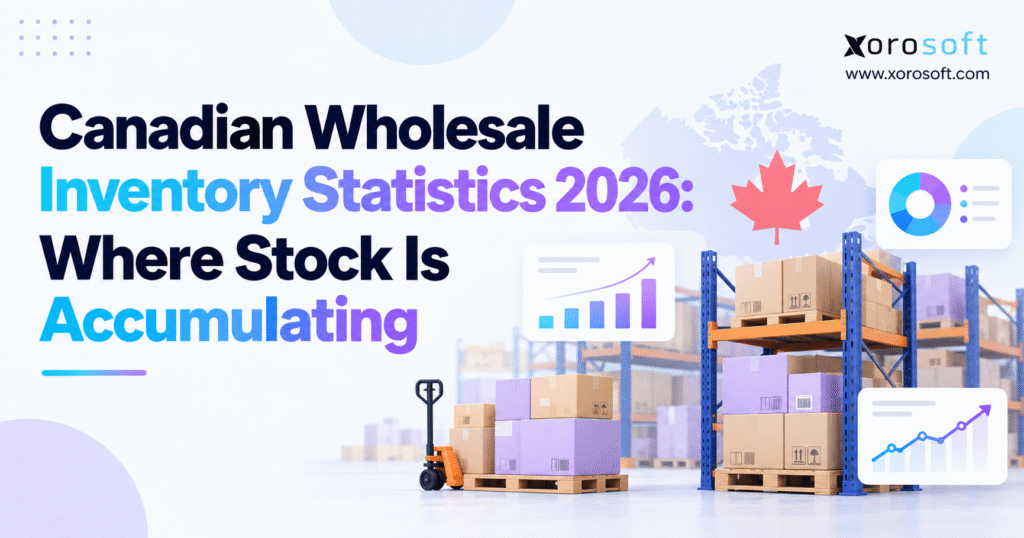
This article provides an overview of the latest Canadian wholesale inventory statistics.
1. Why Canadian Wholesale Inventory Levels Matter Before the Next Buying Cycle
Canadian wholesalers are carrying more inventory value than they did a year ago, but the increase is not spread evenly across industries. Some categories are building stock, others are drawing it down, and the largest inventory holders are not necessarily the fastest-growing ones. For a distributor deciding what to buy next, that difference matters more than a single national headline.
The latest complete Canadian wholesale inventory statistics available on October 8, 2026, cover July. They show C$140.645 billion in headline wholesale inventories, broadly unchanged from June but 5.5% higher than July 2025. Machinery and equipment wholesalers account for the largest share. Building materials and motor vehicle wholesalers, meanwhile, reported notable monthly increases. These are inventory values, not a count of products sitting on warehouse shelves.
1.1 The Business Decision Behind Canadian Wholesale Stock Levels
A higher stock balance is not automatically a warning sign. A distributor might be supporting new customers, preparing for a seasonal peak, or carrying additional safety stock against unreliable lead times. Equally, unsold products can accumulate when forecasts exceed demand, overlapping purchase orders arrive, or a sales channel slows unexpectedly. The same accounting movement can have very different operational explanations.
Canadian wholesale inventory statistics are most useful when treated as a starting point for investigation. They can identify which sectors deserve attention and whether inventories are changing alongside sales. They cannot tell a company which sizes, models, parts, or warehouse locations are consuming unnecessary working capital. That requires the company’s own transaction and demand records.
1.2 How to Interpret Wholesale Inventory Trends Without Overstating Risk
This article examines the July 2026 inventory baseline, sector concentrations, monthly and annual stock changes, inventory-to-sales trends, and the decisions Canadian distributors can make using those observations. It also explains practical measures for inventory age, turnover, replenishment, and warehouse availability. The goal is to connect public economic statistics with the choices made in purchasing and operations meetings.
The analysis does not treat national stock growth as proof of an inventory crisis. Nor does it present preliminary August sales estimates as completed August inventory data. Those boundaries matter because inaccurate comparisons can lead businesses to cut essential stock in one area while leaving genuinely slow-moving inventory untouched elsewhere.
2. Canadian Wholesale Inventory Statistics: The July 2026 Baseline
2.1 Canadian Wholesale Inventory Statistics: July’s Key Figures
According to Statistics Canada’s July 2026 wholesale trade release, headline wholesale inventories totalled C$140.645 billion in July, compared with C$140.656 billion in June. The monthly movement was effectively zero after rounding. A year earlier, the comparable inventory figure was C$133.326 billion. That puts the year-over-year increase at roughly C$7.3 billion, or 5.5%.
The figures are seasonally adjusted and expressed in current Canadian dollars. This makes them useful for observing reported inventory investment, although the number is not a direct measure of unit volume or warehouse capacity. A rise in the cost of replacing goods can affect inventory value even when the number of boxes, pallets, or units changes little.
2.2 What Canada’s Wholesale Inventory Data Includes and Excludes
The headline series excludes petroleum, petroleum products and other hydrocarbons, as well as oilseed and grain. The broader Statistics Canada industry table includes additional inventory categories and shows an overall total of C$154.995 billion for July. Both figures are valid in their respective coverage definitions, but mixing them creates a misleading comparison. This article consistently uses the narrower C$140.645 billion headline series for national comparisons.
The Monthly Wholesale Trade Survey data quality statement describes inventories as the book value of goods owned at month-end and intended for resale. That includes qualifying stock in warehouses, selling outlets, transit, and consignment to other businesses. It can also include inventory owned outside Canada. Consequently, the figures should not be described as a physical census of goods currently stored in Canadian buildings.
2.3 Why Reference Dates and Statistical Revisions Matter
The July results were released on September 15, 2026, and are subject to the normal revision process. The next complete release, covering August wholesale trade, is scheduled for October 15, 2026. Businesses publishing or presenting a 2026 inventory analysis should state both the reference month and the publication date rather than describe July as the condition of every warehouse in October.
Canadian wholesale inventory statistics can support a trend discussion, but a fair comparison needs matching periods, consistent coverage, and comparable measures. A July-to-July inventory change is different from June-to-July movement. Sales measured in dollars also differ from inflation-adjusted sales volumes. Small methodological details can materially change the story management takes from the data.
3. Canadian Wholesale Inventory Statistics by Industry: Where Stock Is Concentrated
3.1 Canadian Wholesale Inventory by Sector: Ranking the Largest Holders
The detailed wholesale inventories by industry table shows a clear concentration of inventory value in machinery, building materials, personal and household goods, and automotive distribution. All figures below refer to July 2026, use seasonally adjusted current-dollar values, and apply the same exclusions as the headline series.
| Wholesale subsector | Inventory, C$ billions | Monthly change | Annual change |
|---|---|---|---|
| Machinery, equipment and supplies | 42.59 | -0.2% | +6.9% |
| Building materials and supplies | 24.81 | +2.2% | +5.5% |
| Personal and household goods | 22.48 | -1.7% | +4.3% |
| Motor vehicles and parts | 18.57 | +1.5% | +5.2% |
| Food, beverage and tobacco | 16.01 | -0.9% | +8.6% |
| Miscellaneous wholesale | 15.77 | -1.1% | +0.8% |
| Farm products excluding oilseed and grain | 0.41 | +0.1% | +9.5% |
These balances show where stock value sits, but not where excess inventory exists. A business selling expensive industrial equipment naturally holds different inventory values from a business distributing inexpensive, frequently replenished consumables. Similarly, a sector with a large inventory pool can show declining monthly stock while a smaller group expands rapidly.
3.2 Machinery Wholesale Inventory: Why It Leads the Ranking
Machinery, equipment and supplies wholesalers held approximately C$42.59 billion, the largest balance of any headline subsector. Their inventory fell 0.2% in July yet remained 6.9% above the previous year’s level. The category covers equipment and supplies with widely different prices, replacement patterns, and lead times. That diversity explains why its overall inventory balance cannot serve as a universal target for an individual machinery distributor.
Expensive machines, specialized replacement parts, and long procurement cycles can require substantial planned stock investment. At the same time, a small number of slow-moving, high-value items may dominate working capital. The useful next question is which products support confirmed orders or expected service requirements, and which are sitting idle without a credible demand forecast.
3.3 Building Materials, Consumer Goods and Automotive Stock Levels
Building materials and supplies wholesalers held C$24.81 billion, followed by personal and household goods at C$22.48 billion and motor vehicles and parts at C$18.57 billion. These categories share a need for precise purchasing decisions, but their operating risks differ. Building products may follow project schedules; consumer goods can shift with fashion or promotion cycles; automotive parts may have long product tails and specific compatibility requirements.
The distinction between concentration and growth is especially visible here. Personal and household goods inventory declined in July despite holding more stock value than motor vehicle wholesalers. Building materials and automotive distribution increased during the month. A management team that simply ranks inventory balances could overlook that directional difference.
4. Canadian Wholesale Inventory Statistics: Where Stock Is Accumulating Fastest
4.1 Monthly Wholesale Inventory Growth: Which Sectors Increased?
Among the major subsectors, building materials and supplies posted the strongest July monthly inventory growth, increasing 2.2%. Within that category, lumber, millwork, hardware and other building supplies rose 2.5%. Motor vehicles and parts followed with a 1.5% rise. These movements provide a clearer short-term accumulation signal than the nearly flat national headline.
Yet stock growth must be read alongside demand. Building materials wholesale sales increased 3.5% in July. Therefore, an increase in inventory did not occur in isolation from sales activity. Some businesses may have been replenishing stock to serve stronger orders. Others may still have accumulated unwanted products. The sector data do not establish which explanation applies to a specific company.
4.2 Annual Canadian Wholesale Inventory Growth: Industry Leaders
Several narrower industry groups stand out when July 2026 is compared with July 2025. Textile, clothing and footwear inventory values rose 21.1% year over year. Computer and communications equipment increased 18.9%, while farm, lawn and garden machinery climbed 17.7%. Those increases warrant investigation, particularly where products can become obsolete, seasonal, or costly to store.
Annual growth is not the same as recent momentum. Textile, clothing and footwear inventory declined 3.3% in July itself, even with its elevated year-over-year position. Farm, lawn and garden machinery increased 1.5% during July. These mixed results help explain why a useful inventory discussion needs both time horizons rather than a single list of sectors labelled as overstocked.
4.3 Why Declining Wholesale Inventories Do Not Guarantee Better Performance
Four major subsectors recorded July declines: personal and household goods fell 1.7%; miscellaneous wholesale declined 1.1%; food, beverage and tobacco fell 0.9%; and machinery, equipment and supplies declined 0.2%. These movements offset growth elsewhere and helped keep the national total broadly stable.
However, falling inventory value can mean different things. A company might be successfully clearing aged goods, experiencing stronger demand, buying less, or facing shortages it cannot immediately replenish. Without product-level sales, fill rates, margins, and open order data, a declining stock balance is not automatically evidence of healthier operations. Canadian wholesale inventory statistics identify movement; operational records explain its consequences.
5. Canadian Wholesale Inventory Statistics Versus Sales: Reading the Gap
5.1 What Canadian Wholesale Inventory Statistics Reveal About Sales Growth
No, not at the headline level in July. Canadian wholesale sales increased 0.3% from June to C$93.1 billion, while inventories were essentially unchanged. Sales were also 7.9% above July 2025, compared with 5.5% annual inventory growth. On both of those like-for-like current-dollar comparisons, wholesale sales grew faster than the value of inventory.
That point is important because broad claims that Canadian wholesalers are accumulating stock faster than they sell are not supported by the July national figures. The real story is uneven distribution across sectors and product groups. Furthermore, sales volumes fell 0.6% during July even though nominal sales rose, illustrating how prices and physical quantities can produce different signals.
5.2 Canada’s Wholesale Inventory-to-Sales Ratio of 1.51
Statistics Canada’s inventory-to-sales ratio eased from 1.52 in June to 1.51 in July. It compares the stock value held at a point in time with the current monthly sales rate. At unchanged sales, the national ratio represents approximately 1.51 months of inventory. It is a useful indicator of the relationship between stock and turnover in the wholesale sector as a whole.
The calculation is straightforward: divide period-end inventory value by sales during the month. Using the rounded July figures produces approximately 140.645 divided by 93.1, or 1.51. However, this is not the same as days inventory outstanding, which normally compares average inventory with cost of goods sold. Nor is 1.51 an appropriate target for every product or distributor. A food wholesaler and a specialized equipment supplier face different requirements.
5.3 August’s Advance Wholesale Sales Indicator Is Not Inventory Data
The August 2026 advance wholesale trade indicator estimated a 1.5% monthly decline in wholesale sales. Statistics Canada attributed much of the estimated weakness to agricultural supplies and motor vehicles and parts. The estimate was preliminary, based on an incomplete response set, and subject to a higher revision rate than a regular monthly release.
Crucially, the advance indicator did not provide an August inventory total. It would therefore be misleading to use it as proof that stock accumulated during August. A sensible monitoring plan waits for the complete October 15 release, then compares inventories, sales and the inventory-to-sales ratio using the same coverage and reference month.
6. Why Canadian Wholesale Stock Value Can Rise Without Excess Inventory
6.1 Higher Replacement Costs and a Changing Product Mix
Inventory in the national release is measured at book value, not by counting cases or pallet positions. If the cost of replenishing a product increases, inventory value can rise even when unit holdings remain unchanged. The mix matters as well: replacing lower-priced goods with higher-priced equipment can increase the reported stock balance without increasing the amount of physical space used.
This distinction is particularly relevant to importers and industrial distributors, where product acquisition costs, freight, duties and currency movements may affect landed costs. However, these are potential explanations for individual companies, not proven causes of July’s national inventory figures. A responsible internal review compares quantities, unit costs and mix changes before assigning a problem to purchasing.
6.2 Seasonal Wholesale Stock Versus Ageing Inventory
Many wholesalers buy ahead of predictable demand peaks. Apparel businesses prepare for seasonal collections; sporting goods sellers buy before major selling periods; and building materials distributors may plan around project schedules. In these cases, inventory rises deliberately before sales occur. The relevant test is whether the units are still expected to sell within a reasonable period.
Ageing stock is different. Products that repeatedly miss forecasts, accumulate across seasons, or require steep markdowns may be consuming cash without protecting service levels. Managers should compare the age of each SKU with its normal sales cycle, future orders, return restrictions and supplier terms. A blanket rule based only on 90 days in storage can misclassify legitimate service parts and seasonal products.
6.3 Supplier Lead Times, Purchase Commitments and Duplicate Orders
Wholesalers often buy early because suppliers require long lead times or minimum order quantities. Problems arise when the purchasing team cannot see confirmed inbound stock or when separate locations reorder the same product independently. Several purchase orders can then arrive before the existing inventory has sold, creating a short-term pileup that was avoidable with better coordination.
The key question in Canadian wholesale inventory statistics is where inventory is changing; the purchasing question is whether existing and incoming units can serve credible demand. The solution is not necessarily lower purchasing across the board. An indiscriminate cut can increase stockouts on fast sellers while doing little to remove slow stock. Buyers need a view of usable on-hand units, customer allocations, scheduled receipts, supplier reliability and expected demand. These measures turn a national economic trend into specific purchasing decisions that a business can defend.
7. Canadian Wholesale Inventory Trends Across Product Industries
7.1 Apparel, Footwear and Sporting Goods Wholesale Inventory Trends
Apparel distributors should view the 21.1% annual increase in textile, clothing and footwear inventories as a prompt for closer analysis, not as a prediction about their own company. Styles, sizes, colours and seasonal collections behave differently. A wholesaler may have ample stock in aggregate while repeatedly running out of popular sizes and holding months of unpopular variants.
Sporting goods create similar timing challenges. A product may have a short selling window, yet purchase commitments were made months before the season. Effective management requires demand views by style, colour, size and channel, together with plans for markdowns or transfers once the selling period changes. These details matter more than applying a national percentage to every product category.
7.2 Building Materials, Furniture and Industrial Stock by Warehouse
Building materials wholesalers showed notable monthly inventory growth in July. For an individual distributor, that calls for comparing incoming goods with project orders, customer schedules and storage requirements. Bulky furniture presents a related issue: a warehouse may be full by floor area even when its accounting inventory value appears modest relative to higher-priced categories.
Industrial suppliers face yet another trade-off. Holding replacement equipment and repair parts can protect customer uptime, while redundant high-value machines may tie up substantial cash. Industry-specific operating practices should guide these decisions. A useful starting point is to examine ERP needs across product-based industries and translate general capabilities into the actual stocking rules of the business.
7.3 Food, Beverage and Automotive Inventory Service Requirements
Food and beverage wholesalers reported C$16.01 billion in July inventories, down 0.9% monthly but up 8.6% annually. Perishable stock raises concerns about expiry, lot rotation, temperature control and recall traceability. The same quantity that provides healthy coverage for a shelf-stable product may create unacceptable waste risk for a short-life item.
Automotive parts distributors, meanwhile, balance rapid-moving common parts with specialized items that sell infrequently. Inventory planning must account for fitment, substitute parts, supplier availability and customer urgency. As a result, stock policy should distinguish essential service items from obsolete or superseded parts. The sector’s 1.5% monthly rise is a reason to review those policies, not a verdict on whether automotive inventory is excessive.
8. Wholesale Inventory Management Metrics That Reveal Overstock Risk
8.1 Inventory Turnover and Days Inventory Outstanding
Inventory turnover is calculated as cost of goods sold divided by average inventory value over a matching period. If a distributor has C$12 million in annual cost of goods sold and an average inventory balance of C$3 million, its turnover is four times a year. Days inventory outstanding equals average inventory divided by annual cost of goods sold, multiplied by 365. In this hypothetical example, that is about 91 days.
These measures help evaluate working capital efficiency, but neither should be confused with the national inventory-to-sales ratio. Their denominators differ, and their business uses differ. A useful review calculates turnover by product category and compares each category with its own history. That reveals whether a weak result reflects an established slow-moving line or a sudden deterioration.
8.2 Wholesale Inventory Ageing and Sell-Through by SKU
Ageing reports group stock by how long it has remained unsold or in its current inventory state. While Canadian wholesale inventory statistics reveal broad sector movements, an ageing report identifies the particular SKUs behind a company’s own stock risk. Common bands include 0–30, 31–60, 61–90 and more than 90 days, although the right thresholds depend on product type. The report becomes more useful when combined with quantity, value, recent sales, expected demand and purchase orders already committed.
For example, two SKUs can both be 120 days old but deserve different decisions. One might be a required repair component with occasional predictable demand. The other may be a discontinued style with no future orders. Finance also needs to understand whether aged products require valuation adjustments under the business’s accounting policies. Stock age by itself is a warning flag, not a final disposal instruction.
8.3 On-Hand, Available and Committed Inventory Across Warehouses
A warehouse might report 10,000 units on hand while only 6,000 are available for new orders. The difference could include customer reservations, quality holds, damaged items or already allocated stock. Incoming receipts and interwarehouse transfers add another layer. Without these distinctions, a purchasing report may recommend buying goods that are already on the way, or sales may promise inventory that belongs to an existing order.
For multi-location operations, accurate warehouse management workflows help maintain a usable picture of receiving, putaway, movement, picking and shipping. Xorosoft is one example of a platform serving these processes, but the underlying control is universal: every physical movement should produce a reliable transaction record, and the available-to-promise calculation should follow consistent allocation rules.
8.4 Forecast Bias, Purchasing Decisions and Supplier Performance
Forecast accuracy measures the difference between expected and actual demand. Forecast bias reveals whether the business persistently overestimates or underestimates sales. A purchasing team with positive forecast bias may repeatedly order more than customers need, especially when minimum order quantities and long lead times amplify the error. Another business may experience the opposite problem and create recurring shortages.
Review forecast errors by SKU, sales channel and customer segment. Then compare them with supplier delivery reliability, open purchase orders and planned promotions. The exercise often reveals that excess inventory is not one isolated warehouse problem. It is the accumulated result of sales assumptions, supplier constraints and purchasing rules that were never examined together.
9. A 30–60–90 Day Plan to Control Wholesale Stock Accumulation
9.1 Days 1–30: Establish Accurate Inventory and Ageing Data
The first month should focus on reconciling records rather than buying software or launching broad markdowns. Identify the highest-value SKUs, reconcile physical quantities with recorded balances, and investigate material adjustments. Finance and warehouse teams should agree on how damaged stock, returns, in-transit goods and customer-owned goods are represented in reports.
Next, sort inventory by value, sales velocity and age. Review items that combine high investment with weak recent demand. Keep confirmed customer commitments visible so a slow-moving product that has an upcoming contracted order is not mistaken for dead stock. By the end of this phase, the business should have a small, defensible list of products requiring purchasing or commercial action.
9.2 Days 31–60: Align Replenishment With Wholesale Demand
Once data is more dependable, purchasing can revise reorder points, lead-time assumptions and minimum stock targets for the problem categories. Open purchase orders deserve particular attention. Buyers should verify which commitments can be rescheduled, consolidated or redirected without breaching supplier agreements or leaving customers exposed to shortages.
The strongest processes connect supplier lead times, forecast demand and usable inventory rather than treating every reorder alert as an instruction to buy. Xorosoft provides an integrated purchasing and inventory approach, but businesses can apply the same discipline within an existing system if the data, ownership and approval controls are sound. Track exceptions weekly, including duplicate orders, unexpected receipts and products repeatedly purchased despite ageing balances.
9.3 Days 61–90: Reconcile Inventory Across Channels and Finance
The final month should test whether sales, purchasing, warehouse operations and accounting describe the same stock position. Compare fulfilment exceptions with ledger adjustments. Review transfers that are recorded late, returns that remain in limbo, and customer allocations that are not released promptly. Then set an ongoing monthly review involving purchasing, operations and finance.
A more connected operating model can reduce the need to reconstruct reports from separate files. This is where platforms such as Xorosoft may warrant investigation, particularly when several warehouses and sales channels share inventory. Nevertheless, technology should follow agreed definitions for stock status, transaction ownership and financial reconciliation. Without those foundations, automation can make inaccurate data move faster rather than make it correct.
10. When Canadian Wholesale Inventory Complexity Calls for Connected ERP
10.1 Inventory Process Problems Versus Software Limitations
Not every Canadian distributor needs a new ERP because inventory values have increased nationally. A company with one warehouse, a manageable catalog and reliable integrations may solve problems through better counting, disciplined purchasing and clearer reporting. Replacing software before correcting item masters, units of measure and stock ownership can introduce new errors without addressing the original cause.
An upgrade becomes more relevant when manual reconciliation is routine, buyers cannot trust incoming-stock records, finance receives delayed adjustments, or several channels allocate the same items independently. At that point, evaluation should start with specific scenarios: a partial supplier receipt, a damaged return, a transfer between locations, a customer reservation, and the resulting accounting entries. Systems should be judged on how those scenarios actually work.
10.2 Shopify, Amazon, Wholesale and EDI Inventory Synchronization
A distributor selling through Shopify, Amazon, B2B accounts and EDI partners must prevent the same stock from being promised twice. That requires clear decisions about which system owns available-to-promise quantities, how quickly orders reserve stock, and how cancellations and returns release it. It also requires a practical contingency plan when integrations fail or arrive out of sequence.
The available ecommerce and EDI integrations should be assessed in the context of these transaction rules, not just by counting supported logos. The Xorosoft ERP listing in the Shopify App Store provides one further reference for merchants evaluating how an ERP connects with their storefront. Buyers should still test order edits, partial fulfilment, returns and financial reconciliation before relying on any integration in production.
10.3 Compare ERP Systems Using Real Inventory Workflows
Integrated ERP brings inventory, purchasing, order management, warehouse operations and accounting closer together. The potential value is less manual reconciliation and a consistent operational record, not a guaranteed reduction in stock. A cloud ERP platform for inventory-led businesses may make sense when the company has outgrown disconnected tools. For more complex requirements, evaluate the scope of ERP operations and reporting against actual transaction volumes and implementation resources.
Shortlist decisions should include product demonstrations, realistic implementation costs, data migration, staff training, and ownership of integrations. Comparing alternatives such as NetSuite, Acumatica or Business Central is reasonable; a NetSuite comparison resource can inform questions, but should not replace independent vendor evaluation. Reviewing customer examples by industry can help identify suitable scenarios to ask about without treating any case study as proof that similar outcomes are guaranteed.
10.4 AI Inventory Reporting Requires Verifiable Operational Data
Natural-language analytics can make inventory questions easier to ask, especially when managers want to know which products tie up capital or which warehouses have stock reserved for orders. The AI and ERP connectivity approach is relevant to that direction. Xorosoft describes permission-aware access to operational data, which should be assessed for security, accuracy and auditability before use.
An AI-generated answer is only as trustworthy as its underlying transactions and definitions. Teams still need to reconcile the figures, control user permissions and confirm that a recommendation does not ignore contractual orders or physical warehouse constraints. The objective is faster access to evidence, not replacing the people accountable for inventory decisions.
11. Turn Canadian Wholesale Inventory Trends Into Better Buying Decisions
11.1 Three Questions for Every Canadian Wholesale Inventory Review
Canadian wholesale inventory statistics show that July 2026 was a period of overall stability with meaningful sector-level differences. The national inventory value was 5.5% higher than a year earlier, while monthly stock growth was concentrated in selected subsectors. These facts provide context, not an automatic purchasing instruction. Each business needs to compare its own results with its product mix, demand cycle and customer commitments.
Before the next buying review, management should be able to answer three questions in plain language: Which stock is ageing without credible demand? Which incoming purchase commitments could duplicate existing usable inventory? And which products or locations are at risk of genuine shortages? Answering those questions brings the discussion closer to cash flow and customer service than simply targeting a lower inventory total.
11.2 Make Stock Reviews a Shared Finance and Operations Process
A useful monthly inventory meeting includes purchasing, operations, sales and finance. Purchasing brings supplier commitments and lead times; operations brings physical accuracy and available stock; sales brings forward demand; finance brings valuation, margin and working capital. Where figures disagree, assign an owner to correct the source transaction rather than masking the difference in a spreadsheet.
The next full Canadian wholesale release is scheduled for October 15, 2026. When it arrives, compare the new inventory and sales figures on a like-for-like basis. Keep separate records for national data and company KPIs so a shift in one does not automatically become an assumed explanation for the other.
11.3 Prioritize the Inventory Improvement That Protects Working Capital
Start with clearer stock definitions, reliable cycle counts and better purchasing decisions. If the current systems can support those controls, an upgrade may not be necessary. If disconnected inventory, warehouse, sales and accounting processes continue to undermine decisions, a more integrated ERP evaluation is reasonable.
For distributors considering that route, Xorosoft can be assessed against real inventory, replenishment, fulfilment and reporting scenarios. To explore the fit, contact the team for a personalized ERP discussion. The right outcome is not simply less inventory. It is stock that supports customer demand, preserves cash and remains visible from purchase order to final shipment.
FAQ
What do Canadian wholesale inventory statistics show for 2026?
In July 2026, headline wholesale inventories reached C$140.645 billion, up 5.5% from July 2025. The series excludes petroleum-related products and oilseed and grain.
Which Canadian wholesale sectors saw inventory rise in July?
Building materials inventories increased 2.2%, while motor vehicles and parts rose 1.5%. Machinery held the largest inventory value, but its monthly balance declined slightly.
Does rising wholesale inventory always mean excess stock?
No. Seasonal buying, higher product costs, and planned replenishment can increase inventory values. Check stock age, sales velocity, and incoming orders before identifying overstock.
What was Canada's wholesale inventory-to-sales ratio in July 2026?
The ratio was 1.51, down from 1.52 in June. It compares national inventory value with monthly wholesale sales, not individual product turnover.
How can distributors identify slow-moving wholesale inventory?
Review SKU aging, inventory turnover, demand forecasts, and confirmed orders. Prioritize high-value stock with weak sell-through and no credible near-term demand.
How can wholesalers reduce unnecessary inventory accumulation?
Reconcile stock records, review open purchase orders, adjust reorder points, and align purchases with realistic demand. Avoid blanket cuts that might create shortages.
When should a Canadian wholesale distributor consider ERP software?
Consider ERP when disconnected purchasing, warehouse, sales, and accounting records cause recurring errors or delayed reporting. Test real inventory workflows before selecting a system.
Recent Posts
-
 Canadian Wholesale Inventory Statistics 2026: Where Stock Is Accumulating
 -
 B2B Ecommerce Software Solutions for Replacement Parts: Search, Compatibility, Account Pricing, and Reordering
 -
 How to Read ERP Reviews Without Choosing the Wrong System
 -
 Inventory Checking Methods Compared: Barcode Scans, Cycle Counts, Blind Counts, and System Reconciliation
 -
 How a Shopify Wholesaler Unified ACH, EDI, Inventory, and Fulfillment