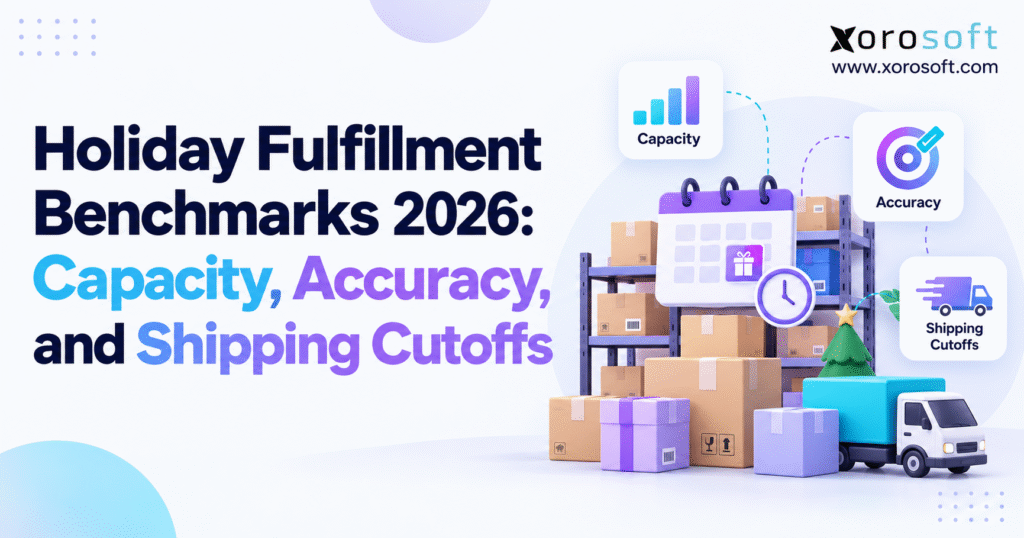
If you want to improve your operations this season, it’s important to understand current holiday fulfillment benchmarks.
1. Peak-Season Pressure Starts Before Holiday Fulfillment Benchmarks Break
Holiday fulfillment problems rarely begin when a parcel misses its promised delivery date. Operational pressure usually appears much earlier.
Orders start arriving faster than teams can release them. Replenishment struggles to keep forward-pick locations stocked. Inventory that appears available online may already be committed to another channel. Meanwhile, packing queues begin growing as carrier collection windows get closer.
That is why holiday fulfillment benchmarks matter more than a revenue forecast alone. Sales forecasts estimate how much a company might sell. Fulfillment benchmarks reveal whether the operation can process that demand without sacrificing accuracy, customer promises, or margin.
Deloitte forecasts U.S. holiday retail sales of $1.70 trillion to $1.71 trillion for November 2026 through January 2027. Ecommerce holiday sales are expected to reach $316.1 billion to $318.9 billion, representing projected growth of 7.5% to 8.4%.
Adobe uses a narrower November-through-December period and forecasts $275.1 billion in U.S. online holiday spending. Cyber Week alone is expected to generate $47.5 billion.
For operators, the important issue is not simply that demand is growing. The bigger challenge is that a large share of that demand can arrive within a very short period.
1.1 Why Average Volume Hides Peak-Season Fulfillment Risk
Suppose a warehouse normally ships 2,000 orders per day and December demand is forecast to average 2,700.
At first glance, that looks like a manageable 35% increase.
A Black Friday promotion might still generate 5,500 orders in one day and another 4,000 the following day. In that situation, the operation is no longer dealing with an average 35% increase. It is dealing with a temporary demand shock affecting nearly every warehouse process.
Picking must accelerate, while replenishment has to keep pick faces stocked. Packing stations must absorb the extra volume, and carrier collections need sufficient space. Inventory commitments across Shopify, Amazon, wholesale, or other channels also have to remain accurate.
Peak-season planning therefore needs to model the busiest days rather than simply the average month.
1.2 Sustainable Capacity Is the Most Useful Warehouse Capacity Benchmark
A warehouse may once have shipped 5,000 orders during an exceptionally busy day.
That does not automatically mean its sustainable capacity is 5,000.
Perhaps the team worked excessive overtime. Accuracy may have deteriorated, or the warehouse could have carried a two-day backlog afterward.
Those results describe maximum output rather than dependable capacity.
The better question is:
How many orders can the operation process repeatedly while maintaining the required accuracy and shipping promise?
That figure becomes one of the most useful holiday fulfillment benchmarks for planning seasonal demand.
2. Holiday Fulfillment Benchmarks Should Measure the Entire Order Flow
Holiday fulfillment benchmarks are operational measures that show whether a warehouse can maintain capacity, accuracy, speed, and delivery performance when seasonal demand rises.
Useful measurement should extend beyond picks per hour.
A strong benchmark framework follows the complete order lifecycle, starting with inventory availability and ending when the parcel is successfully handed to the carrier.
2.1 Core Holiday Fulfillment KPIs to Track
Operations teams should monitor order accuracy, inventory accuracy, order cycle time, on-time shipment, backlog, pick productivity, pack productivity, and capacity utilization.
These measurements interact with one another.
For example, a warehouse could increase picking productivity while accuracy deteriorates. Another operation might preserve excellent accuracy yet accumulate unfinished orders because packing cannot keep pace with picking.
The goal is therefore to measure speed, quality, and remaining capacity together.
| KPI | What It Measures | Peak-Season Warning |
|---|---|---|
| Order accuracy | Correct orders shipped | Errors increase as volume rises |
| Inventory accuracy | Physical stock vs system stock | Availability becomes unreliable |
| Order cycle time | Order release to shipment | Processing time starts increasing |
| On-time shipment | Orders shipped within promise | SLA performance deteriorates |
| Backlog | Open orders awaiting completion | Yesterday’s work carries forward |
| Pick productivity | Picks per labor hour | Productivity falls despite added labor |
| Pack productivity | Parcels packed per labor hour | Packing queues increase |
| Capacity utilization | Actual output vs sustainable capacity | Operating buffer disappears |
2.2 Use Peak Season Fulfillment Benchmarks to Find the Failure Point
Normal-season averages can hide operational weakness.
An operation might maintain 99.8% order accuracy while using 60% of available capacity. Accuracy could fall to 99.6% at 80% utilization and then decline sharply once utilization exceeds 95%.
That pattern matters more than the annual average.
Well-designed peak season fulfillment benchmarks identify the point where service, accuracy, or throughput begins to degrade. Once that threshold becomes visible, managers can add capacity or adjust processes before the operation crosses it.
3. Warehouse Capacity Benchmarks Define Peak-Season Limits
A warehouse should not enter Cyber Week without knowing its approximate sustainable throughput.
Capacity can be measured in orders, lines, units, cartons, pallets, or another meaningful unit of work.
An ecommerce warehouse shipping mostly small consumer orders may focus on orders per hour. A distributor handling large multi-line orders may find order lines or units more useful.
3.1 Calculate Sustainable Peak-Season Capacity
A basic starting formula is:
Daily Fulfillment Capacity = Productive Labor Hours × Sustainable Orders per Labor Hour
Assume 20 employees each provide seven productive warehouse hours and the operation sustainably processes 12 orders per labor hour.
The calculation becomes:
20 × 7 × 12 = 1,680 orders per day
That figure establishes a baseline, but it is not yet the warehouse’s complete capacity.
Receiving, replenishment, equipment downtime, order complexity, packing, shift transitions, and outbound carrier schedules all influence the number that can actually be sustained.
3.2 Warehouse Bottlenecks Define Real Capacity
Every warehouse process has its own throughput limit.
Imagine picking can support 2,500 orders per day, replenishment can support 2,100, packing handles 1,750, and shipping can process 2,000.
In practical terms, capacity is closer to 1,750 daily orders because packing represents the current constraint.
Adding additional pickers would not solve that issue. More picking would simply generate unfinished work faster.
Effective warehouse capacity benchmarks therefore measure the entire flow instead of optimizing one workstation or department in isolation.
3.3 Use Capacity Utilization as a Peak-Season Warning
Capacity utilization can be calculated as:
Capacity Utilization % = Actual Throughput ÷ Sustainable Capacity × 100
If sustainable capacity is 2,000 orders and forecast demand reaches 1,900, utilization equals 95%.
That might look efficient, but the warehouse now has little room for absenteeism, equipment problems, delayed replenishment, unexpected promotions, or larger-than-normal orders.
The correct buffer varies by operation. Even so, resilient peak-season plans do not assume every employee, workstation, and process will run at theoretical maximum every hour.
4. Order Accuracy Benchmarks Must Hold as Holiday Volume Rises
Fast fulfillment creates little value if customers receive the wrong product.
As seasonal volume rises, picking and packing errors can create additional work through returns, replacement shipments, customer support, inventory adjustments, and additional freight.
For that reason, order accuracy belongs inside holiday fulfillment benchmarks rather than being reviewed as a separate quality measure after peak season.
4.1 Measure Order Accuracy Benchmarks Consistently
A straightforward formula is:
Order Accuracy % = Accurate Orders ÷ Total Orders Shipped × 100
If 9,970 out of 10,000 orders ship correctly:
9,970 ÷ 10,000 × 100 = 99.7%
Companies should also define exactly what constitutes an inaccurate order.
Typical errors include the wrong SKU, incorrect color or size, missing items, wrong quantities, damaged products, label mistakes, or packing errors.
Consistent definitions matter because shifting the definition can make performance look better without improving the customer experience.
4.2 Translate Fulfillment Accuracy Into Customer Impact
Percentage-based reporting can hide the size of an operational problem.
| Order Accuracy | Errors per 20,000 Orders |
|---|---|
| 99.0% | 200 |
| 99.5% | 100 |
| 99.8% | 40 |
| 99.9% | 20 |
Instead of debating whether one generic industry benchmark is universally correct, businesses should define an acceptable error budget.
From there, the important question becomes whether error volume increases as peak throughput rises.
4.3 Protect Scanning Controls During Holiday Fulfillment
Teams sometimes bypass barcode validation during busy periods because scanning appears to slow them down.
Short-term picking speed may improve, but downstream error rates can increase.
Barcode workflows become especially valuable when temporary employees are working, overflow storage locations are active, similar SKUs move rapidly, and experienced supervisors have less time to intervene.
Peak demand is therefore the wrong time to remove accuracy controls.
5. Inventory Accuracy Is a Core Holiday Fulfillment KPI
Holiday fulfillment cannot outperform inventory accuracy for long.
If an ecommerce platform promises stock that does not physically exist, the warehouse inherits a problem that faster picking cannot solve.
The risk grows when Shopify, Amazon, wholesale orders, EDI transactions, retail channels, and multiple warehouses compete for the same units.
5.1 Separate On-Hand, Committed, and Available Inventory
Three inventory values should remain distinct.
On-hand inventory represents physical stock owned by the company.
Committed inventory has already been reserved for existing requirements.
Available inventory represents what can still safely be promised.
Publishing on-hand inventory as available inventory can create overselling when multiple sales channels draw from the same pool.
For growing businesses, a connected platform such as XoroONE can provide a common operational foundation across inventory, purchasing, ecommerce, accounting, and related workflows instead of requiring teams to reconcile separate data sources manually.
5.2 Inventory Accuracy Must Sit Inside Holiday Fulfillment Benchmarks
A warehouse could hit every productivity target and still disappoint customers if its inventory availability is unreliable.
For that reason, holiday fulfillment benchmarks should measure inventory adjustments, short picks, unavailable allocations, missing stock, and cycle-count discrepancies.
An increasing short-pick rate can be an early signal that physical inventory and system inventory are drifting apart.
Investigating that pattern early is far less expensive than dealing with widespread cancellations late in December.
5.3 Replenishment Capacity Is a Peak Season Fulfillment Benchmark
Fast picking requires the right inventory to be present in forward-pick locations.
During busy periods, those locations may empty much faster than usual. Reserve stock elsewhere in the warehouse provides little help if the replenishment team cannot move it quickly enough.
Useful measurements include replenishment requests, completion time, empty pick-face events, and picker waiting time.
If the warehouse can technically pick 3,000 orders but replenishment only supports enough inventory for 2,200, effective capacity is closer to the lower figure.
6. Peak-Season Labor Benchmarks Need to Reflect Real Capacity
Holiday fulfillment often leads to additional hiring, overtime, temporary workers, and extended shifts.
Headcount alone, however, is not a meaningful capacity benchmark.
Adding more people can even reduce productivity when aisles become congested or experienced employees spend significant portions of their shifts helping new staff.
6.1 Measure Peak-Season Labor Productivity by Process
Productivity should be measured where work actually occurs.
Picking teams may use picks or order lines per productive hour. Packing can be measured through completed parcels per hour. Receiving may be evaluated by units, cases, or pallets processed.
The goal is not to chase the largest possible number.
Instead, peak-season labor benchmarks should reveal how much dependable capacity each additional labor hour creates.
If ten extra employees produce only five employees’ worth of additional output, management needs to identify the reason before simply hiring another ten.
6.2 Do Not Build Holiday Capacity Around 100% Utilization
An operation running at maximum theoretical utilization has almost no flexibility.
A broken printer, absent employee, damaged pallet, urgent customer order, or delayed inbound shipment can create an immediate queue.
Holiday fulfillment plans need a buffer.
The correct buffer depends on product complexity, automation, employee experience, and demand volatility. Still, sustainable operations rarely depend on every person and workstation performing at maximum output throughout every shift.
7. Black Friday and Cyber Monday Need Peak Season Fulfillment Benchmarks
Monthly demand forecasts are too broad for Cyber Week.
Adobe forecasts U.S. Cyber Week ecommerce spending of $47.5 billion in 2026. Cyber Monday alone is projected to reach $15.1 billion, while Black Friday is expected to reach $12.9 billion.
That concentration changes warehouse planning because demand must be understood by day and, for some operations, by hour.
7.1 Convert Sales Forecasts Into Peak Fulfillment Workload
Revenue forecasts should eventually become warehouse workload forecasts.
A useful planning chain is:
Revenue → Orders → Order Lines → Units → Picks → Cartons → Labor Hours → Carrier Parcels
Consider two promotions that each generate $1 million in sales.
One might involve expensive products with a single item per order. The second could involve low-cost accessories averaging six order lines.
Revenue is identical, but warehouse workload may be dramatically different.
That is why peak season fulfillment benchmarks should use actual order composition rather than revenue alone.
7.2 Stage Promotional Inventory Before Peak Demand
High-velocity promotional SKUs should be positioned where employees can pick them efficiently.
Forward locations need enough capacity to support expected movement. Otherwise, replenishment becomes a hidden bottleneck.
Packing supplies deserve the same attention. Boxes, labels, inserts, tape, mailers, and specialty packaging effectively become operational inventory during peak season.
An available product still cannot ship if the right packaging is missing.
8. Holiday Shipping Cutoffs Belong in Every Fulfillment Benchmark
Carrier deadlines attract substantial attention every December.
Operators need to distinguish, however, between a carrier’s recommended send-by date and their own customer order cutoff.
Those dates should rarely be identical.
8.1 USPS Holiday Shipping Cutoffs for 2026
USPS has published recommended 2026 send-by dates for expected delivery before December 25 in the contiguous United States.
| USPS Service | Recommended Send-By Date |
|---|---|
| Ground Advantage | December 17 |
| First-Class Mail | December 17 |
| Priority Mail | December 18 |
| Priority Mail Express | December 19 |
USPS describes these as recommended dates rather than universal guarantees because delivery can still depend on origin, destination, acceptance time, and other conditions.
A carrier’s published date should therefore serve as an input to the merchant’s cutoff rather than automatically becoming the website promise.
8.2 UPS and FedEx Need Service-Specific Holiday Cutoff Planning
UPS’s 2026 operating calendar shows special service conditions around Christmas Eve and closure for Christmas Day.
Instead of relying on one generic UPS date, ecommerce businesses should calculate transit using the exact origin, destination, service, warehouse schedule, and current carrier guidance.
FedEx introduces an additional variable: seasonal cost.
Its published 2026 demand surcharges become higher during the heaviest peak window. That means shipping decisions affect both service levels and contribution margin.
For operators, holiday shipping cutoffs should therefore be reviewed alongside carrier capacity, parcel cost, and warehouse processing time.
8.3 Cross-Border Shipping Needs More Buffer
Cross-border delivery introduces customs processing, carrier transfers, national holidays, weather exposure, and destination-specific issues.
For U.S.-Canada operations, the domestic holiday cutoff should not simply be copied to Canadian customers.
The safer approach is to build separate delivery rules based on service type, destination, and current transit expectations.
9. Customer Shipping Cutoffs Should Reflect Warehouse Capacity Benchmarks
The safest delivery promise is created by working backward from the customer’s desired arrival date.
A useful formula is:
Customer Order Cutoff = Carrier Send-By Date − Warehouse Processing Time − Operating Risk Buffer
Suppose a carrier requires the shipment on December 18.
If the warehouse needs one full business day for allocation, picking, packing, and staging, while management wants another day of protection, the safer customer order cutoff becomes approximately December 16.
9.1 Build Holiday Shipping Cutoffs by Service and Destination
A nationwide operation should avoid a single universal cutoff when transit times vary significantly.
Cutoff logic can account for destination, fulfillment location, carrier service, order creation time, warehouse calendar, and existing backlog.
A nearby customer may still qualify for economical delivery while a customer across the country requires expedited service.
Dynamic promises are more operationally accurate than one national banner.
9.2 Backlog Should Influence Customer Delivery Promises
Static website cutoffs assume processing time remains constant.
Peak season often proves otherwise.
If normal order processing takes six hours but the current backlog pushes that figure to 24 hours, the customer-facing promise should reflect the new reality.
For this reason, holiday fulfillment benchmarks should be reviewed daily—or more frequently during major promotions—rather than analyzed only after the season ends.
10. Omnichannel Fulfillment Benchmarks Need One Inventory and Order View
Peak demand becomes considerably harder to control when orders arrive through several channels at once.
A company might receive Shopify orders, Amazon transactions, wholesale purchases, EDI orders, marketplace demand, and direct sales during the same hour.
Warehouse teams should not have to decide which spreadsheet or application contains the latest inventory position.
10.1 Order Routing Should Consider Capacity and Inventory Together
A multi-warehouse organization may have the requested inventory at several locations.
The best fulfillment location should consider available stock, shipping distance, warehouse workload, service requirements, and split-shipment risk.
Routing everything to the closest warehouse may overload one building.
Alternatively, routing purely according to inventory availability can create excessive freight costs or unnecessary splits.
Good omnichannel fulfillment balances stock position with operational capacity.
10.2 Shopify Holiday Fulfillment Becomes an Operational System Issue
Shopify can manage the commerce experience, while a growing merchant may still need purchasing, accounting, warehouse execution, wholesale, and multi-channel inventory to remain synchronized behind it.
Xorosoft is available through the Xorosoft ERP listing on the Shopify App Store, providing Shopify merchants with a relevant example of how ERP connectivity can fit into a broader commerce stack.
The larger architecture principle is simple: a Shopify order should not require several teams to manually re-enter the same information across inventory, warehouse, accounting, and purchasing systems.
11. ERP and WMS Support Peak Season Fulfillment Benchmarks Across Departments
Not every holiday fulfillment problem requires new software.
Poor slotting, for example, may simply require process redesign.
Technology becomes more relevant when the constraint comes from disconnected information, repeated manual decisions, or duplicated data entry across departments.
11.1 WMS Supports Warehouse Fulfillment Benchmarks
A warehouse management system typically handles receiving, putaway, locations, replenishment, barcode picking, packing, shipping, transfers, and cycle counting.
For businesses where physical warehouse execution is the primary constraint, XoroWMS provides an example of how warehouse workflows and inventory execution can be brought into a controlled environment.
Consistency is especially important during peak periods.
Temporary and experienced employees should follow the same operational process rather than relying on tribal knowledge.
11.2 ERP Connects Peak Fulfillment With Purchasing and Finance
Warehouse execution is only one part of the operating model.
Purchasing determines whether inventory arrives. Forecasting influences what needs to be purchased. Sales orders determine commitments, while accounting records inventory and fulfillment-related financial activity.
An integrated platform such as XoroERP becomes more relevant when holiday fulfillment benchmarks reveal problems that repeatedly cross inventory, procurement, finance, sales, manufacturing, and warehouse operations.
Optimizing the warehouse alone may improve speed without correcting disconnected upstream data.
11.3 Integration Quality Affects Peak Season Fulfillment Performance
A capable ERP or WMS still depends on reliable integrations.
Orders, inventory, customer information, financial records, shipping updates, and ecommerce transactions may move between several external systems.
Businesses evaluating their technology stack should therefore review Xorosoft integrations or the comparable connectivity offered by another platform.
Peak season is a costly time to discover that inventory updates between two critical systems are delayed or incomplete.
12. Holiday Fulfillment Benchmarks Vary by Industry
A useful benchmark should reflect how the product moves through the business.
Apparel companies managing thousands of size and color variants face different fulfillment risks from furniture companies shipping oversized products.
Similarly, a food distributor handling lot-controlled inventory needs different controls from a sporting-goods merchant processing high parcel volume.
12.1 Apparel and Sporting Goods Need Strong Accuracy Benchmarks
Apparel and sporting-goods operations frequently manage broad SKU catalogs, color and size variants, promotional spikes, and significant return activity.
Visually similar products make scanning and location accuracy especially important.
For these businesses, strong order accuracy benchmarks, inventory synchronization, return processing, and location discipline should receive considerable weight in the peak-season scorecard.
12.2 Furniture Needs Different Warehouse Capacity Benchmarks
Furniture operations may process fewer individual orders yet require much more floor space, staging capacity, handling time, and specialized transportation.
An orders-per-hour benchmark may therefore be misleading.
Cube utilization, dock capacity, staging space, damage rates, and delivery appointment performance can offer better operational insight.
12.3 Wholesale and Manufacturing Need Broader Peak Season Benchmarks
Wholesale distributors may process large orders, account-specific requirements, EDI transactions, case quantities, and customer allocation rules.
Manufacturers can also face component constraints, production scheduling, work-order capacity, and finished-goods availability.
Businesses can review Xorosoft’s industry-specific solutions when considering how ERP and warehouse requirements change across inventory-driven sectors.
The broader lesson is that holiday fulfillment benchmarks should reflect actual operational constraints instead of copying generic ecommerce averages.
13. Cost per Order Belongs in Peak Season Fulfillment Benchmarks
A warehouse can meet its shipping target and still produce an expensive holiday season.
Overtime, temporary staffing, expedited freight, split shipments, demand surcharges, replacement orders, and packaging waste can all reduce the margin created by holiday sales.
13.1 Measure Peak-Season Fulfillment Cost per Order
Normal fulfillment cost per order provides a useful baseline.
Peak cost should then incorporate temporary labor, overtime, premium shipping services, seasonal carrier charges, additional packaging, rework, and replacement freight.
If volume increases 50% but fulfillment cost per order doubles, the business may have technically solved its capacity challenge in an inefficient way.
That difference becomes especially important for low-margin categories.
13.2 Accuracy Errors Create More Than One Fulfillment Cost
An incorrect shipment usually creates several expenses.
The business may pay the original freight, return freight, replacement freight, additional warehouse labor, customer support time, packaging, and inventory adjustment costs.
Customer trust may also suffer.
For that reason, peak season fulfillment benchmarks should connect accuracy with cost instead of treating warehouse errors as isolated operational events.
13.3 Carrier Mix Can Influence Holiday Margin
Carrier planning should happen before peak parcels reach the shipping area.
One carrier may offer an attractive rate but an earlier pickup. Another may provide faster regional service at a higher cost. Oversized products may require an entirely different network.
A good carrier strategy considers delivery requirements, geographic demand, parcel dimensions, warehouse schedules, pickup capacity, and contribution margin.
Emergency carrier decisions made late in December are rarely the cheapest option.
14. Peak-Season Capacity Planning Should Follow a 90-, 60-, and 30-Day Rhythm
Holiday readiness becomes easier when operational decisions are staged instead of compressed into November.
The timeline exists to ensure that decisions requiring long lead times occur while teams still have options.
14.1 Ninety Days Before Peak: Validate Holiday Capacity Benchmarks
Approximately 90 days before the busiest period, operations should compare demand forecasts with sustainable warehouse capacity.
Supplier lead times, inbound inventory, packaging requirements, historical errors, and promotional demand should already be visible.
Major capacity gaps need to be identified at this stage.
If daily demand is expected to reach 4,000 orders while sustainable capacity is 2,800, the difference is too large to solve through last-minute overtime.
14.2 Sixty Days Before Peak: Prepare Inventory and Labor Capacity
Around 60 days before peak, seasonal staffing, training, carrier assumptions, warehouse slotting, and overflow locations should become concrete.
High-velocity products can move into better pick locations. Packaging inventory can be increased, while temporary workers begin learning standard workflows before the busiest weeks.
The purpose is to turn theoretical capacity into tested operating capacity.
14.3 Thirty Days Before Peak: Turn Fulfillment Benchmarks Into Daily Controls
The final month should emphasize validation rather than major redesign.
Inventory discrepancies require attention. Shipping labels and carrier connections need testing, while operational exceptions should be understood by supervisors and floor teams.
Processes for damaged items, short picks, split shipments, order holds, cancellations, and failed carrier labels should already exist before Black Friday.
At this point, holiday fulfillment benchmarks move from planning metrics to daily management tools.
15. Holiday Fulfillment Benchmarks Can Reveal When Systems Need an Upgrade
Seasonal pressure often exposes problems that become less visible once order volume returns to normal.
That does not mean the structural issue has disappeared.
If every holiday season requires more spreadsheets, temporary integrations, manual inventory corrections, and reconciliation work, the business may have outgrown its operating stack.
15.1 System Constraints Often Appear Across Several Departments
Warning signs rarely remain isolated.
Inventory may differ between warehouse and ecommerce systems. Purchasing may still depend on spreadsheets. Employees manually route orders among locations. Finance reconciles transactions long after physical inventory has moved.
At that stage, management should evaluate whether adding another point application will simplify the operation or simply create another integration to maintain.
15.2 Compare ERP Platforms Using Real Peak-Season Workflows
ERP selection should be based on realistic scenarios rather than feature-count comparisons.
A useful software demonstration should show how the system processes a real ecommerce order from capture through allocation, inventory commitment, replenishment, warehouse picking, shipment, returns, and accounting.
Companies considering broader ERP platforms can use a Xorosoft vs NetSuite comparison as one reference point while also evaluating Acumatica, Business Central, Cin7, Brightpearl, Fishbowl, Sage, or other systems against their actual requirements.
Implementation effort, integrations, reporting, user adoption, and total cost matter just as much as individual features.
15.3 Validate Platform Fit With Comparable Operating Examples
Software claims become more useful when they can be tested against businesses with similar operational complexity.
Apparel brands may want evidence involving size and color inventory. Wholesale distributors may prioritize multi-warehouse allocation, purchasing, and EDI.
Xorosoft’s customer case studies offer one place to review examples across inventory-driven sectors.
Relevant operating evidence is more useful than a generic testimonial.
16. Turn Holiday Fulfillment Benchmarks Into an Operating Advantage
The real value of holiday fulfillment benchmarks is not the dashboard created before November.
Their value comes from the decisions they enable as seasonal volume starts increasing.
Operations teams should know sustainable daily throughput, remaining capacity buffer, the point where order accuracy begins to decline, the current backlog, inventory reliability, and the processing time required before carrier handoff.
Together, those measurements provide a much stronger answer to the question: Are we actually ready for peak?
They also show where investment should go.
When packing is the constraint, adding inventory does not solve the problem. If inventory accuracy is unreliable, faster picking cannot correct the promise shown to customers. When warehouse execution is strong but purchasing and ecommerce use different inventory data, the problem extends beyond warehouse productivity.
Businesses operating Shopify, Amazon, wholesale, EDI, manufacturing, or multiple warehouses increasingly need demand, inventory, purchasing, fulfillment, and finance to work from connected information.
Use 2026 performance to establish a clean operational baseline. Record peak daily orders, highest sustainable throughput, accuracy, inventory discrepancies, processing time, backlog, labor cost per order, carrier performance, and reshipment volume.
Those numbers should then become the starting point for 2027 planning instead of forcing the team to begin another holiday season with assumptions.
That is how holiday fulfillment benchmarks move from reporting into operational strategy.
If your peak-season review shows that disconnected inventory, ecommerce, warehouse, purchasing, or accounting workflows are becoming the limiting factor, contact Xorosoft to evaluate what should be addressed before the next capacity increase.
FAQ
What are holiday fulfillment benchmarks?
Holiday fulfillment benchmarks measure capacity, accuracy, backlog, processing speed, inventory reliability, and shipping performance during seasonal demand spikes.
What is a good order accuracy rate during peak season?
A strong target is one the warehouse can sustain as volume rises. Many operations aim above 99% while monitoring error growth.
How do you calculate holiday fulfillment capacity?
Multiply productive labor hours by sustainable orders per labor hour, then adjust for replenishment, packing, staffing, equipment, and carrier constraints.
How should businesses set holiday shipping cutoffs?
Start with the carrier send-by date, then subtract warehouse processing time, non-working days, and a practical operating risk buffer.
Which holiday fulfillment KPIs should be tracked?
Track order accuracy, inventory accuracy, backlog, cycle time, on-time shipping, pick productivity, pack productivity, and capacity utilization.
How can a WMS improve peak-season fulfillment?
A WMS standardizes receiving, replenishment, barcode picking, packing, shipping, transfers, and inventory control during high-volume periods.
When should a business consider ERP for holiday operations?
Consider ERP when fulfillment issues span inventory, purchasing, ecommerce, accounting, manufacturing, or multiple warehouses and require shared operational data.
Recent Posts
-
 Holiday Fulfillment Benchmarks 2026: Capacity, Accuracy, and Shipping Cutoffs
 -
 Inventory and Sales Tracker for Shopify: How to Link Orders, Refunds, Returns, and Stock Changes
 -
 Inventory Audit Readiness: Evidence, Adjustments, Counts, and Reconciliation Controls
 -
 Inventory Management and Tracking vs Warehouse Management: Where Each System Owns Stock Movement
 -
 How a Distributor Reduced Shipping Errors With Pack Station Verification