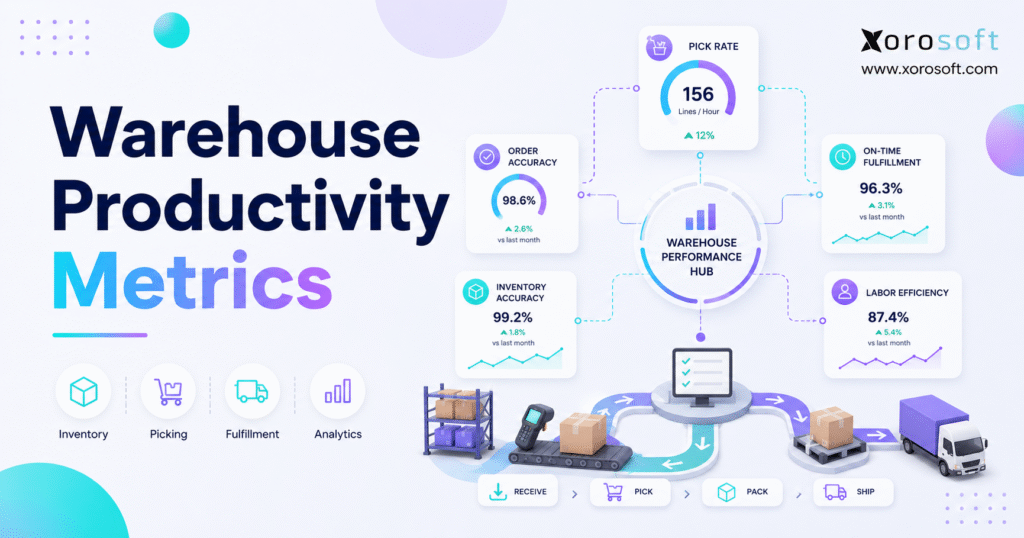
To optimise your facility’s efficiency, it’s crucial to understand and track the right Warehouse Productivity Metrics.
1. Why busy warehouses still lose productivity
Warehouse Productivity Metrics help operators see whether warehouse work is actually becoming faster, cleaner, and more profitable as order volume grows. Because warehouse teams can look busy while still losing time, these metrics separate motion from meaningful output. They show whether labor hours, inventory movement, picking activity, packing work, and shipping performance are creating the results the business needs.
A warehouse usually starts to feel strained before leadership can see the full problem. Orders still ship, yet the team needs more overtime. Stock still moves, although workers spend longer searching for it. Reports still get built, but the numbers arrive too late to fix the issue. As a result, the business grows while the operation becomes harder to control.
In practice, warehouse productivity is not just a floor-level concern. It affects cash flow, purchasing, customer service, accounting, and fulfillment. When inventory records are wrong, buyers reorder too early or too late. When pickers lose time walking inefficient routes, fulfillment cost rises. Once receiving slows down, available stock can sit invisible on the dock.
Therefore, the right warehouse KPIs do more than describe performance. They help leaders find the bottleneck behind the number. Instead of asking whether the team is busy, the better question is whether the warehouse is producing accurate output with the least avoidable friction.
2. What warehouse productivity metrics actually measure
Warehouse productivity metrics are KPIs that measure how efficiently a warehouse receives, stores, picks, packs, ships, returns, and controls inventory. Although each business may use different formulas, the goal is the same: understand speed, accuracy, labor output, cost, capacity, and inventory reliability.
2.1 The five areas every warehouse should measure
Most useful warehouse productivity KPIs fall into five groups:
1. Speed
2. Accuracy
3. Labor output
4. Cost efficiency
5. Inventory movement
Speed shows how quickly work moves through each warehouse stage. Accuracy confirms whether the work was completed correctly. Labor output measures what the team produces per hour. Cost efficiency connects warehouse activity to margin. Inventory movement explains whether stock is flowing cleanly through receiving, putaway, picking, packing, shipping, and returns.
Together, these areas create a practical operating picture. For example, a team may pick quickly but create too many errors. Another warehouse may maintain strong accuracy, yet order cycle time may still be too long. Because one number rarely explains everything, productivity metrics should be reviewed as a connected set.
2.2 Productivity and efficiency are not the same thing
Productivity measures output. For instance, a warehouse may track orders picked per hour, units received per labor hour, cartons packed per shift, or pallets shipped per day.
Efficiency measures the quality and resource cost of that output. A team can pick more orders per hour and still perform poorly if accuracy drops, overtime rises, or rework increases. Conversely, a slower process may be more efficient if it reduces returns, corrections, and customer service issues.
Therefore, warehouse productivity metrics should never reward speed alone. The best KPI programs combine speed, accuracy, cost, and customer impact. That way, managers avoid pushing the warehouse toward faster mistakes.
3. Core warehouse productivity metrics and formulas
A strong dashboard does not need hundreds of numbers. Instead, it needs a focused group of warehouse performance metrics that explain whether the operation is improving or drifting.
3.1 Labor productivity
Labor productivity measures how much warehouse output is created per labor hour.
Formula:
Labor productivity = Total output ÷ Total labor hours
Output can mean orders, order lines, units, cartons, pallets, receipts, transfers, or work order picks. Because warehouses vary, the unit of output should match the business model. Ecommerce teams often use orders or lines. Wholesale teams may use cases or pallets. Manufacturing teams may use material picks or kits.
This KPI matters because labor is one of the most flexible and visible warehouse costs. However, low labor productivity does not always mean employees are working slowly. Often, the cause is poor slotting, unclear task direction, missing inventory, weak scanning discipline, or too much manual entry.
3.2 Pick rate
Pick rate measures how many items, lines, or orders are picked during a period.
Formula:
Pick rate = Total picks ÷ Total picking hours
Because picking often consumes a large share of warehouse labor, pick rate is one of the most important warehouse productivity metrics. Still, pick rate must be paired with accuracy. If the warehouse picks faster but sends the wrong products, the improvement is not real.
In many warehouses, better slotting improves pick rate quickly. Fast-moving SKUs should sit closer to pick paths. Similar items should not be stored side by side without clear labels. Additionally, batch picking, wave picking, barcode scanning, and directed workflows can reduce unnecessary walking.
3.3 Order picking accuracy
Order picking accuracy measures whether the right item, quantity, size, color, lot, serial number, or variant was picked.
Formula:
Order picking accuracy = Accurate picks ÷ Total picks × 100
Accuracy protects margin because every wrong pick creates downstream work. The business may need to process a return, ship a replacement, answer a customer complaint, adjust inventory, and restock the product. For ecommerce brands, Shopify’s order accuracy guidance also connects accurate fulfillment with customer experience and repeat purchase behavior.
As a result, picking accuracy should be visible every day. Managers should review errors by SKU, picker, zone, order type, and shift. Then, they can identify whether the issue is training, labeling, slotting, product similarity, or system validation.
3.4 Order cycle time
Order cycle time measures how long it takes from order receipt to shipment.
Formula:
Order cycle time = Shipment time − Order received time
This metric shows whether the fulfillment engine can keep up with demand. If order cycle time rises, the root cause may be picking delays, packing congestion, missing stock, poor order routing, or missed carrier cutoffs.
For Shopify and ecommerce businesses, order cycle time directly affects customer expectations. Shopify’s inventory management guide explains why accurate inventory data matters across warehousing, fulfillment, and selling channels. Therefore, order cycle time should be reviewed with inventory availability, not in isolation.
3.5 Dock-to-stock cycle time
Dock-to-stock cycle time measures how long it takes for received goods to become available for sale, fulfillment, transfer, or production.
Formula:
Dock-to-stock cycle time = Inventory available time − Receiving arrival time
This KPI reveals whether inbound inventory is moving quickly through receiving, inspection, counting, labeling, system entry, and putaway. Although cartons may physically arrive, the business cannot rely on that stock until the system reflects it accurately.
Long dock-to-stock time creates false stockouts. Sales may think inventory is unavailable, purchasing may reorder too early, and pickers may search for products that have not reached a bin. Consequently, receiving speed has a direct impact on fulfillment performance.
3.6 Inventory accuracy
Inventory accuracy measures how closely system inventory matches physical inventory.
Formula:
Inventory accuracy = Accurate inventory records ÷ Total inventory records × 100
This metric is foundational because poor inventory accuracy damages almost every other KPI. Pickers waste time searching. Buyers purchase from bad data. Customer service gives uncertain answers. Finance struggles with inventory valuation. Meanwhile, ecommerce channels may oversell or undersell.
Inventory accuracy improves when movements are scanned at the point of work. Receiving, putaway, transfers, picking, returns, adjustments, and cycle counts should all update the system quickly. Otherwise, reports become a delayed version of reality.
3.7 Cost per order
Cost per order measures how much warehouse operating cost is required to ship one order.
Formula:
Cost per order = Total warehouse cost ÷ Total orders shipped
Warehouse cost may include labor, packaging, rent, software, supplies, handling, rework, and indirect overhead. Because fulfillment cost can rise quietly, this metric helps leaders see whether growth is becoming more or less profitable.
However, cost per order should be interpreted carefully. A wholesale order may cost more to process than a small ecommerce order, yet it may also carry higher value. Therefore, segmenting cost per order by channel, customer type, warehouse, and order profile usually gives a clearer picture.
3.8 Warehouse throughput
Warehouse throughput measures how much product or work moves through the warehouse during a specific period.
Formula:
Warehouse throughput = Units processed during the period
Throughput can measure units received, orders picked, cartons packed, pallets shipped, or returns processed. During peak season, throughput shows whether the operation can scale without losing control.
Additionally, throughput helps with staffing and capacity planning. If order volume grows but throughput does not, leaders need to determine whether the constraint is labor, space, systems, inventory availability, or process design.
3.9 Capacity utilization
Capacity utilization measures how much warehouse storage capacity is being used.
Formula:
Capacity utilization = Used storage capacity ÷ Total storage capacity × 100
A warehouse that is too empty may waste rent. However, a warehouse that is too full can become slower and less accurate. Workers may need to move pallets repeatedly, search longer, or create temporary locations that never get cleaned up.
Because of that, capacity utilization should be reviewed with pick rate, putaway time, damage rate, and travel time. Full shelves do not always mean efficient space use.
3.10 Perfect order rate
Perfect order rate measures the percentage of orders shipped complete, accurate, on time, undamaged, and with correct documentation.
Formula:
Perfect order rate = Perfect orders ÷ Total orders × 100
This metric connects warehouse execution to customer experience. A perfect order requires inventory accuracy, picking accuracy, packing quality, shipping discipline, and clean documentation. Therefore, it is one of the best summary metrics for leadership.
4. Warehouse productivity metrics and formulas table
| Metric | Formula | What it measures | Why it matters |
|---|---|---|---|
| Labor productivity | Output ÷ labor hours | Work completed per hour | Reveals labor efficiency |
| Pick rate | Picks ÷ picking hours | Picking speed | Impacts fulfillment speed |
| Picking accuracy | Accurate picks ÷ total picks × 100 | Picking quality | Reduces returns and rework |
| Order cycle time | Shipment time − order time | Fulfillment speed | Shapes customer experience |
| Dock-to-stock time | Available time − arrival time | Receiving speed | Improves stock availability |
| Inventory accuracy | Accurate records ÷ total records × 100 | Stock reliability | Supports planning and fulfillment |
| Cost per order | Warehouse cost ÷ orders shipped | Fulfillment cost | Protects margin |
| Throughput | Units processed per period | Operating volume | Supports capacity planning |
| Capacity utilization | Used capacity ÷ total capacity × 100 | Space usage | Improves layout decisions |
| Perfect order rate | Perfect orders ÷ total orders × 100 | End-to-end order quality | Measures service reliability |
5. Warehouse productivity metrics by workflow
Warehouse KPIs become more useful when they are tied to the workflow that owns them. Therefore, receiving, putaway, picking, packing, shipping, and returns should each have a small group of measurable indicators.
5.1 Receiving metrics
Receiving metrics show whether inbound goods are verified and made available quickly.
Useful receiving KPIs include dock-to-stock time, receiving accuracy, supplier discrepancy rate, purchase order match rate, and receipts processed per labor hour. These numbers reveal whether inventory is entering the operation cleanly.
When receiving performs poorly, the impact spreads quickly. Inventory may sit at the dock while sales teams think it is unavailable. In addition, purchasing teams may reorder products that already arrived. Because of that, receiving metrics should be reviewed before blaming fulfillment for every delay.
5.2 Putaway metrics
Putaway metrics show whether received inventory reaches the right location quickly and accurately.
Useful putaway KPIs include putaway cycle time, location accuracy, bin utilization, rehandling rate, and putaway tasks completed per hour. These metrics matter because a misplaced item becomes a future picking problem.
For example, a carton put into the wrong bin may not cause an issue today. However, when a picker needs that item later, the mistake turns into search time, order delay, or inventory adjustment. Therefore, putaway accuracy deserves the same attention as putaway speed.
5.3 Picking metrics
Picking metrics show whether warehouse teams can select products quickly and correctly.
Useful picking KPIs include pick rate, picking accuracy, lines picked per hour, travel time per pick, and pick exceptions. Since picking is usually labor-intensive, small improvements can create meaningful savings.
In practice, the best picking improvements often come from better slotting, clearer labels, barcode validation, and fewer manual pick lists. Additionally, managers should review pick exceptions because exceptions reveal missing stock, unclear locations, incorrect substitutes, and system gaps.
5.4 Packing metrics
Packing metrics show whether orders are packed accurately, safely, and cost-effectively.
Useful packing KPIs include packing speed, packing error rate, packaging cost per order, damage rate, and orders packed per labor hour. These metrics become especially important for apparel, furniture, food, sporting goods, and fragile products because packaging logic can vary widely.
Although packing may appear simple, it often becomes a bottleneck during growth. More SKUs, more order profiles, more channels, and more customer requirements create complexity. Consequently, packing standards should be documented and measured.
5.5 Shipping metrics
Shipping metrics show whether completed orders leave the warehouse on time with correct labels, carriers, and documentation.
Useful shipping KPIs include on-time shipping rate, carrier handoff time, shipping error rate, label correction rate, and missed cutoff rate. These metrics matter because shipping is the last warehouse checkpoint before the customer feels the result.
Even when picking and packing are strong, weak shipping discipline can create late deliveries. Therefore, missed cutoff rate should be visible during daily reviews, especially for high-volume ecommerce and wholesale operations.
5.6 Returns metrics
Returns metrics show whether returned goods are inspected, restocked, repaired, written off, or sent back to suppliers efficiently.
Useful returns KPIs include return processing time, restock accuracy, return reason rate, resellable inventory recovery rate, and refund processing delay. These numbers are particularly important for apparel and ecommerce businesses because returned inventory may still be sellable.
If returns sit unprocessed, available inventory becomes understated. As a result, purchasing may buy more than needed while sellable goods remain invisible. Therefore, return workflows should be part of the warehouse productivity dashboard.
6. How to build a warehouse KPI dashboard
A warehouse KPI dashboard should help managers take action, not just admire numbers. Because daily warehouse work changes quickly, the dashboard should show current exceptions, trend lines, and business impact.
6.1 Daily metrics for warehouse managers
Warehouse managers should review daily numbers such as orders shipped, orders delayed, picks completed, picking errors, labor hours, dock-to-stock delays, and inventory exceptions.
These metrics help supervisors respond quickly. For example, if delayed orders increase before noon, the team can still adjust labor, prioritize orders, or clear a packing bottleneck before carrier cutoff. However, if the same report arrives three days later, it becomes a history lesson.
6.2 Weekly metrics for operations leaders
Operations leaders should review weekly trends such as labor productivity, cost per order, inventory accuracy, warehouse throughput, capacity utilization, error rate by workflow, and backlog.
Weekly reviews provide enough context to spot patterns. For instance, if pick rate improves while picking accuracy declines, the warehouse may be moving too fast without enough validation. Similarly, if throughput rises but overtime rises faster, the process may not be scaling efficiently.
6.3 Monthly metrics for executives
Executives should focus on warehouse metrics that connect to margin, cash flow, customer experience, and scalability.
Important executive metrics include fulfillment cost trend, perfect order rate, inventory discrepancy value, return cost trend, labor cost trend, customer service impact, and warehouse capacity risk.
Because executives rarely need every operational detail, the monthly view should answer a practical question: is warehouse performance improving in a way that supports profitable growth?
7. Problems warehouse productivity metrics reveal
The purpose of measuring warehouse productivity is not to punish teams. Instead, the goal is to identify the operational system behind recurring problems.
7.1 Picking bottlenecks
Picking bottlenecks often appear through low pick rate, delayed orders, increased overtime, or rising pick exceptions.
Common causes include poor SKU slotting, long travel paths, unclear bin locations, similar SKUs stored too closely, manual pick lists, and missing barcode validation. Because these issues hide inside daily activity, managers may assume they need more people when they actually need better workflow design.
This is where a dedicated warehouse system can help. For example, XoroWMS supports warehouse workflows such as receiving, picking, packing, inventory movement, and visibility for inventory-driven businesses.
7.2 Receiving delays
Receiving delays usually appear when dock-to-stock time increases or available inventory lags behind physical receipts.
The cause may be supplier discrepancies, manual purchase order matching, slow quality checks, missing labels, or delayed system updates. Although receiving sits at the front of the warehouse, delays there affect every downstream workflow.
Therefore, warehouse teams should measure receiving separately from fulfillment. Otherwise, a fulfillment problem may actually be an inbound inventory problem.
7.3 Inventory discrepancies
Inventory discrepancies appear when system quantities and physical quantities do not match.
Causes include unscanned movements, manual adjustments, incorrect putaway, picking substitutions, unprocessed returns, and transfer errors. Over time, these discrepancies reduce trust in the system. Then, employees create workarounds, spreadsheets, and side checks that slow the operation even more.
A stronger inventory management foundation can help because warehouse transactions, purchasing, accounting, and reporting need the same stock truth. When that truth is split across systems, productivity metrics become harder to trust.
7.4 Labor planning issues
Labor planning issues show up when productivity varies sharply by day, shift, season, or location.
Sometimes the team is understaffed during peaks. Other times, the warehouse has enough people but poor task assignment. Additionally, order mix can change the labor requirement even when order count looks stable.
For example, 500 single-line ecommerce orders may need a different labor plan than 50 wholesale orders with large case picks. Therefore, labor productivity should be segmented by order profile instead of averaged blindly.
7.5 Disconnected systems
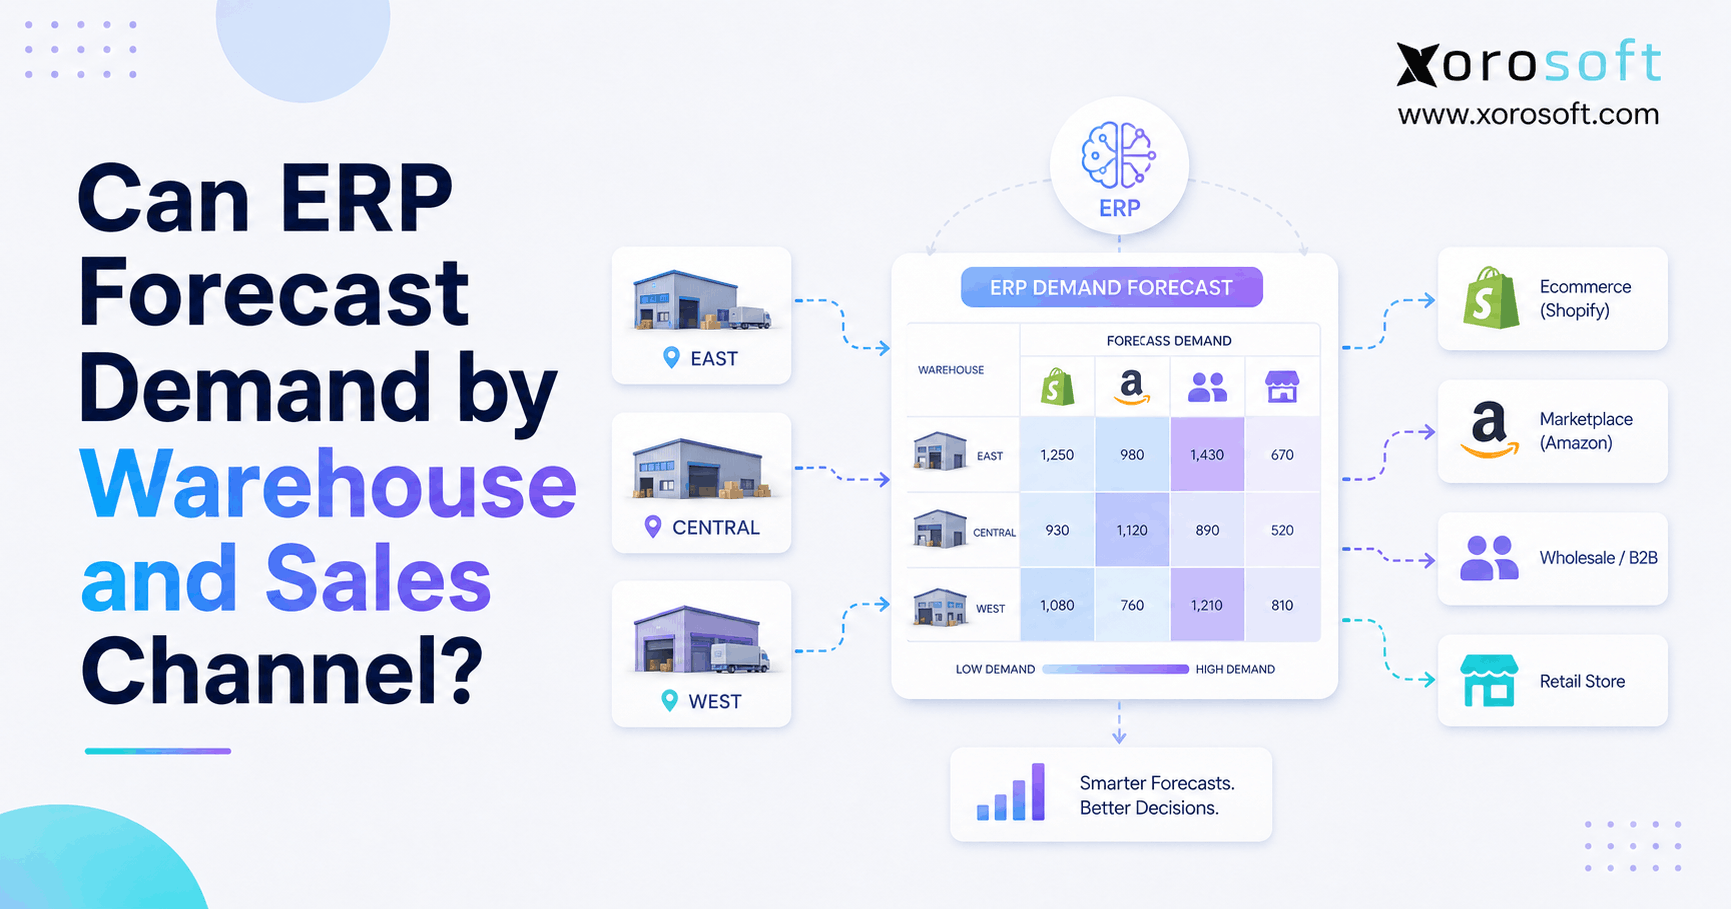
Disconnected systems create productivity blind spots. A warehouse app may show picking activity, while purchasing lives in spreadsheets, accounting lives in QuickBooks, and ecommerce orders come from Shopify, Amazon, wholesale portals, or EDI.
As a result, no team sees the complete operational picture. Warehouse staff know what happened on the floor, but finance may not see the cost quickly. Buyers know what they ordered, yet they may not see receiving exceptions in time. Sales may promise stock that operations cannot find.
For growing companies, a connected cloud ERP platform can bring warehouse, inventory, purchasing, accounting, reporting, and ecommerce data into one operational view.
8. Warehouse productivity metrics by business type
The same warehouse KPI can mean different things depending on the business model. Therefore, ecommerce brands, Shopify merchants, wholesalers, manufacturers, and multi-warehouse operators should prioritize metrics differently.
8.1 Ecommerce warehouse productivity metrics
Ecommerce warehouses should focus on order cycle time, pick-pack-ship speed, order accuracy, on-time shipping rate, return rate, inventory accuracy, and cost per order.
Because ecommerce orders are often small and frequent, walking time and packing flow can drive major productivity differences. In addition, customer expectations make speed and accuracy equally important.
A useful ecommerce dashboard should show delayed orders, missed cutoffs, picking exceptions, and return reasons. That way, managers can connect warehouse execution to customer experience.
8.2 Shopify warehouse productivity metrics
Shopify brands should track inventory sync accuracy, available-to-promise accuracy, Shopify order cycle time, multi-channel fulfillment accuracy, oversell rate, and return reason rate.
This matters because Shopify often becomes one sales channel inside a larger operation. Many growing brands also sell through Amazon, wholesale, retail, marketplaces, or EDI. Therefore, warehouse productivity depends on whether inventory updates across every channel quickly and accurately.
For Shopify merchants evaluating operational systems, Xorosoft is also listed on the Shopify App Store. However, the real decision should be operational: can the system connect warehouse activity with inventory, purchasing, accounting, and fulfillment?
8.3 Wholesale warehouse productivity metrics
Wholesale warehouses should focus on case picking accuracy, pallet picking accuracy, fill rate, EDI order accuracy, allocation accuracy, dock-to-stock time, and customer-specific shipping compliance.
Wholesale errors often cost more because order values are larger and customer requirements are stricter. For example, wrong labels, incorrect cartons, missing documentation, or late EDI updates may create chargebacks or delayed payments.
Because of that, wholesale metrics should measure both productivity and compliance. Speed matters, but accuracy and documentation protect the relationship.
8.4 Manufacturing warehouse productivity metrics
Manufacturing warehouses should track raw material availability, component picking accuracy, work order kit accuracy, production delay rate, finished goods putaway time, and inventory accuracy.
In manufacturing, warehouse productivity affects production continuity. If components are unavailable, production waits. If finished goods are not received quickly, sales and finance lose visibility. Additionally, inaccurate material records can distort purchasing and planning.
For inventory-driven manufacturers, XoroERP can connect warehouse activity with purchasing, accounting, manufacturing, inventory control, and reporting. Therefore, warehouse productivity becomes part of the full operating system rather than a separate warehouse report.
8.5 Multi-warehouse productivity metrics
Multi-warehouse businesses should track location-level inventory accuracy, transfer accuracy, inter-warehouse transfer time, cross-warehouse fulfillment speed, stock allocation accuracy, and fulfillment cost by location.
One warehouse can sometimes operate through local knowledge. However, multi-warehouse operations need shared processes and real-time data. Otherwise, one location may carry excess stock while another location faces stockouts.
Because of that, businesses with multiple warehouses should measure productivity by location and workflow. Then, leadership can identify whether a problem is local, seasonal, channel-specific, or system-wide.
9. Spreadsheets, WMS, and ERP for warehouse productivity tracking
Warehouse productivity tracking usually matures in stages. At first, a spreadsheet may feel sufficient. Later, the business may need a WMS for warehouse execution. Eventually, ERP may become necessary when warehouse data must connect with purchasing, accounting, ecommerce, forecasting, and reporting.
| Capability | Spreadsheets | WMS | ERP |
| Real-time warehouse visibility | Limited | Strong | Strong |
| Barcode scanning | No | Yes | Yes, if warehouse workflows are included |
| Inventory accuracy tracking | Manual | Strong | Strong |
| Purchasing connection | Manual | Limited | Strong |
| Accounting connection | Manual | Limited | Strong |
| Shopify and Amazon connection | Manual | Sometimes | Strong, if integrated |
| Forecasting connection | Manual | Sometimes | Strong |
| Multi-warehouse reporting | Weak | Strong | Strong |
| Executive visibility | Manual | Warehouse-focused | Business-wide |
9.1 When spreadsheets are enough
Spreadsheets may work when a business has low order volume, few SKUs, one warehouse, simple purchasing, and limited fulfillment complexity.
However, spreadsheets become fragile as volume grows. They rely on manual updates, delayed exports, and individual discipline. As a result, teams often spend more time maintaining the tracker than improving the operation.
9.2 When a WMS is enough
A WMS may be enough when the main challenge is warehouse execution. This includes barcode scanning, bin-level tracking, directed picking, putaway control, packing verification, and shipping workflows.
If accounting, purchasing, forecasting, and ecommerce systems are already strong, a standalone WMS can be a practical improvement. Nevertheless, the business still needs clean integrations so warehouse activity updates inventory and financial workflows correctly.
9.3 When ERP becomes necessary
ERP becomes necessary when warehouse productivity metrics need to connect with inventory, purchasing, accounting, ecommerce, wholesale, manufacturing, forecasting, and reporting.
For example, a warehouse manager may see picking delays, but the root cause may be purchasing. A finance team may see margin pressure, but the root cause may be fulfillment rework. A Shopify team may see overselling, while the real issue may be delayed inventory sync.
At this stage, teams usually need a broader operational system. The solutions available across inventory, warehouse management, purchasing, manufacturing, ecommerce operations, and reporting are useful to review when warehouse metrics no longer explain the full business problem.
10. How to improve warehouse productivity metrics
Metrics improve only when they lead to better operating decisions. Therefore, each KPI should connect to a workflow owner, a process change, and a review cadence.
10.1 Standardize warehouse workflows
Start by documenting receiving, putaway, replenishment, picking, packing, shipping, returns, and cycle counting.
Each workflow should define the steps, system updates, exception rules, and ownership. Otherwise, two employees may complete the same task differently, which makes productivity data inconsistent.
Standard workflows also make training easier. In addition, they help managers compare performance across shifts, locations, and seasons.
10.2 Use barcode scanning at the point of work
Barcode scanning improves warehouse productivity because it captures activity when the work happens.
Good scanning workflows can validate receiving, confirm bin-level putaway, verify picks, check packing, track transfers, support cycle counts, and improve lot or serial control. As a result, the system becomes more reliable because fewer transactions depend on memory or end-of-day updates.
However, scanning alone is not enough. Labels, locations, item masters, units of measure, and workflows must be clean. Otherwise, employees will find workarounds and the productivity data will weaken again.
10.3 Improve warehouse slotting
Slotting determines where products live in the warehouse.
To improve slotting, place fast-moving SKUs closer to pick paths, separate visually similar items, keep heavy products in safe locations, review SKU velocity, and adjust locations before seasonal peaks.
Better slotting can reduce walking, improve pick rate, lower fatigue, and reduce picking errors. Therefore, slotting should be reviewed regularly rather than treated as a one-time setup.
10.4 Connect warehouse data with purchasing
Warehouse productivity often depends on purchasing quality.
Late stock arrivals make receiving chaotic. Inaccurate purchase orders force teams to investigate avoidable discrepancies. Poor replenishment planning creates stockouts, substitutions, and urgent warehouse work.
Therefore, warehouse metrics should flow into purchasing decisions. Buyers need to see demand, stock movement, lead times, receiving delays, and supplier discrepancies. When those signals connect, purchasing can support productivity instead of creating warehouse pressure.
10.5 Connect warehouse data with accounting
Warehouse productivity also affects accounting.
Inventory adjustments, damaged stock, returns, landed costs, transfers, and fulfillment costs all influence financial reporting. If warehouse systems and accounting systems are disconnected, finance teams often rely on manual reconciliation.
Because of that, warehouse metrics should not live only inside operations. They should support inventory valuation, margin analysis, month-end close, and cash flow visibility.
10.6 Use real-time reporting
Real-time reporting helps managers identify problems while they can still fix them.
A useful report should show what is delayed, where the delay is happening, which workflow owns the issue, whether the issue is recurring, and how it affects orders or inventory. In addition, reports should highlight exceptions instead of forcing managers to search through raw exports.
Xorosoft’s case studies can be useful for readers who want to see how inventory-driven businesses approach system improvement in practical settings.
11. Common mistakes when tracking warehouse KPIs
Warehouse productivity programs fail when teams measure too much, measure the wrong thing, or ignore the operating context behind the number.
11.1 Tracking too many KPIs
Too many KPIs create noise. A dashboard with 60 numbers may look sophisticated, but it often hides the few metrics that matter.
Instead, start with 8 to 12 core warehouse productivity metrics. Then, add workflow-specific metrics only where problems exist. This keeps the dashboard focused and actionable.
11.2 Measuring speed without accuracy
Speed without accuracy creates expensive mistakes.
A team may increase pick rate by moving faster, skipping validation, or rushing packing. However, if returns and replacements rise, the warehouse did not improve. It simply moved the cost somewhere else.
Therefore, pair speed metrics with accuracy metrics. Pick rate should sit beside picking accuracy. Order cycle time should sit beside perfect order rate. Throughput should sit beside error rate.
11.3 Ignoring labor context
Labor productivity depends on order mix, SKU complexity, layout, training, seasonality, and system quality.
For instance, one shift may pick fewer orders because the orders are larger or require more touches. Another shift may pick more orders but create more errors. Because averages can mislead, labor productivity should be reviewed by channel, order type, zone, and season.
11.4 Using outdated data
Outdated data creates late decisions.
If productivity reports are built from weekly spreadsheet exports, managers may discover problems after orders are already late. Meanwhile, the team keeps operating with the same bottleneck.
As a result, growing warehouses need current visibility. Daily exceptions, live inventory movement, and timely reporting matter more as volume increases.
11.5 Separating warehouse metrics from business metrics
A picking error is not only a warehouse error. It can create a return, replacement shipment, customer service ticket, inventory adjustment, refund, and margin loss.
Similarly, slow receiving is not only an inbound warehouse problem. It can cause stockouts, poor purchasing decisions, delayed ecommerce availability, and inaccurate financial reporting.
Therefore, warehouse metrics should connect to business outcomes. Otherwise, the company may improve a local number while the broader operation stays inefficient.
12. When to upgrade warehouse productivity tracking
A business does not need advanced software on day one. However, certain signals show that manual tracking or disconnected tools are no longer enough.
12.1 Signs spreadsheets are breaking down
Spreadsheets may be breaking down when inventory discrepancies increase, employees update the same data in several places, managers stop trusting reports, and orders are delayed because stock cannot be found.
Other signs include manual purchasing exports, finance waiting for warehouse adjustments, Shopify inventory mismatches, and warehouse staff spending too much time updating sheets after the work is done.
When these symptoms appear repeatedly, the issue is usually not effort. Instead, the business has outgrown manual visibility.
12.2 Signs a standalone warehouse app is not enough
A standalone warehouse app may improve execution while the rest of the business remains disconnected.
Common signs include manual accounting reconciliation, spreadsheet purchasing, separate forecasting files, difficult inventory valuation, inconsistent multi-warehouse reporting, and ecommerce orders that do not share clean inventory data.
In that situation, the warehouse may look better locally, yet leadership still lacks one version of operational truth.
12.3 Signs ERP may be needed
ERP may be needed when warehouse productivity metrics must connect with broader operations.
This usually happens when a business manages multiple warehouses, Shopify, Amazon, wholesale customers, EDI, manufacturing, purchasing teams, forecasting requirements, accounting complexity, or detailed reporting needs.
For readers exploring whether their business fits this stage, the industries Xorosoft serves page can help connect operational requirements across apparel, furniture, sporting goods, food, wholesale, and manufacturing. Additionally, XoroONE provides a broader view of how cloud ERP can unify warehouse, inventory, purchasing, accounting, manufacturing, forecasting, and reporting workflows.
13. FAQ: Warehouse productivity metrics
13.1 What are warehouse productivity metrics?
Warehouse productivity metrics are KPIs that measure how effectively warehouse teams receive, store, pick, pack, ship, return, and manage inventory. They help managers understand labor output, picking speed, order accuracy, inventory accuracy, warehouse throughput, capacity utilization, and fulfillment cost. As a result, teams can make decisions from measurable performance rather than assumptions.
13.2 Why are warehouse productivity metrics important?
Warehouse productivity metrics matter because they reveal where labor, inventory, time, and money are being wasted. Without these KPIs, managers may only notice problems after orders are late, stock is wrong, or costs rise. However, with the right dashboard, teams can identify bottlenecks earlier and improve warehouse performance before customers feel the impact.
13.3 What are the most important warehouse productivity metrics?
The most important warehouse productivity metrics include labor productivity, pick rate, picking accuracy, order cycle time, dock-to-stock time, inventory accuracy, cost per order, warehouse throughput, capacity utilization, and perfect order rate. Together, these metrics measure speed, accuracy, cost, space, labor output, and customer-facing fulfillment quality.
13.4 How do you measure warehouse productivity?
Warehouse productivity is measured by comparing output against labor hours, time, cost, or space. For example, a team may measure orders picked per hour, units received per labor hour, orders shipped per day, or warehouse cost per order. Because every warehouse is different, the right formula depends on the workflow and business model.
13.5 What is the formula for warehouse labor productivity?
The basic formula is total warehouse output divided by total labor hours. Output may mean orders, units, cases, pallets, lines, or kits. For example, if a team ships 1,000 orders using 100 labor hours, labor productivity equals 10 orders per labor hour.
13.6 What is a good warehouse productivity rate?
A good warehouse productivity rate depends on SKU complexity, order profile, automation level, warehouse layout, labor model, and business type. Therefore, ecommerce, wholesale, and manufacturing warehouses should not use the same benchmark blindly. The better approach is to create an internal baseline, then improve performance over time.
13.7 What is pick rate in a warehouse?
Pick rate measures how many items, order lines, or orders workers pick during a set period. It is usually calculated as total picks divided by total picking hours. However, pick rate should always be reviewed with picking accuracy because fast picking with high error rates creates rework and customer issues.
13.8 How do you calculate picking accuracy?
Picking accuracy is calculated by dividing accurate picks by total picks, then multiplying by 100. For example, if 9,800 picks are accurate out of 10,000 total picks, picking accuracy is 98%. This metric helps teams reduce wrong items, wrong quantities, returns, replacements, and manual corrections.
13.9 What is dock-to-stock cycle time?
Dock-to-stock cycle time measures how long it takes for received inventory to become available for sale, fulfillment, transfer, or production. It starts when goods arrive at the dock and ends when inventory is counted, verified, stored, and updated in the system. Shorter dock-to-stock time improves stock availability.
13.10 What is order cycle time?
Order cycle time measures the time between order receipt and shipment. It shows how quickly the warehouse can process demand. If order cycle time increases, the cause may be picking delays, packing bottlenecks, inventory availability issues, poor order routing, or missed carrier cutoffs.
13.11 What is inventory accuracy?
Inventory accuracy measures how closely system inventory matches physical inventory. High inventory accuracy means the business can trust available stock numbers. Low accuracy creates stockouts, overselling, search time, poor purchasing decisions, accounting issues, and customer service problems.
13.12 What is cost per order?
Cost per order measures how much warehouse cost is required to process and ship one order. It is calculated by dividing total warehouse operating cost by total orders shipped. This metric helps leaders understand whether fulfillment is becoming more or less profitable as volume grows.
13.13 What is warehouse throughput?
Warehouse throughput measures the amount of work or inventory processed during a specific period. It may include units received, orders picked, cartons packed, pallets shipped, or returns processed. Because throughput shows capacity under real volume, it is useful for staffing, seasonal planning, and expansion decisions.
13.14 What is capacity utilization in a warehouse?
Capacity utilization measures how much warehouse storage capacity is being used. It is calculated by dividing used capacity by total available capacity, then multiplying by 100. However, very high utilization can reduce productivity if aisles, bins, or staging areas become overcrowded.
13.15 What is perfect order rate?
Perfect order rate measures the percentage of orders shipped complete, accurate, on time, undamaged, and with correct documentation. This metric is valuable because it combines several warehouse outcomes into one customer-facing KPI. Therefore, it is useful for executives as well as warehouse managers.
13.16 Which metrics should ecommerce warehouses track?
Ecommerce warehouses should track order cycle time, pick-pack-ship speed, order accuracy, on-time shipping rate, return rate, inventory accuracy, and cost per order. Because ecommerce customers expect fast and accurate fulfillment, these metrics connect warehouse execution directly to customer experience.
13.17 Which metrics should wholesale warehouses track?
Wholesale warehouses should track case picking accuracy, pallet picking accuracy, fill rate, EDI order accuracy, allocation accuracy, dock-to-stock time, and customer-specific compliance. These metrics matter because wholesale orders are larger, documentation requirements are stricter, and errors can create chargebacks or delayed payments.
13.18 Which metrics should manufacturers track?
Manufacturers should track raw material availability, component picking accuracy, work order kit accuracy, production delay rate, finished goods putaway time, and inventory accuracy. Since warehouse issues can stop production, these metrics help protect production schedules and material planning.
13.19 How often should warehouse KPIs be reviewed?
Warehouse managers should review daily metrics every day, especially delayed orders, picking errors, dock-to-stock delays, labor hours, and inventory exceptions. Operations leaders should review weekly trends. Meanwhile, executives should review monthly metrics such as cost per order, perfect order rate, inventory discrepancy value, and capacity risk.
13.20 Can spreadsheets track warehouse productivity metrics?
Spreadsheets can track basic warehouse productivity metrics for very small operations. However, they become difficult to maintain as SKUs, order volume, channels, locations, and staff increase. In addition, spreadsheets usually lack barcode validation, real-time updates, workflow control, and integrated reporting.
13.21 When should a business move from spreadsheets to WMS?
A business should consider moving from spreadsheets to WMS when picking errors increase, inventory becomes hard to trust, bin locations are unclear, orders are delayed, or warehouse staff spend too much time updating manual records. A WMS helps improve execution through scanning, directed workflows, and location control.
13.22 When should a business move from WMS to ERP?
A business should consider ERP when warehouse metrics need to connect with purchasing, accounting, forecasting, manufacturing, ecommerce, and reporting. A WMS improves warehouse execution. However, ERP connects warehouse activity to the broader operating model.
13.23 How does barcode scanning improve warehouse productivity?
Barcode scanning improves warehouse productivity by reducing manual entry, validating product movement, confirming bin locations, and lowering picking errors. It also improves inventory accuracy because transactions are captured closer to the point of work instead of being entered later from memory or paper notes.
13.24 How does ERP improve warehouse productivity metrics?
ERP improves warehouse productivity metrics by connecting warehouse activity with inventory, purchasing, accounting, ecommerce, manufacturing, forecasting, and reporting. As a result, leaders can see how warehouse performance affects stock availability, fulfillment cost, inventory valuation, purchasing decisions, and customer service.
13.25 What is the difference between WMS and ERP for warehouse metrics?
A WMS focuses on warehouse execution, including receiving, putaway, picking, packing, shipping, and bin tracking. ERP connects warehouse data with broader business workflows such as purchasing, accounting, inventory valuation, sales orders, forecasting, and reporting. Many growing companies eventually need both capabilities connected.
13.26 What warehouse productivity metrics should CEOs track?
CEOs should track perfect order rate, inventory accuracy, cost per order, order cycle time, labor productivity trend, fulfillment cost trend, return cost trend, and warehouse capacity risk. These metrics connect warehouse work to customer experience, margin, cash flow, and scalability.
13.27 How do warehouse metrics affect cash flow?
Warehouse metrics affect cash flow because inventory accuracy, receiving speed, overstock, stockouts, fulfillment errors, and returns all influence working capital. When warehouse data is accurate, purchasing teams buy better, finance teams value inventory more reliably, and fulfillment teams reduce costly rework.
13.28 What are common mistakes when tracking warehouse KPIs?
Common mistakes include tracking too many KPIs, measuring speed without accuracy, ignoring labor context, using outdated spreadsheet data, and separating warehouse metrics from business metrics. Therefore, a strong KPI program should focus on actionable numbers that help teams improve decisions.
14. Final thoughts on warehouse productivity metrics
Warehouse productivity metrics are not just dashboard numbers. They are operating signals that show whether the warehouse can support growth without adding unnecessary labor, rework, cost, and complexity.
The most useful metrics measure speed, accuracy, labor output, cost, capacity, inventory reliability, and customer impact. However, the real value appears when those numbers lead to better decisions. If pick rate drops, the team should know whether the issue is slotting, staffing, training, inventory availability, or order mix. Once inventory accuracy declines, leaders should know whether the cause is receiving, putaway, picking, transfers, returns, or system updates.
As companies grow, warehouse productivity becomes more connected to the rest of the business. Purchasing needs accurate stock movement. Finance needs reliable inventory valuation. Ecommerce teams need real-time availability. Wholesale teams need clean allocation. Manufacturing teams need material readiness.
For inventory-driven businesses that have outgrown QuickBooks, spreadsheets, and disconnected warehouse apps, Xorosoft can help connect warehouse management, inventory, purchasing, accounting, manufacturing, forecasting, Shopify, Amazon, EDI, and reporting in one cloud ERP system.
To see how connected warehouse, inventory, purchasing, accounting, and reporting workflows can improve operational visibility, book a demo.