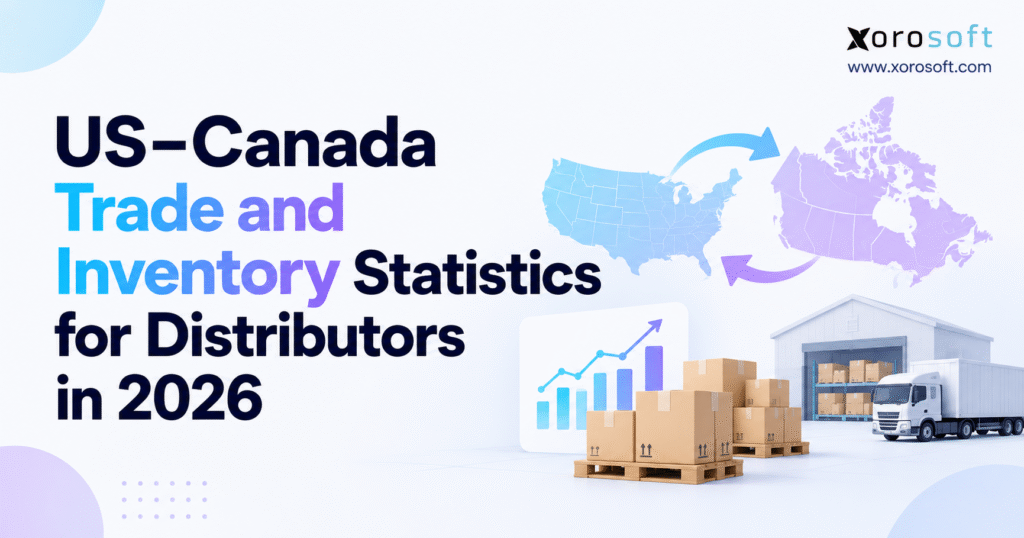
This article provides an overview of US Canada trade statistics 2026.
1. US Canada Trade Statistics 2026 Are Reshaping Distributor Inventory Planning
For distributors, cross-border trade data has become an inventory planning issue rather than simply an economic indicator. Changes in trade flows can quickly affect supplier lead times, purchase-order timing, landed cost, safety stock, warehouse allocation, margins, and the amount of cash tied up in inventory.
That makes US Canada trade statistics 2026 especially relevant to wholesale distributors, manufacturers, ecommerce operators, and other inventory-driven businesses.
The latest figures show meaningful movement on both sides of the border. In August 2026, the United States recorded $29.9 billion in goods exports to Canada and $37.1 billion in imports from Canada, resulting in a $7.1 billion U.S. goods deficit with Canada. The deficit increased by $4.1 billion from July because imports rose much faster than exports.
Wholesale inventory data adds another layer. The U.S. Census Bureau reported that merchant wholesaler inventories reached $958.9 billion at the end of July 2026, up 1.3% from June and 5.7% from July 2025. Wholesale sales reached $801.3 billion, while the inventory-to-sales ratio stood at 1.20 compared with 1.28 a year earlier.
Canada showed a different inventory profile. Statistics Canada measured C$140.6 billion in wholesale inventories in July within its analytical series that excludes petroleum, petroleum products, other hydrocarbons, oilseed, and grain. The inventory-to-sales ratio edged down from 1.52 to 1.51.
Those figures matter, but the operating question matters more: Is inventory moving in line with demand, or are changing trade conditions pushing distributors toward stockouts, overbuying, margin compression, and higher working-capital requirements?
1.1 Why US Canada trade statistics 2026 matter at the SKU level
A national increase in imports does not mean every distributor should buy more inventory. The impact depends on product category, country of origin, tariff treatment, supplier reliability, customer demand, lead time, and the warehouses serving each market.
An automotive-parts distributor may prioritize service levels and replacement-part availability. Apparel companies usually face more markdown and obsolescence risk. Furniture distributors must pay close attention to freight and warehouse capacity, while food companies also need to manage shelf life, lot control, and expiration.
These differences explain why US Canada trade statistics 2026 should trigger analysis rather than automatic purchasing decisions.
The most useful question is not, “Are imports rising?”
Instead, management should ask, “Which of our products, suppliers, warehouses, and customer commitments could this change affect?”
That shift moves trade statistics from the economics department into day-to-day inventory planning.
1.2 Trade growth and inventory health are not the same thing
A spike in imports can signal stronger demand, but import growth can also reflect companies pulling purchases forward ahead of tariffs, expected supply interruptions, or seasonal peaks.
Higher inventory creates a similar interpretation problem.
A distributor may hold more stock in total while simultaneously running out of its highest-demand products. Excess inventory in slow-moving SKUs does not solve shortages elsewhere in the assortment.
Experienced inventory teams therefore study aggregate trade data alongside demand, inbound purchase orders, inventory aging, turnover, fill rates, forecast accuracy, warehouse availability, and landed margin.
The connection between those measures matters more than any individual number.
2. US Canada Trade Statistics 2026: Cross-Border Activity at a Glance
The United States and Canada maintain deeply connected supply chains across manufacturing, distribution, energy, agriculture, consumer products, automotive, industrial goods, and ecommerce.
Goods can cross the border more than once before a customer receives the final product. A U.S. manufacturer may sell a component to a Canadian company, which uses that component in a finished product and later ships the completed item back to the United States.
For distributors, that interconnected structure means a disruption can affect far more than the final imported product.
2.1 US Canada bilateral trade data for August 2026
The August figures provide a useful snapshot of current bilateral activity.
| Trade Metric | Latest Reported Figure | Period |
|---|---|---|
| U.S. goods exports to Canada | US$29.9B | August 2026 |
| U.S. goods imports from Canada | US$37.1B | August 2026 |
| U.S. goods balance with Canada | -US$7.1B | August 2026 |
| Monthly increase in U.S. exports to Canada | +US$0.5B | August 2026 |
| Monthly increase in U.S. imports from Canada | +US$4.6B | August 2026 |
The U.S. Census Bureau and Bureau of Economic Analysis publish the underlying international trade figures in their monthly trade releases: U.S. International Trade in Goods and Services.
Month-to-month changes should function as signals rather than direct purchasing instructions. One stronger import month does not justify a broad inventory build.
A distributor should instead compare the external movement with what it sees internally. Supplier orders, freight bookings, customer demand, purchase-order lead times, and sales forecasts provide the operational context that national statistics cannot.
2.2 Canada US trade statistics require consistent definitions
Companies sometimes place U.S. and Canadian trade statistics side by side and expect the figures to match exactly.
They often do not.
Government agencies use different statistical conventions for valuation, timing, seasonal adjustment, re-exports, customs treatment, and other reporting factors. Currency creates another obvious difference when one dataset reports in U.S. dollars and another in Canadian dollars.
The U.S. Bureau of Economic Analysis explains these adjustments in its international trade reporting methodology.
For management reporting, consistency matters more than finding one supposedly perfect number. Choose an authoritative series, understand its definition, and use the same basis over time.
Switching datasets from month to month can create trends that do not actually exist.
2.3 Cross-border trade trends eventually reach operations
Macroeconomic trade movement can influence operations through several routes. Suppliers may change production plans, transportation capacity can tighten, border processing may slow, currency movements can alter acquisition cost, and tariff changes can shift purchase timing.
Businesses do not need to forecast total bilateral trade to benefit from US Canada trade statistics 2026.
They need to identify whether external conditions are changing the variables that drive their own inventory decisions.
A useful review asks whether supplier lead times have moved, freight costs have changed, customers are ordering differently, landed costs are increasing, or inventory is accumulating faster than sales.
Once management links those questions to the external data, trade statistics become useful operating information.
3. US Wholesale Inventory Statistics 2026 Show Why Sales and Stock Must Be Read Together
Trade figures show how merchandise moves across borders. Wholesale statistics reveal what happens as goods move through the distribution system.
The U.S. Census Bureau reported merchant wholesaler sales of $801.3 billion in July 2026. Sales increased 0.8% from June and 13.0% from July 2025.
Inventories reached $958.9 billion, rising 1.3% month over month and 5.7% year over year.
The relationship between those two figures deserves attention because sales grew substantially faster than inventories over the annual comparison.
3.1 US wholesale inventory-to-sales ratio in 2026
The U.S. merchant wholesaler inventory-to-sales ratio stood at 1.20 in July 2026, down from 1.28 in July 2025.
At its simplest:
Inventory-to-Sales Ratio = Inventory ÷ Monthly Sales
The ratio estimates how much stock wholesalers carry relative to the current monthly pace of sales.
When the ratio falls, inventory is generally moving faster relative to sales. That can improve working-capital efficiency, but businesses should also verify that the lower inventory level still supports service expectations.
A rising ratio deserves investigation for different reasons. Companies may have intentionally built stock, sales may have softened, supplier minimums may have increased, or slow-moving inventory may be accumulating.
Context decides whether the movement represents healthy preparation or growing risk.
3.2 Lower inventory does not automatically mean healthier inventory
Many businesses focus heavily on reducing inventory because stock consumes cash.
The logic makes sense, but inventory reduction can go too far.
If a company cuts inventory aggressively, customers may face stockouts, the warehouse may rely on emergency replenishment, sales teams may lose wholesale orders, and purchasing teams may pay more for expedited freight.
The right inventory target depends on the economics of availability.
Consider a high-margin replacement part with stable demand, limited substitutes, and an eight-week supplier lead time. Carrying additional safety stock may produce a better financial outcome than repeatedly losing sales.
A seasonal product with unpredictable demand creates the opposite risk. Large safety stock may become obsolete before the next replenishment cycle ends.
3.3 Distributor inventory benchmarks need product-level context
National benchmarks provide context, not stocking rules.
A distributor needs to consider demand variability, supplier performance, minimum order quantities, product lifecycle, gross margin, seasonality, storage cost, replacement options, and service commitments.
Comparing company performance with US Canada trade statistics 2026 and national wholesale benchmarks can help management identify unusual movement.
If the wider market shows stable inventory while a company’s stock rises 30%, management should understand why.
The same logic applies when company inventory falls sharply. Faster turns may reflect excellent execution, but they can also indicate that the business has become too lean.
4. Canada Wholesale Inventory Statistics 2026 Show a Different Stock Profile
Canadian wholesale statistics provide another useful reference point for cross-border distributors.
Statistics Canada reported C$140.6 billion in wholesale inventories for July within its analytical series that excludes petroleum, petroleum products, other hydrocarbons, oilseed, and grain.
The inventory-to-sales ratio edged down from 1.52 in June to 1.51 in July.
Statistics Canada describes the ratio as the number of months businesses would need to exhaust inventory if sales continued at their current rate. The agency publishes the detailed monthly data through its Wholesale Trade report.
4.1 Canada wholesale inventory-to-sales ratio in 2026
Canada’s 1.51 ratio sits above the U.S. merchant wholesaler ratio of 1.20, but businesses should resist the temptation to treat that difference as a direct measure of efficiency.
The two statistical systems do not cover identical categories or use identical methodologies.
Industry composition also matters. A market with more long-lead-time or inventory-intensive products can naturally carry a higher ratio than one dominated by categories that replenish quickly.
The best interpretation focuses on direction within each series rather than using one country’s ratio as a target for the other.
4.2 Canada wholesale inventory trends should be compared with company performance
Imagine that a Canadian distributor sees its own inventory-to-sales ratio increase from 1.45 to 1.90 while the national series stays relatively stable.
That gap deserves investigation.
Purchasing teams may have bought ahead of tariffs. Sales may have softened in one category. Supplier minimums could have increased. Inventory may sit in the wrong warehouse, or outdated forecasts may continue generating purchase orders.
The national benchmark will not identify the specific cause.
It does, however, tell management that the company’s movement appears more extreme than the broader market trend.
4.3 US vs Canada inventory statistics: focus on the relationship between stock and sales
A simple two-variable framework often produces more useful insights than looking at inventory alone.
| Inventory Movement | Sales Movement | Operational Interpretation |
|---|---|---|
| Rising | Rising | Growth or deliberate stock build |
| Rising | Falling | Potential excess inventory |
| Falling | Rising | Lean inventory or stockout exposure |
| Falling | Falling | Destocking or demand weakness |
Management should then investigate the product and location mix behind the movement.
For example, rising company-wide inventory may still hide shortages in fast-moving items. Falling stock may look efficient while customer fill rates deteriorate.
The relationship between inventory, sales, and availability tells the fuller story.
5. US Canada Trade Statistics 2026, Tariffs, and Landed Cost
Trade policy has become one of the most important variables in cross-border inventory economics.
The July 2026 USMCA joint review added uncertainty to the operating environment. USTR stated that the parties did not renew the agreement in its current form during that meeting, but the agreement remains in force while discussions continue. The agency published its position in the USMCA Joint Review statement.
For distributors, political interpretation matters less than operational preparedness.
Classification, country of origin, tariff exposure, documentation, sourcing flexibility, and landed cost all influence what inventory actually costs.
5.1 Tariffs can change inventory economics before demand changes
A tariff can raise the economic cost of a purchase order even when the supplier, product, and customer stay exactly the same.
That change can force management to revisit selling prices, gross-margin targets, supplier choices, order quantities, replenishment schedules, and safety-stock policies.
This is why cross-border purchasing teams should avoid planning from supplier price alone.
The invoice price represents only one part of the cost required to make inventory available for sale.
5.2 Landed cost should guide cross-border purchasing
Landed cost captures the broader acquisition cost of inventory.
Depending on the transaction, it may include supplier price, freight, insurance, duties, tariffs, brokerage, handling, and other costs directly associated with bringing the product to its usable location.
Suppose a supplier quotes a product at $100.
If freight, brokerage, customs, and tariff exposure push the actual delivered cost to $125, a purchasing model based on $100 will overstate margin and understate working-capital requirements.
That additional $25 can also change the economics of reorder quantities.
An order size that looked efficient under the original cost structure may no longer produce the same return once the business includes all cross-border expenses.
5.3 Buying ahead of tariffs can create expensive excess stock
Purchasing early before a tariff change may reduce acquisition cost on qualifying inventory.
That does not make early buying automatically profitable.
The distributor trades tariff risk for inventory risk.
More stock requires more cash, warehouse space, insurance, handling, and financing. Products can become obsolete, customer demand can change, and seasonal windows can close before the business sells through the additional inventory.
A better analysis compares the tariff savings with the expected carrying cost and demand risk.
If avoiding $200,000 in tariffs requires the company to carry $4 million of uncertain inventory for a year, management needs a more complete financial model before approving the purchase.
5.4 USMCA and CUSMA still require operational discipline
Because the agreement remains active, qualifying goods can continue to benefit from its framework. That does not mean every shipment between the United States and Canada automatically receives favorable treatment.
Distributors need accurate product classifications, country-of-origin information, supplier documentation, and rules-of-origin analysis.
A strong inventory process therefore connects customs information with the item master rather than maintaining important trade data in separate spreadsheets.
When purchasing teams understand tariff exposure at the SKU level, they can calculate landed cost before creating the purchase order instead of discovering the true cost after the goods arrive.
6. Using US Canada Trade Statistics 2026 for Better Replenishment
Trade information becomes most useful when it improves a specific operating decision.
Replenishment provides one of the clearest examples.
A distributor that sees tariff pressure, border delays, or less reliable supplier performance should review its planning variables rather than automatically increasing every SKU’s inventory.
6.1 Cross-border lead times should come from actual receiving history
A basic reorder formula looks simple:
Reorder Point = Expected Demand During Lead Time + Safety Stock
The challenge lies in the inputs.
A supplier master may show a 21-day lead time even though recent purchase orders take anywhere from 20 to 38 days before the warehouse can actually sell the goods.
Purchasing teams should measure the entire replenishment cycle.
That includes purchase-order creation, supplier preparation, departure, transportation, customs processing, receiving, inspection, and put-away.
Using the complete cycle gives planners a more accurate understanding of how long replenishment truly takes.
6.2 Safety stock planning for US Canada distributors
Safety stock should protect the business against uncertainty, not hide poor data.
Before raising safety-stock levels, management should determine why stockouts occur.
Inaccurate on-hand balances, unposted receipts, delayed transfers, missing commitments, or weak forecasts can create shortages even when the business owns enough inventory.
Once teams trust the underlying data, they can segment safety stock using demand variability, replenishment variability, service targets, margin, product lifecycle, supplier reliability, and substitution options.
This approach protects strategically important products without overinvesting in the entire catalog.
6.3 Working capital belongs in every replenishment decision
Operations often thinks in units while finance thinks in dollars.
Cross-border inventory planning requires both views.
If management decides to add $3 million of stock because lead-time uncertainty has increased, finance needs to understand what that investment will accomplish.
Will it protect high-margin sales? Does the company need additional warehouse space? Will borrowing increase? How quickly should the stock convert back into cash?
An inventory decision becomes stronger when management connects service protection with capital efficiency.
That discipline matters even more when US Canada trade statistics 2026 point to changing trade conditions.
7. Multi-Warehouse Inventory Management for US Canada Distributors
Cross-border distributors often discover that total inventory is less useful than available inventory.
A company may own 20,000 units of an item but have only 4,000 units available for new demand after customer commitments, safety stock, channel reservations, quality holds, and location restrictions.
The larger the warehouse network becomes, the more important those distinctions become.
7.1 Available inventory matters more than total on-hand stock
On-hand inventory answers a physical question: how much product exists?
Available inventory answers the operational question: how much can the company still promise?
Committed stock represents units already allocated to orders or other requirements. Inbound supply adds another dimension because future receipts may influence today’s buying plan without supporting today’s customer promise.
When distributors operate multiple warehouses, 3PL facilities, or cross-border locations, spreadsheets struggle to maintain those relationships reliably.
Warehouse-intensive businesses may use a system such as XoroWMS to connect receiving, inventory locations, barcode processes, picking, transfers, cycle counting, and warehouse control.
7.2 Cross-border warehouse transfers require economic analysis
Moving inventory between warehouses affects more than quantity by location.
Transportation cost, customs treatment, handling, temporary unavailability, lead time, and regional demand all influence the economics of a transfer.
Planners should therefore allocate inventory according to expected demand and service requirements.
If an item sells rapidly in Toronto but moves slowly from a U.S. warehouse, shifting inventory simply to equalize location balances can worsen customer availability.
Inventory balance does not mean every warehouse should hold the same quantity.
It means each location should hold an economically justified amount for the demand it serves.
7.3 Shopify, Amazon, wholesale, and EDI compete for the same stock
Many distributors support several sales channels simultaneously.
Shopify may serve direct-to-consumer demand while Amazon, wholesale customers, retail accounts, B2B portals, and EDI partners draw from the same physical inventory.
Imagine a warehouse that holds 1,000 units.
Wholesale orders have already committed 250 units, the company protects 100 for another channel, safety stock accounts for another 100, and quality control has placed 50 units on hold.
The business therefore has only 500 units available for new demand.
An integration strategy becomes increasingly important as these channels multiply. Companies can review the Xorosoft integrations ecosystem when evaluating how commerce, warehouse, fulfillment, and financial systems connect.
Shopify operators can also review the Xorosoft ERP listing on the Shopify App Store as one example of linking ecommerce orders and inventory with broader ERP processes.
8. Inventory KPIs to Track Alongside US Canada Trade Statistics 2026
External trade statistics describe the environment around a distributor.
Internal KPIs reveal whether the company is responding effectively.
The strongest management dashboards combine both perspectives rather than treating macroeconomic data and operational data as separate conversations.
| KPI | What It Measures | Management Question |
|---|---|---|
| Inventory turnover | Speed at which stock moves | Is capital moving efficiently? |
| Inventory-to-sales ratio | Inventory relative to sales | Is stock accumulating? |
| Weeks of supply | Expected inventory coverage | How long will current stock last? |
| Fill rate | Demand fulfilled as requested | Are customers receiving what they order? |
| Stockout rate | Frequency of unavailable items | Where are sales at risk? |
| Forecast accuracy | Forecast versus actual demand | Can purchasing trust the plan? |
| Supplier lead time | Time required to replenish | When should purchasing reorder? |
| Inventory accuracy | System quantity versus physical quantity | Can management trust the inventory record? |
| Inventory aging | Time that stock remains unsold | Which products may become obsolete? |
| Landed margin | Profitability after acquisition costs | Is cross-border business still profitable? |
8.1 Forecast accuracy matters more as lead times increase
Forecast errors become more expensive when replenishment takes longer.
A distributor with a local supplier that restocks within three days can recover quickly from unexpected demand.
An importer with an eight-week replenishment cycle cannot.
Longer lead times increase the financial effect of both underforecasting and overforecasting.
Underforecasting creates prolonged stockouts. Overforecasting leaves the company holding inventory for weeks or months longer than planned.
Distributors should therefore measure forecast accuracy by SKU, location, and channel where the business model supports that level of detail.
8.2 Inventory accuracy supports every other inventory KPI
Sophisticated forecasting cannot compensate for unreliable inventory records.
Late receipts, missing transfers, incorrect picks, unrecorded damages, misplaced stock, and delayed adjustments can all produce false availability.
These errors explain why some companies hold large amounts of inventory while still experiencing frequent stockouts.
Strong cycle-counting practices, barcode processes, receiving discipline, timely adjustments, and accurate commitments improve the quality of every downstream planning metric.
Without reliable inventory accuracy, turnover and forecasting calculations rest on an unstable foundation.
8.3 Landed margin provides a better profitability view
A product can look profitable when management compares selling price only with supplier cost.
Cross-border expenses can tell a different story.
Freight, duties, brokerage, tariffs, and other acquisition costs may materially reduce product margin by the time the company makes inventory available for sale.
Landed-margin reporting helps management identify which products remain economically attractive after those costs.
When US Canada trade statistics 2026 or trade-policy developments signal changing cross-border conditions, landed margin can reveal whether sourcing and pricing assumptions still make sense.
9. ERP Requirements for Cross-Border Wholesale Distributors
Revenue alone does not determine when a distributor needs ERP.
Operational complexity provides a better signal.
A smaller company with several warehouses, Shopify, Amazon, manufacturing, wholesale customers, EDI, landed-cost allocation, and complex purchasing can face more demanding systems requirements than a much larger business with a straightforward operating model.
9.1 When inventory complexity outgrows spreadsheets
Systems problems usually appear gradually.
Purchasing begins maintaining its own workbook. The warehouse relies on a separate application. Ecommerce receives another inventory feed. Finance waits for warehouse adjustments before closing the month.
Management reports then require several exports and manual reconciliations before anyone trusts the numbers.
None of these workarounds looks catastrophic by itself.
Together they create delays and inconsistent operating information.
At that stage, companies may evaluate a broader platform such as XoroERP to connect inventory, purchasing, orders, accounting, warehouse activity, manufacturing, and reporting.
9.2 Connected operations matter more than putting everything in one screen
A single source of truth does not require employees to perform every task inside one interface.
Shopify can remain the storefront. A carrier application can continue creating shipping labels. EDI can remain a customer-ordering protocol.
The critical requirement is that inventory, purchasing, sales, fulfillment, and financial activity eventually reconcile into one dependable operating record.
XoroOne represents this broader connected-operations approach by bringing ERP, inventory, commerce, warehouse workflows, and financial activity into a coordinated system.
The objective is not software consolidation for its own sake.
The objective is reducing the number of times employees must manually reconcile competing versions of the same transaction.
9.3 Comparing ERP software for US Canada distribution
Distributors may evaluate NetSuite, Acumatica, Microsoft Dynamics 365 Business Central, Sage, Cin7, Fishbowl, Brightpearl, Xorosoft, and other platforms.
The evaluation should start with process requirements rather than brand recognition.
Management needs to assess inventory control, accounting depth, purchasing automation, forecasting, warehouse management, manufacturing, EDI, ecommerce integrations, reporting, implementation resources, scalability, and total ownership cost.
Businesses specifically researching the two platforms can use the Xorosoft vs NetSuite comparison as one reference point while building a broader requirements matrix.
A good ERP evaluation should answer a simple question: can the system support the company’s actual operating model without recreating the same spreadsheet workarounds inside a new platform?
10. Industry Impact of US Canada Trade Statistics 2026
The same cross-border change can create very different inventory effects across industries.
That is why companies should avoid universal stocking policies.
Product characteristics, demand patterns, lifecycle risk, storage requirements, and supply-chain structure all influence how much inventory makes economic sense.
10.1 Apparel and consumer goods inventory planning
Apparel companies manage inventory across style, color, size, season, warehouse, and channel.
A business may hold plenty of total units while still running out of the specific sizes and colors customers want.
Buying early because of tariff or supply concerns can amplify the problem. Management commits cash before it knows the final demand pattern, and the wrong assortment can require deep markdowns later.
Consumer-product companies face similar challenges when products have short life cycles or promotional demand drives large temporary peaks.
The right response combines supply risk with assortment risk.
10.2 Furniture and sporting goods distribution trends
Furniture inventory creates a different set of economics.
Large physical products consume warehouse capacity, freight often represents a meaningful percentage of cost, and long supplier lead times can make replenishment slow.
A change in transportation or tariff economics can therefore alter margin quickly.
Sporting-goods distributors often face strong seasonal demand. Inventory that arrives after the primary selling window may have much less value than inventory that arrives on time.
For both sectors, US Canada trade statistics 2026 should influence planning assumptions rather than justify a blanket increase in stock.
Companies comparing operational requirements by vertical can review Xorosoft’s industry-specific ERP use cases across distribution, apparel, furniture, manufacturing, and other inventory-driven sectors.
10.3 Food, manufacturing, and industrial distribution
Food and beverage businesses cannot simply solve uncertainty by carrying months of extra inventory.
Shelf life, lot control, expiration dates, storage requirements, and spoilage place natural limits on inventory.
Manufacturers face a different constraint. One missing component can stop production even when every other required material sits in the warehouse.
That makes component-level availability more important than aggregate inventory value.
Industrial and automotive-parts distributors often manage large SKU catalogs. Some critical items justify very high service levels, while thousands of slower-moving parts need much tighter controls.
These examples show why inventory segmentation usually produces better decisions than one company-wide stocking rule.
11. Strategic Priorities From US Canada Trade Statistics 2026
The central lesson from US Canada trade statistics 2026 is not that distributors must predict the next trade-policy announcement.
The stronger strategy is to build an operating model that can respond quickly when assumptions change.
11.1 Map cross-border exposure before changing purchasing policy
Start with the item master rather than the headlines.
Identify which SKUs cross the U.S.–Canada border, which suppliers face tariff or trade exposure, which customers depend on those products, and which warehouses hold them.
Then add commercial context.
How much revenue does each product generate? What margin does it produce? How stable is demand? Can the business source an alternative product? How long does replenishment take?
That information creates a usable risk map.
A low-volume product with several domestic substitutes does not require the same level of attention as a high-margin category that depends on one cross-border supplier.
11.2 Recalculate landed cost, lead time, and safety stock when conditions change
Planning assumptions should evolve with the operating environment.
When freight performance changes, supplier reliability declines, tariff exposure increases, or demand patterns shift, distributors should review landed cost, lead time, reorder points, safety stock, and allocation rules.
The goal is not to change settings every week.
Management should simply prevent stale assumptions from continuing to generate purchase orders long after operating conditions have changed.
A formal monthly or quarterly parameter review often provides more discipline than ad hoc changes driven by the latest headline.
11.3 Build scenarios instead of relying on one forecast
A single forecast creates a false sense of precision during uncertain conditions.
A better approach maintains a baseline scenario along with reasonable upside, downside, and disruption cases.
The baseline reflects expected demand and current supply conditions. An upside scenario models stronger sales. A downside scenario tests weaker demand. A disruption scenario can model longer lead times, tariff increases, transportation issues, or supplier constraints.
These scenarios help management understand the range of potential inventory and cash requirements.
They also make decision-making faster because teams have already discussed how they would respond if conditions move away from the base case.
11.4 Fix visibility gaps before adding more inventory
Many apparent inventory shortages actually come from poor visibility.
Purchasing may not see inbound stock. Warehouse transfers may not update quickly. Committed inventory can sit in another application. Ecommerce channels may publish balances that do not reflect wholesale allocations.
Adding more inventory can temporarily hide those problems, but it does not fix them.
Before materially increasing safety stock, management should trace a representative SKU through the entire transaction cycle.
Follow it from purchase order to receiving, warehouse availability, customer commitment, picking, shipment, landed-cost allocation, and accounting.
Any point that requires employees to re-enter data, reconcile two systems manually, or guess which quantity is correct deserves attention.
Teams evaluating how other inventory-driven businesses handled similar gaps can review Xorosoft’s case studies.
11.5 Use US Canada trade statistics 2026 as an early-warning system
The greatest value of US Canada trade statistics 2026 comes from using the data as an external warning signal rather than an isolated reporting exercise.
Trade data shows how cross-border activity changes. Wholesale statistics indicate whether inventory is building or moving more quickly. Tariff developments affect landed cost. Internal forecasts show expected demand. Warehouse systems reveal physical and available inventory. Accounting shows the impact on margin and cash.
Distributors gain the most value when they connect those signals.
A tariff change then becomes more than a customs issue. Management can see how it affects supplier cost, purchase timing, inventory investment, selling price, margin, and working capital.
Likewise, a higher inventory-to-sales ratio becomes more than a dashboard number. Teams can determine whether stock has accumulated because of deliberate buying, slower demand, forecast errors, or poor inventory allocation.
That ability to connect external conditions with internal actions is the real competitive advantage.
For businesses that have outgrown spreadsheets, QuickBooks, standalone inventory tools, or disconnected warehouse applications, software selection should follow process diagnosis rather than precede it.
Map where information breaks between purchasing, inventory, warehouse operations, ecommerce, wholesale orders, and accounting.
If those gaps create discrepancies, duplicate entry, poor replenishment decisions, or delayed reporting, a connected ERP evaluation becomes reasonable.
Distributors that want to assess those requirements against Xorosoft’s inventory, purchasing, WMS, accounting, ecommerce, manufacturing, and forecasting environment can contact Xorosoft using their actual SKUs, warehouses, supplier workflows, sales channels, and cross-border processes as the evaluation framework.
Frequently Asked Questions
What do US Canada trade statistics 2026 mean for distributors?
They help distributors understand shifts in cross-border demand, imports, exports, tariffs, and supply conditions. Businesses can use these signals to review purchasing, inventory levels, lead times, landed costs, and warehouse allocation.
What is the US wholesale inventory-to-sales ratio in 2026?
The U.S. merchant wholesaler inventory-to-sales ratio was 1.20 in July 2026. Distributors should compare the ratio with their own historical performance, industry characteristics, service levels, and inventory turnover.
What is Canada's wholesale inventory-to-sales ratio in 2026?
Canada’s analytical wholesale series reported an inventory-to-sales ratio of 1.51 in July 2026. Businesses should track changes within the Canadian series rather than compare it directly with U.S. figures.
How do tariffs affect distributor inventory planning?
Tariffs can increase landed cost and influence purchasing timing, order quantities, sourcing decisions, pricing, and safety stock. Distributors should evaluate tariff exposure at the SKU level before changing inventory policies.
Why is landed cost important for cross-border distributors?
Landed cost captures expenses beyond supplier price, including freight, duties, tariffs, brokerage, and handling. Accurate landed-cost calculations help distributors make better purchasing, pricing, margin, and inventory investment decisions.
When should a distributor consider ERP software?
ERP becomes relevant when spreadsheets and disconnected applications create inventory discrepancies, duplicate entry, delayed reporting, manual reconciliation, or poor visibility across purchasing, warehouses, ecommerce, accounting, and fulfillment.
How can distributors reduce cross-border inventory risk?
Distributors can reduce risk by monitoring supplier lead times, improving forecast accuracy, reviewing safety stock, tracking landed costs, segmenting SKUs, maintaining accurate inventory data, and planning multiple demand and supply scenarios.
Recent Posts
-
 Holiday Fulfillment Benchmarks 2026: Capacity, Accuracy, and Shipping Cutoffs
 -
 Inventory and Sales Tracker for Shopify: How to Link Orders, Refunds, Returns, and Stock Changes
 -
 Inventory Audit Readiness: Evidence, Adjustments, Counts, and Reconciliation Controls
 -
 Inventory Management and Tracking vs Warehouse Management: Where Each System Owns Stock Movement
 -
 How a Distributor Reduced Shipping Errors With Pack Station Verification