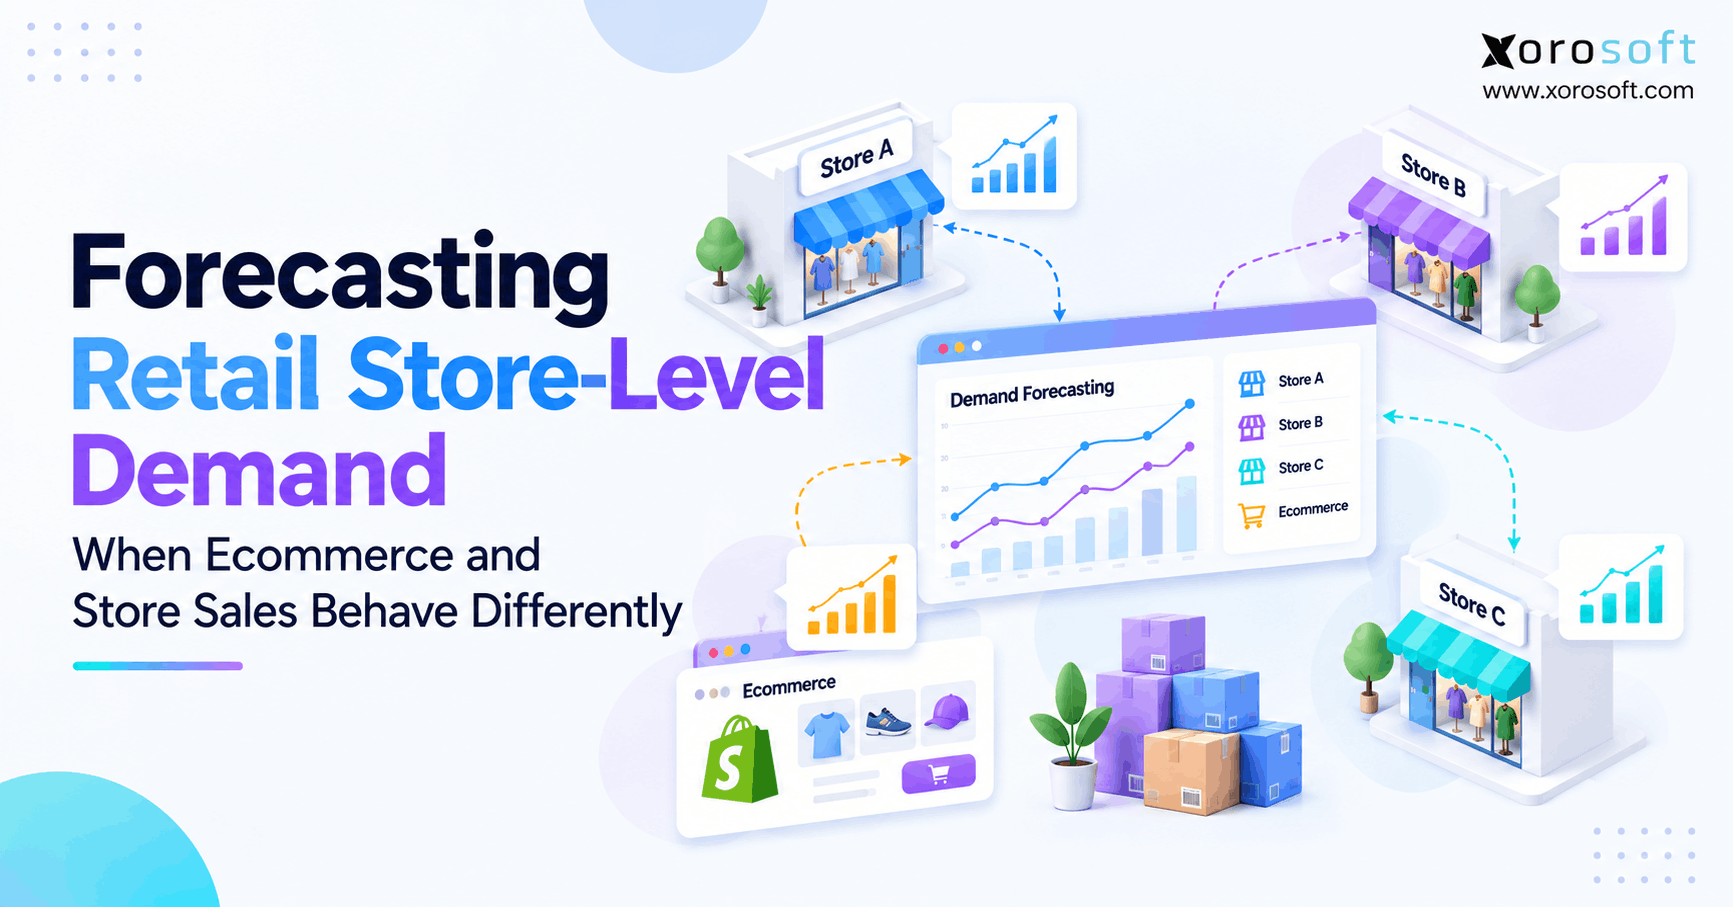
Store-level demand forecasting is an essential process for retailers who want to optimize inventory and meet customer needs.
1. Why One Correct Forecast Can Still Put Inventory in the Wrong Store
Store-level demand forecasting becomes essential when ecommerce and physical stores sell the same products but follow different demand patterns. Because each channel reacts to different signals, one blended forecast can look accurate while still putting inventory in the wrong location. Therefore, retailers need to forecast not only how much they will sell, but also where that demand will occur.
For example, a retailer may correctly forecast 10,000 units across the entire business. However, Store A can still stock out while Store B carries excess inventory. Meanwhile, ecommerce orders may consume stock that planners originally positioned for Store C.
As a result, company-level accuracy does not automatically create location-level accuracy.
1.1 Aggregate demand can hide large local errors
Consider a retailer that forecasts 2,000 units across several channels.
| Demand Location | Forecast | Actual |
|---|---|---|
| Store A | 300 | 470 |
| Store B | 400 | 260 |
| Store C | 200 | 320 |
| Ecommerce | 1,100 | 950 |
| Total | 2,000 | 2,000 |
Although the total forecast is perfectly correct, individual locations are far from correct. Consequently, Store A and Store C may lose sales, while Store B holds inventory that could have sold elsewhere.
Therefore, retailers should measure forecast accuracy at the same level where they allocate and replenish inventory.
1.2 Ecommerce makes location planning more complicated
Ecommerce creates another challenge because the selling channel and fulfillment location may differ.
For instance, an online customer may place an order through Shopify while a nearby retail store ships the product. Therefore, the store loses inventory even though the store itself did not generate the customer demand.
Consequently, modern retail forecasting must distinguish customer demand from inventory consumption.
2. What Store-Level Demand Forecasting Actually Measures
Store-level demand forecasting estimates future product demand for specific retail locations while accounting for differences in SKU, location, channel, time, inventory availability, promotions, and customer behavior.
Therefore, instead of forecasting only total company demand, retailers create forecasts at a more useful operational level.
A common forecasting structure looks like:
SKU × location × channel × period
2.1 Store demand forecasting answers a different question
A company-level forecast answers:
How many units will the business probably sell?
However, a store forecast answers:
Which products will customers probably demand at each location?
Therefore, both forecasts matter, but they support different decisions.
Company-level forecasts can guide broad supplier commitments and financial planning. Meanwhile, location-level forecasts support allocation, store replenishment, transfers, safety stock, and local inventory positioning.
2.2 Store-level forecasting is different from replenishment
Forecasting predicts future demand.
However, replenishment determines what inventory action the business should take.
For example, a store may expect demand of 120 units next month. Nevertheless, the retailer also needs to consider current inventory, inbound stock, safety stock, supplier lead time, and existing purchase orders.
Therefore:
Forecast + inventory position + supply constraints = replenishment requirement
As a result, forecasting should feed replenishment rather than replace it.
3. Why Ecommerce and Store Demand Behave Differently
Store demand and ecommerce demand often respond to different triggers. Therefore, retailers should not automatically apply one demand curve to every selling channel.
Instead, teams should determine whether individual stores, regions, and ecommerce channels show materially different patterns.
3.1 Physical store demand reflects local conditions
Physical stores often respond strongly to local conditions.
For example, demand may change because of:
- local weather;
- neighborhood demographics;
- tourism;
- nearby events;
- store traffic;
- local promotions;
- store assortment;
- regional preferences.
Therefore, two stores selling identical products may still require different forecasts.
A sporting goods retailer provides a simple example. One location may experience a sharp seasonal increase because of a local sports season. Meanwhile, another store may show almost no change.
Consequently, averaging both stores together can hide useful signals.
3.2 Ecommerce demand follows different signals
Ecommerce demand can respond rapidly to digital activity.
For instance, online sales may change because of:
- email campaigns;
- paid advertising;
- influencer exposure;
- social media traffic;
- marketplace promotions;
- website merchandising;
- free-shipping offers;
- flash sales.
Therefore, ecommerce can spike even while physical store traffic remains stable.
Likewise, a local store promotion may increase POS sales without creating the same online lift.
3.3 The same SKU can behave differently by channel
A product does not always behave consistently across channels.
For example, customers may prefer to inspect furniture in person before purchasing. However, those same customers may reorder accessories online later.
Similarly, shoppers may try footwear in a store and then purchase known sizes through ecommerce.
Therefore, store-level demand forecasting should preserve channel differences instead of assuming that one SKU has one universal demand pattern.
4. Store-Level Demand Forecasting Must Separate Demand From Fulfillment
One of the most important forecasting rules is simple:
The location that loses inventory is not always the location that created the demand.
Therefore, retailers should separate demand origin, selling channel, fulfillment location, and inventory location.
4.1 A traditional store sale is simple
Suppose a customer walks into Store A and buys one product.
In that transaction:
- Demand source: Store A
- Selling channel: POS
- Fulfillment location: Store A
- Inventory consumed: Store A
Therefore, every part of the transaction points to the same location.
4.2 Ship-from-store creates two signals
Now suppose a customer places an ecommerce order. However, Store A fulfills it because the warehouse is farther away.
The transaction now looks different:
- Demand source: ecommerce
- Selling channel: online
- Fulfillment location: Store A
- Inventory consumed: Store A
Therefore, Store A loses inventory, but local walk-in demand did not increase.
If the forecasting system counts the transaction as store demand, ecommerce growth can artificially inflate Store A’s forecast.
4.3 BOPIS also needs separate demand attribution
Buy online, pick up in store creates a similar issue.
The customer may discover, select, and pay for the product online. However, inventory comes from the pickup store.
Therefore, retailers usually need two views:
Customer demand view: Where did the customer order?
Inventory requirement view: Which location needs enough stock to fulfill the order?
As a result, both views can be correct even though they answer different questions.
4.4 Transfers are not customer demand
Inventory transfers create another common forecasting mistake.
For example, moving 30 units from Store B to Store A changes the inventory position. However, it does not represent 30 new customer purchases.
Therefore, forecasting data should distinguish sales from transfers.
| Transaction | Demand Source | Inventory Movement | Forecast Treatment |
|---|---|---|---|
| In-store sale | Store | Yes | Customer demand |
| Ecommerce order | Online | Yes | Ecommerce demand |
| Ship-from-store | Online | Store inventory | Keep online demand source |
| BOPIS | Online | Store inventory | Separate demand and fulfillment |
| Store transfer | None | Yes | Do not treat as customer demand |
| Inventory adjustment | None | Yes | Do not treat as demand |
5. Data Needed for Accurate Store-Level Demand Forecasting
Good store-level demand forecasting depends on clean operational data. Therefore, retailers should fix data definitions before investing heavily in more complex models.
Otherwise, sophisticated forecasting can simply automate bad assumptions.
5.1 Start with transaction-level sales data
At minimum, retain:
- SKU;
- variant;
- order date;
- quantity;
- selling location;
- sales channel;
- selling price;
- discount;
- order status;
- return status.
In addition, omnichannel retailers should retain fulfillment information.
Therefore, businesses using several ecommerce, retail, and warehouse systems should make sure those systems exchange consistent transaction identifiers.
For that reason, connected Xorosoft integrations can become relevant when sales, inventory, warehouse, and ecommerce information currently sits in separate applications.
5.2 Track inventory availability history
Sales history shows what customers successfully purchased. However, it does not always show what customers wanted.
For example, imagine that a product normally sells 12 units per day. Then the store runs out and records zero sales for three days.
A basic model may interpret those zeros as falling demand.
However, the real problem is unavailable inventory.
Therefore, retailers should retain historical availability so planners can identify sales periods distorted by stockouts.
5.3 Keep promotions and pricing separate from baseline demand
Promotional demand should not automatically redefine normal demand.
Therefore, track:
- discount depth;
- promotion dates;
- campaign type;
- markdowns;
- bundles;
- pricing changes.
Likewise, keep local store promotions separate from nationwide ecommerce campaigns.
As a result, the forecast can distinguish repeatable baseline demand from temporary promotional lift.
5.4 Connect ecommerce and store data
Retailers using Shopify should also connect ecommerce orders with inventory-location information.
For example, teams evaluating an ERP connection can review the Xorosoft Shopify App Store listing as one example of how Shopify can connect with broader ERP operations.
Therefore, the goal is not simply syncing quantities. Instead, retailers need enough context to understand where demand originated and where inventory was consumed.
6. How to Build a Store-Level Demand Forecast
A strong store-level demand forecasting process starts with the business decision, not the forecasting algorithm.
Therefore, before choosing AI, machine learning, moving averages, or another model, decide what the forecast must support.
6.1 Define the forecasting grain first
First, determine the level at which inventory decisions occur.
For example:
- SKU × store × week;
- SKU × warehouse × week;
- SKU × channel × day;
- category × region × month.
However, more detail does not automatically mean more accuracy.
A slow-moving SKU may not have enough sales to support a reliable weekly forecast for every individual store.
Therefore, use the lowest level of detail that remains statistically useful.
6.2 Clean historical demand before forecasting
Next, remove or identify transactions that do not represent customer demand.
For example:
- inventory transfers;
- cycle-count adjustments;
- supplier receipts;
- warehouse relocations;
- write-offs.
In addition, separate cancelled orders and returns from original customer demand.
Therefore, the forecasting model receives a cleaner signal.
6.3 Correct stockout-distorted history
Next, identify periods when inventory availability constrained sales.
Although no method can perfectly recover unknown demand, planners can estimate likely lost demand using:
- nearby periods;
- similar stores;
- comparable SKUs;
- category trends;
- surrounding demand patterns.
Consequently, the historical series becomes more useful than raw sales alone.
6.4 Build a baseline store forecast
After cleaning the data, establish expected normal demand.
Depending on the SKU and available history, teams may use:
- moving averages;
- exponential smoothing;
- seasonal models;
- regression;
- hierarchical forecasting;
- machine learning.
However, no model should receive automatic preference simply because it appears more advanced.
Instead, compare models against actual forecast performance.
6.5 Add meaningful causal signals
Afterward, add signals that genuinely influence demand.
These may include:
- promotions;
- pricing;
- holidays;
- weather;
- events;
- digital campaigns;
- product lifecycle;
- assortment changes.
However, adding more variables can also add noise.
Therefore, test whether each signal actually improves forecast quality.
6.6 Reconcile detailed and company forecasts
Finally, detailed forecasts should connect to broader planning totals.
For example:
SKU → store → region → channel → company
Therefore, store-level estimates should not create unexplained conflicts with company-level purchasing plans.
Instead, planners should reconcile the hierarchy while preserving legitimate local differences.
7. How Demand Forecasting Should Drive Replenishment
Forecasting creates value only when it changes inventory decisions.
Therefore, store-level demand forecasting should ultimately influence replenishment, purchasing, allocation, and transfers.
7.1 Convert store forecasts into replenishment requirements
Suppose Store A expects 100 units of demand during the replenishment horizon.
However, the store already has:
- 45 units available;
- 10 units inbound;
- a 15-unit safety-stock target.
Therefore, the replenishment requirement is not simply 100 units.
Instead, teams need to combine forecast demand with the complete inventory position.
A connected inventory management system can help teams evaluate demand alongside available, committed, inbound, and location-specific inventory.
7.2 Connect forecasts with purchasing
Next, network-level requirements should influence purchasing.
A simplified calculation may look like:
forecast demand + safety stock − available inventory − inbound inventory = net requirement
However, the final purchase decision must also account for:
- supplier lead times;
- minimum order quantities;
- case packs;
- ordering calendars;
- existing purchase orders.
Therefore, forecast accuracy alone does not solve purchasing.
Xorosoft connects forecasting with purchasing and inventory workflows so planners can move from expected demand to actual supply decisions without rebuilding the entire picture manually.
7.3 Use store forecasts for allocation
Even when a retailer purchases enough inventory overall, it can still allocate that inventory poorly.
Therefore, allocation asks:
Where should available inventory go?
A location-level forecast provides stronger guidance than dividing units evenly across every store.
Consequently, fast-moving locations can receive more stock while slower locations carry less.
7.4 Use transfers to correct imbalance
Forecasts will never eliminate every demand surprise.
Therefore, store-to-store or warehouse-to-store transfers remain important.
For example, Store A may have two weeks of supply while Store B holds eight weeks.
If the transfer cost makes sense, the retailer can move stock before placing another supplier order.
Meanwhile, XoroWMS can support the warehouse execution side of receiving, inventory movement, picking, and fulfillment.
8. Common Store-Level Demand Forecasting Mistakes
Many forecasting errors come from data definitions rather than mathematics.
Therefore, retailers should review the process before assuming they need a more advanced algorithm.
8.1 Forecasting only company totals
Company forecasts can hide major location errors.
Therefore, measure forecast quality at the level where inventory decisions occur.
If stores receive replenishment individually, evaluate store-level forecast accuracy.
8.2 Treating inventory consumption as customer demand
Ship-from-store makes this mistake especially dangerous.
For example, a store may fulfill 200 ecommerce orders because it has available stock.
However, those orders do not prove that local store demand increased by 200 units.
Therefore, retain both the demand source and fulfillment location.
8.3 Ignoring stockouts
Stockouts can create a damaging feedback loop:
low inventory → stockout → low recorded sales → lower forecast → insufficient replenishment
Therefore, teams should identify constrained sales periods before they feed history into future forecasts.
8.4 Applying identical seasonality to every store
Store behavior can change with geography, climate, local events, traffic, and demographics.
Therefore, retailers should test whether stores actually follow the same seasonal curve.
If they do, shared seasonality may work.
However, if they do not, the model should preserve those differences.
8.5 Forecasting at excessive detail
More granularity can create sparse data.
For example, 20,000 SKUs across 40 locations produce 800,000 SKU-location combinations before channels are even added.
Therefore, some combinations may contain too little demand history for stable forecasts.
In those cases, aggregate slow-moving items to category, region, or another useful hierarchy.
8.6 Allowing unexplained overrides
Experienced planners can add useful information that a statistical model cannot see.
However, every manual override should record:
- original forecast;
- changed forecast;
- reason;
- planner;
- eventual actual demand.
Consequently, the organization can learn whether manual intervention improves results.
9. Measuring Forecast Accuracy by Store and Channel
Accurate store-level demand forecasting requires more than one measurement.
Therefore, retailers should use metrics that reveal both error size and error direction.
| Metric | Purpose |
|---|---|
| MAE | Measures absolute unit error |
| WAPE | Weights error by sales volume |
| MAPE | Measures percentage error |
| Forecast Bias | Shows systematic over- or under-forecasting |
| Service Level | Measures ability to satisfy demand |
| Stockout Rate | Tracks availability failures |
| Excess Inventory | Shows over-positioned stock |
9.1 Measure forecast bias as well as error
Suppose a store repeatedly forecasts 100 units but sells 120.
Although the individual errors may not look extreme, the forecast consistently underestimates demand.
Therefore, the forecast shows negative bias.
Consequently, the store may experience repeated stockouts even if average error appears acceptable.
9.2 Measure accuracy at several levels
Retailers should review forecasting performance by:
- SKU;
- category;
- store;
- region;
- channel;
- forecast horizon.
Moreover, compare those results with the company total.
A company forecast may look excellent because store-level errors cancel each other.
Therefore, aggregate accuracy alone can create false confidence.
10. When Store-Level Demand Forecasting Outgrows Spreadsheets
Spreadsheets can work well when a retailer has a small assortment and only a few locations.
However, the planning workload grows quickly as locations, SKUs, channels, suppliers, and warehouses increase.
10.1 SKU-location combinations multiply rapidly
Consider a retailer with:
- 5,000 SKUs;
- 12 stores;
- ecommerce;
- two warehouses.
Even before promotions and suppliers are considered, the business already manages tens of thousands of planning relationships.
Therefore, planners may spend more time reconciling spreadsheets than analyzing demand.
10.2 Disconnected systems create repeated reconciliation
Growing retailers often use combinations such as:
- Shopify;
- QuickBooks;
- POS software;
- inventory apps;
- warehouse systems;
- supplier spreadsheets;
- forecasting spreadsheets.
However, each system may define inventory and transactions differently.
Consequently, planners repeatedly export, clean, match, and reconcile data.
Xorosoft’s XoroERP provides one approach for businesses that want inventory, orders, purchasing, accounting, and operational reporting to work from a more connected data model.
10.3 Not every retailer needs a larger system
However, a small retailer should not add complexity without a clear reason.
For example, a business with two stores, a limited assortment, and predictable purchasing may still forecast effectively with straightforward tools.
Therefore, businesses should upgrade when complexity creates measurable operating problems, not simply because more sophisticated software exists.
11. What Store Demand Forecasting Software Should Support
When retailers evaluate forecasting systems, they should look beyond whether the vendor advertises artificial intelligence.
Instead, the software should support the decisions the planning team actually makes.
11.1 Look for useful forecasting granularity
The system should support appropriate levels such as:
- SKU-location;
- SKU-store-week;
- product-channel-location;
- category-region.
However, it should also allow aggregation when individual demand series become too sparse.
Therefore, flexible hierarchy matters.
11.2 Look for omnichannel demand attribution
The system should distinguish:
where the customer ordered from where inventory was fulfilled.
Otherwise, BOPIS and ship-from-store can contaminate local store demand history.
Consequently, this capability matters increasingly as retailers use stores as fulfillment nodes.
11.3 Look for stockout and promotion handling
Good software should help planners identify periods when inventory availability distorted sales.
Likewise, it should preserve promotion and pricing history.
Therefore, teams can separate normal demand from temporary lift.
11.4 Look beyond forecasting itself
Forecasting should eventually connect with:
- inventory;
- purchasing;
- warehouses;
- transfers;
- suppliers;
- ecommerce;
- accounting;
- reporting.
For inventory-driven companies, XoroONE combines these operating areas within a cloud ERP environment.
Therefore, Xorosoft can be particularly relevant when the forecasting problem also involves disconnected inventory, warehouse, purchasing, and financial workflows.
12. How ERP Connects Store Forecasts to Operations
Forecasting software predicts what may happen.
However, ERP helps the business act on that expectation.
Therefore, ERP becomes especially relevant when forecasting problems are actually data and execution problems.
12.1 Connect forecasts with purchasing
Suppose store-level demand forecasting shows that demand will rise sharply at four locations.
The planning team must then determine:
- available inventory;
- inbound stock;
- supplier availability;
- lead times;
- purchase quantities;
- cash requirements.
Therefore, the forecast should connect naturally with purchasing rather than end in a spreadsheet.
Xorosoft brings purchasing, inventory, forecasting, and related operational data into one environment so teams can move from expected demand toward supply decisions with less manual reconciliation.
12.2 Connect forecasting with warehouse execution
After purchasing inventory, the retailer still needs to:
- receive it;
- put it away;
- allocate it;
- transfer it;
- pick it;
- ship it.
Therefore, forecasting and warehouse execution should exchange useful information without becoming the same process.
For companies operating across several warehouses and stores, that connection can reduce the gap between the planning team and the fulfillment team.
12.3 Connect inventory planning with accounting
Inventory also represents working capital.
Therefore, over-forecasting can increase cash tied up in stock. Meanwhile, under-forecasting can create stockouts, emergency purchases, expedited freight, and expensive transfers.
Consequently, finance needs visibility into inventory value as well as unit demand.
Xorosoft connects ERP, inventory, purchasing, WMS, and accounting processes so operations and finance can work from the same underlying transactions.
13. A Practical Store-Level Demand Forecasting Example
Consider an apparel retailer with:
- 12 retail stores;
- Shopify ecommerce;
- two warehouses;
- 3,000 active SKUs;
- BOPIS;
- ship-from-store.
The company forecasts 1,000 units of a replenishment item for the next planning period.
13.1 The company forecast looks simple
At first, the plan looks straightforward:
Expected demand = 1,000 units
However, purchasing 1,000 units does not tell the business where those units should sit.
Therefore, the planning team needs location-level demand.
13.2 The store forecast creates a different picture
| Demand Stream | Forecast Units |
|---|---|
| Ecommerce | 410 |
| Store A | 160 |
| Store B | 95 |
| Store C | 70 |
| Other stores | 265 |
| Total | 1,000 |
The network total remains exactly the same.
However, planners now have useful information for allocation.
Therefore, they can position inventory according to expected demand rather than distributing stock evenly.
13.3 Ship-from-store changes inventory requirements
Suppose ecommerce expects 410 units. However, stores will probably fulfill 80 of those orders.
The retailer now needs two related views.
First:
Customer demand forecast: ecommerce = 410 units
Second:
Inventory consumption forecast: warehouses + expected store fulfillment
Therefore, a store may need more inventory than its local walk-in forecast suggests.
13.4 The operating flow becomes connected
The planning sequence now becomes:
customer demand → channel forecast → location forecast → inventory requirement → allocation → purchasing → transfer → fulfillment
Consequently, store-level demand forecasting becomes an operational input rather than an isolated statistical report.
14. Who Needs Store-Level Demand Forecasting—and Who Does Not?
Not every retail business needs the same forecasting architecture.
Therefore, companies should match the process to operational complexity.
14.1 Businesses that benefit most
Location-level forecasting becomes increasingly useful when a company:
- operates several stores;
- sells through ecommerce;
- shares inventory across channels;
- uses BOPIS;
- uses ship-from-store;
- operates several warehouses;
- transfers stock frequently;
- manages thousands of SKUs;
- runs local promotions.
Moreover, it becomes especially useful when stockouts and overstock happen simultaneously across different locations.
14.2 Businesses that may not need it yet
A smaller retailer may not need sophisticated location-level modeling when:
- it has one or two stores;
- SKU counts remain low;
- demand is predictable;
- stores do not share inventory;
- replenishment remains straightforward.
Therefore, the goal should not be adding complexity.
Instead, retailers should adopt deeper forecasting when simpler methods can no longer support reliable inventory decisions.
15. Turn Store-Level Demand Forecasting Into Better Inventory Decisions
Retailers do not need every store and channel to behave the same way.
Instead, they need a planning process that preserves meaningful differences.
Therefore, strong store-level demand forecasting keeps four questions separate:
1. Where did customer demand originate?
2. Which channel captured the order?
3. Which location fulfilled it?
4. Which inventory location needs replenishment?
Once teams answer those questions consistently, forecasting becomes much more useful.
As a result, planners can make better replenishment, allocation, transfer, and purchasing decisions.
Moreover, finance gains a clearer connection between forecast assumptions and inventory investment.
For inventory-driven businesses, Xorosoft connects forecasting with inventory, purchasing, warehouse management, ecommerce operations, and accounting. Companies can also explore how these workflows apply across different inventory-driven industries.
Ultimately, the objective is not simply predicting sales more accurately. Instead, the objective is putting the right inventory in the right location before customer demand arrives.
If disconnected systems are making that difficult, Book a Demo to see how Xorosoft can connect forecasting with the operational workflows that follow it.
FAQs About Store-Level Demand Forecasting
What is store-level demand forecasting?
Store-level demand forecasting predicts future product demand at individual retail locations. Therefore, retailers can plan replenishment, allocation, transfers, and safety stock using local demand rather than only company-wide sales.
Should ecommerce and store demand be forecast separately?
Often, yes. Ecommerce and stores respond to different promotions, traffic, geography, and customer behavior. Therefore, forecasting them separately can preserve useful channel-specific patterns.
Should ship-from-store orders count as store demand?
Not automatically. The store fulfills the order, but ecommerce may have generated the demand. Therefore, retailers should track both demand origin and fulfillment location.
How do stockouts affect retail forecasts?
Stockouts suppress recorded sales. Consequently, a forecasting model may mistake unavailable inventory for weak demand unless the retailer identifies and adjusts constrained periods.
What data does store forecasting require?
Useful data includes SKU sales, locations, channels, inventory availability, promotions, prices, returns, transfers, fulfillment methods, purchase orders, and supplier lead times.
When should retailers replace spreadsheet forecasting?
Retailers should consider more connected systems when SKU-location combinations, channels, warehouses, and purchasing workflows create excessive manual reconciliation or repeated inventory errors.
Can ERP support store-level demand forecasting?
Yes. An ERP can connect forecasts with inventory, purchasing, warehouse activity, ecommerce, and accounting. Therefore, teams can turn demand plans into operational actions more efficiently.
Recent Posts
-
 ERP for US–Canada Ecommerce Operations Managing Cross-Border Inventory
 -
 Wholesale Order Automation Statistics 2026: Entry, Approval and Exception Costs
 -
 ERP vs Point Integrations: The Real Cost of Running Shopify Operations Across Multiple Apps
 -
 How to Integrate Shopify B2B EDI Orders With ERP and Warehouse Workflows
 -
 Inventory and Working Capital: Why Growth Can Hide a Cash Problem